How to trade soft commodities
You only need to think about a simple cup of coffee to realise how commonplace soft commodities are.
What are soft commodities?
Soft commodities are used as raw materials and ingredients in the production of food and textiles, which are then consumed in their final form. We also call these genuine consumables.
They are seen as trade or commercial oriented markets rather than investment markets. The distinction is now being broken down by the use of CFDs (cash-settled, non-deliverable contracts) that allow traders to speculate on the rise and fall of soft commodity prices without making or taking delivery of the underlying.
Soft commodities are produced and traded on a global basis and are woven into the fabric of everyday life. But just because they are commonplace, don’t be mistaken for thinking they are uninteresting or static in nature.
Let’s look at the commonly traded soft commodities and the influential factors that impact their price.
Let’s start with that cup of coffee
The chart below shows what percentage of US consumers (by age group) had consumed a cup coffee that day. Survey dates 9th to 23rd of Jan 2017.
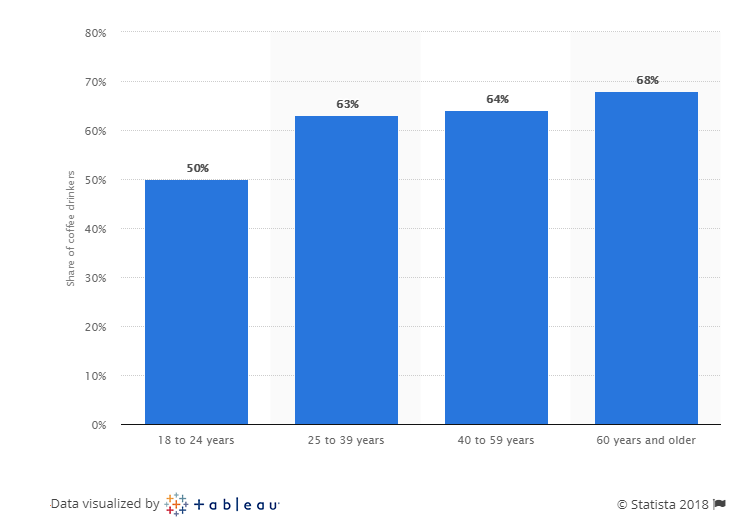
Coffee is one of the most widely consumed commodities in the world.
You might have started your day with a cup - maybe two - of your favourite blend. The coffee shop has become a “third-place” (not work, not home) where we conduct both our business and social lives.
The map below shows that coffee is cultivated in tropical regions around the globe: Southern and Latin America, East Africa, South East Asia, and Australasia.
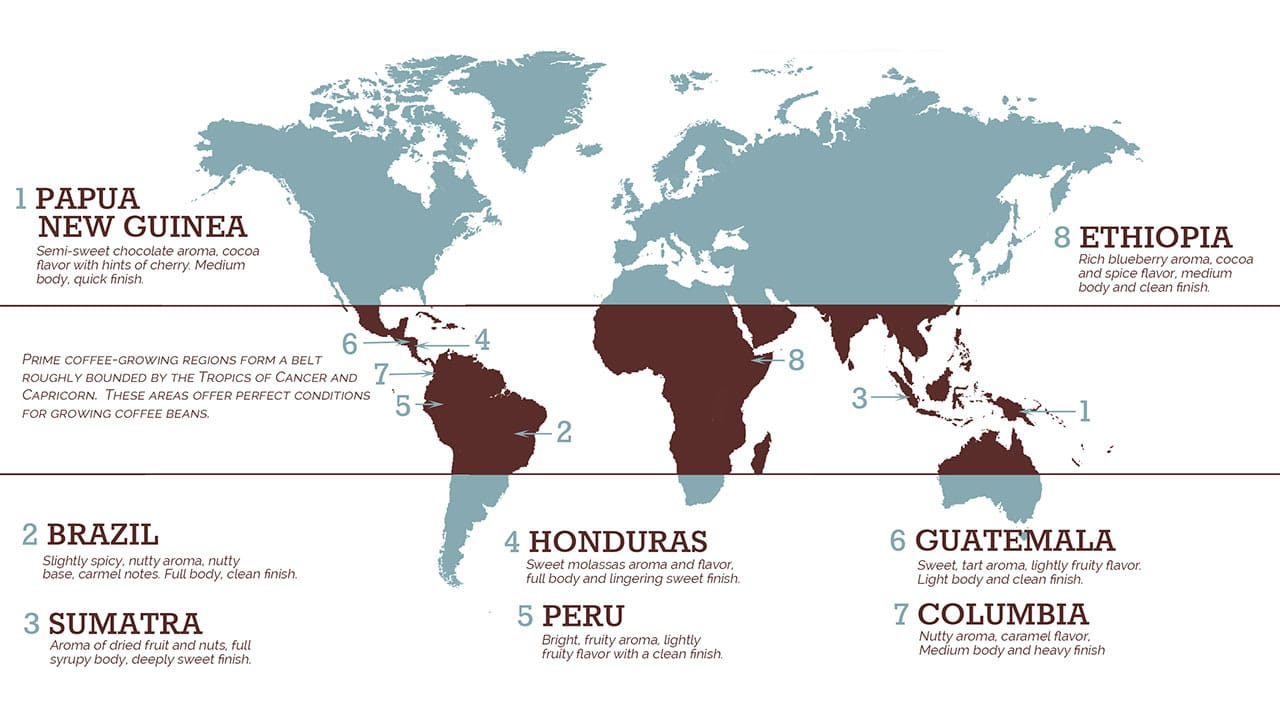
Brazil, Vietnam and Columbia are the world's largest producers. The Dutch are among the world's largest coffee consumers when ranked on a per capita basis.
Factors that influence coffee prices
Climate, weather and the health of the crop all play their part in forming the underlying price for soft commodities.
Coffee is no exception. In 2018, favourable weather in Brazil drove prices lower as markets anticipated a bumper harvest. Brazil produces as much as a third of the world's coffee. So the size of the harvest here is a significant factor on the supply side.
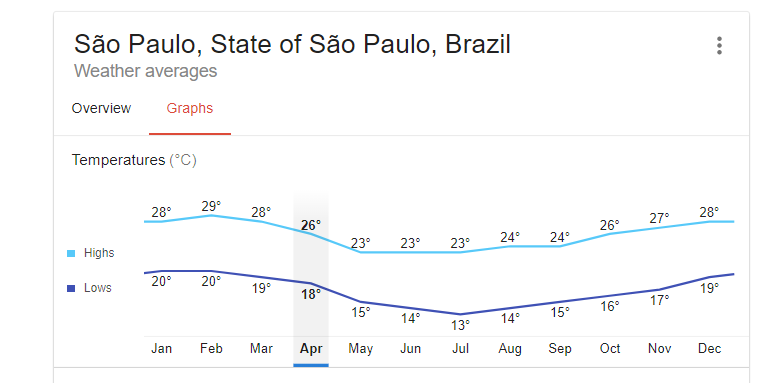
Coffee plants can tolerate cold weather but are highly vulnerable to frost. Surprisingly, Brazil is the only major producer that experiences temperatures cold enough for frost.
White frost can prevent coffee plants from flowering; black frost can kill the plant, which must then be replanted. It can take three to four years for those new plants to come into production.
As we can see from the table below, temperatures in São Paulo (southeastern Brazil), do not typically fall that low. However, it can and does occur (if infrequently) in June and July, which is harvest time for Coffee.
Variable demand
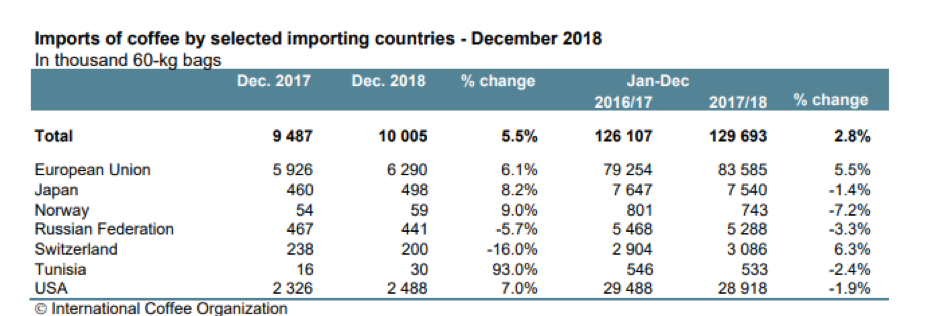
Coffee demand had been declining over recent years. Notably, the USA, Japan and the EU were importing fewer beans. Data from the trade body, the ICO, showed that in the period between October 2016 and October 2017, global coffee imports fell by 3.2%.
But by December 2018 imports were rising once more across Europe and the USA. Oddly though, demand from both Russia and Switzerland fell substantially on a year over year basis, see below.
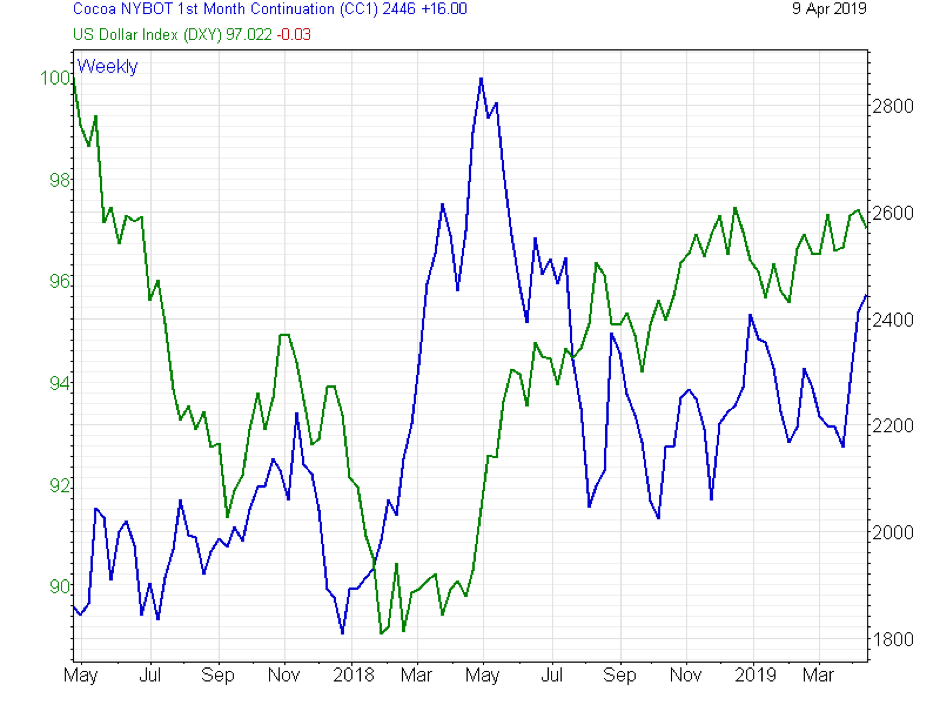
Historically a weaker US dollar should be positive for coffee prices, reducing the cost of coffee for buyers transacting in currencies other than USD.
In recent times, the opposite seems to have been true, in that coffee prices have tended to move in the same rather than the opposite direction to the trade-weighted dollar or dollar index, as we can see in the chart below.
The important contract months in coffee are May and July which fall around harvest time.
This is where most of the open interest in coffee futures can be found. The majority of the volume is concentrated in contacts for the current year and one year forward. Other back months see minimal volume or open interest in comparison.
Trading sugar
Sugar is another truly global commodity. It’s produced in 130 countries and traded across North and South America, Southern and Eastern Asia, as well as Europe and Russia.
Sugar is derived from two separate sources, Sugar Beat and Sugarcane. Sugar Beat grows in the cooler temperatures of Europe and Russia, while Sugarcane favours the tropical climates of Brazil, India and China.
Brazil: producer, consumer, and innovator
Brazil is the world's largest producer of sugar. Its annual production of 38.99 million metric tonnes is around 2.5 times that of the EU states combined.
According to 2016 data from the International Sugar Organization, Sugarcane accounted for around 80% of global sugar production and Brazil accounted for a quarter of combined global annual sugar production.
Sugar is used as a food ingredient and sweetener, but also in animal feeds and more recently as a fuel source in alternative/renewable energy production.
The countries with the biggest ‘sweet tooth’ are India, the EU, China and Brazil (all four are notable producers as well).
Brazil was an early adopter of Bioethanol fuels derived from sugarcane. The use of ethanol as a fossil fuel substitute was ramped up in the country after the oil shocks of the mid-1970s. By the mid-1980s, approximately 75% of all new cars produced in Brazil had biofuel compatible engines. More recently, Ethanol has been used as an additive to traditional gasoline.
The Brazilian experiment is often held up as an example of a sustainable, alternative energy source at scale.
Weather patterns matter
Sugarcane grows in tropical climates and is subject to weather extremes in these regions, including torrential rains and strong winds of tropical storms and hurricanes.
However, the El Niño weather phenomenon, that originates in the Pacific, can reduce rainfall over South America and the Caribbean. A drought can directly affect sugarcane crops.
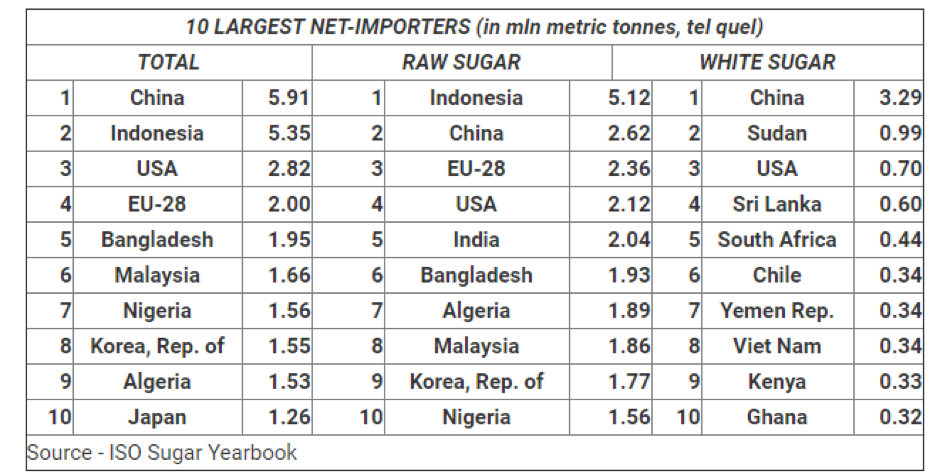
Global sugar demand has been picking up over recent years. China is the world's largest importer of sugar, with Indonesia interestingly a close second, and is the largest importer of unrefined sugars in the world by some margin.
Developing economies in Asia and Africa account for seven of the top ten global importers of sugar. The EU, the USA, and Japan take up the other three places.
Sugar prices are far from static
Sugar prices fell sharply during the first three-quarters of 2018 due to expectations of excess supply, but prices rallied across Q4 2018, before selling off and then rallying again in Q1 2019.
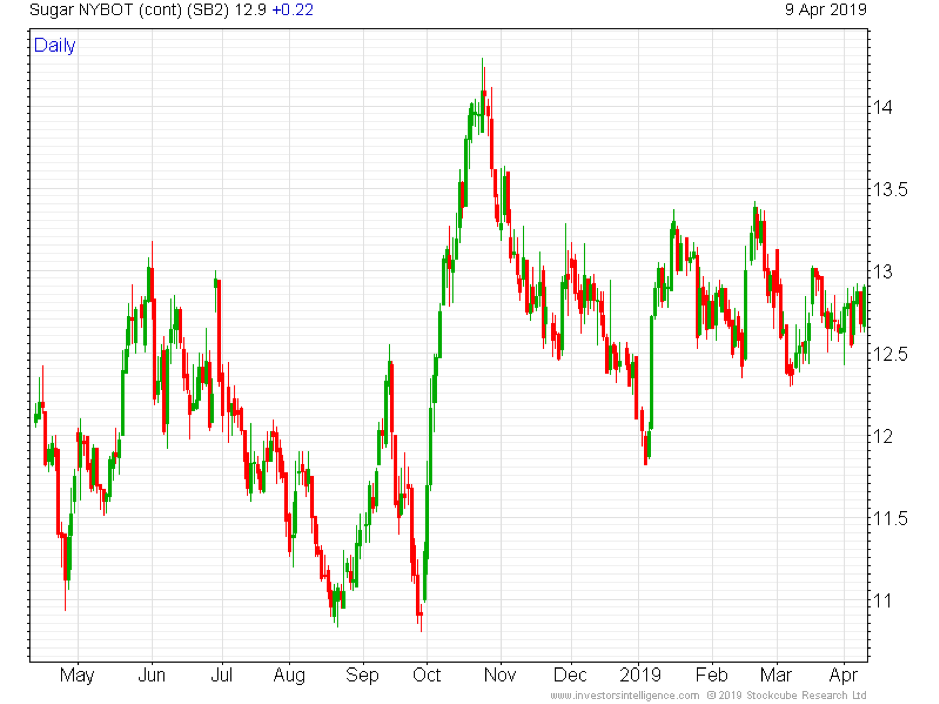
That type of price action reminds us that the price formation process is, at heart, a balancing act between the key forces of supply and demand. As such, commodity markets are always trying to discount or price in future events and crop sizes.
Activity in the sugar market is also concentrated around the contract months of May and July in the current year, and there is a good deal of spread trading between delivery months as well, I note.
As with coffee, other back month contracts are relatively inactive with anything priced for more than a year ahead trading only infrequently at best.
Trading cocoa
The third of our consumable commodities is cocoa: the basic ingredient, along with sugar, in some of our favourite treats and sweets.
However, the cocoa plant and its beans are also used in a wide variety of other industrial processes including the production of alcoholic and soft drinks as well as cosmetics and soap.
There are three major production areas of cocoa across the globe. The largest is centred around West Africa, including Cameroon, the Ivory Coast, and Ghana. Cocoa is also grown in South America, in both Ecuador and Brazil, and across the Indonesian archipelago and Papua New Guinea.
African producers account for approximately 75% of the annual crop, according to the International Cocoa Organisation.
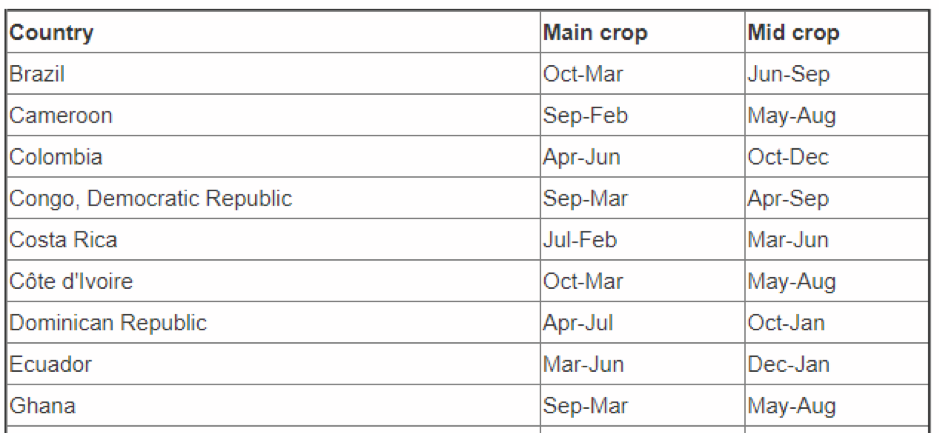
Unlike other soft commodities, cocoa does not have a fixed harvest time. Instead, there are two crops: the mid and the main, each being harvested over several months at different times of the year. The timing of some of these harvests is set out below.
Trading ranges
Cocoa prices rose in September and October of 2018 and then November quickly gave back a large proportion of those gains. It then rallied in December before selling off again from January to early March only to bounce once more.
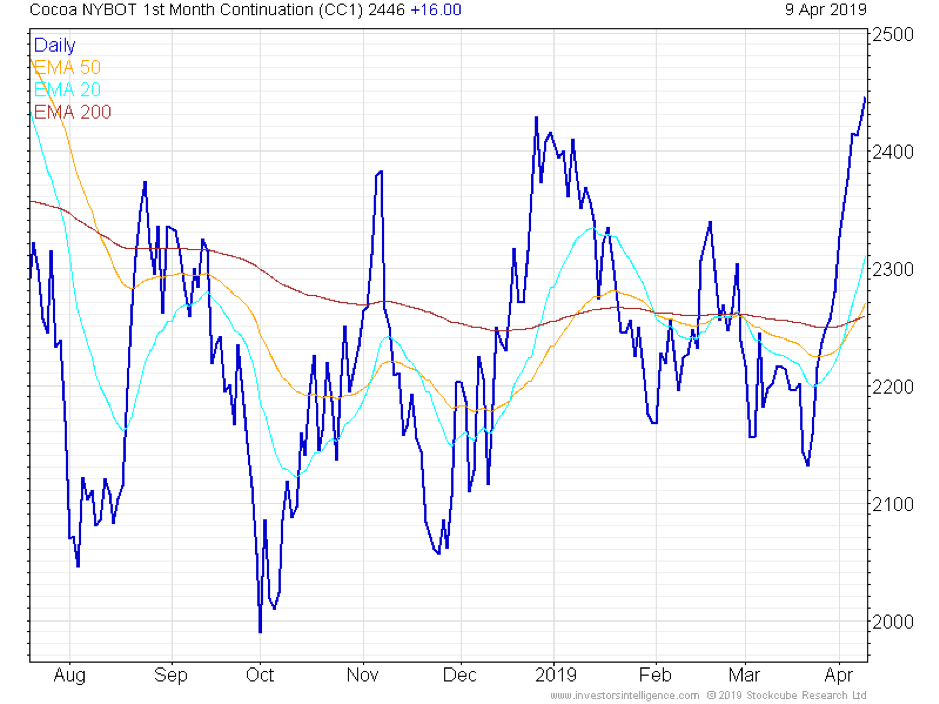
This type of price action is precisely the kind of thing that swing and positional traders are looking for and love to see.
Given the irregular harvesting of cocoa, there is less concentration among contract months which trade for March, May, July, September and December deliveries. Of course, if you trade cocoa with Pepperstone, you will be dealing in a cash-settled CFD that reflects the active or front month price.
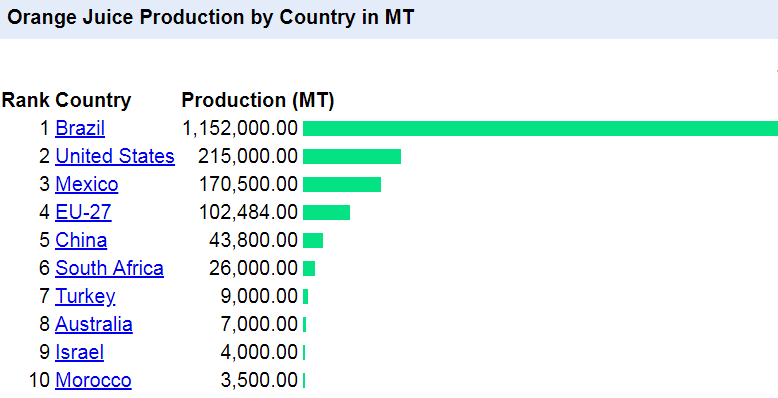
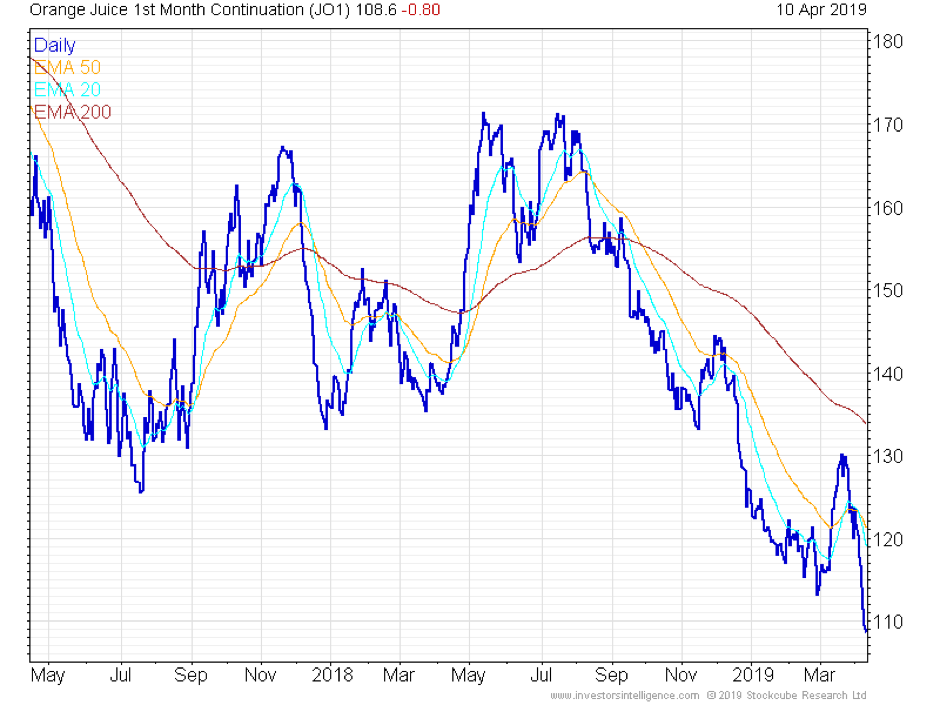
Trading orange juice
A western breakfast staple, Orange Juice production is centred around Brazil, the United States, the EU and China. The commodity is the state of Florida’s official beverage. But once again it is Brazil that provides the vast majority of this commodity, as we can see in the graphic below that maps 2017 production.
Orange Juice is known as the most climate-sensitive of the soft commodities. The origin of the orange has recently been traced to the Himalayas approximately 6-8 million years ago.
Ironically, it's now thought that ancestors of modern oranges were propagated across the globe by climate change that took place all that time ago.
As with the coffee crop in Brazil, the orange crop in Florida is sensitive to the effects of frost, particularly if temperatures stay at or below zero degrees for four hours or more.
Even though Florida is in the southern United States and extends into the warm waters of the Gulf of Mexico and the Caribbean sea, the state can be subject to wintry conditions, as recent polar vortexes over the northern United States have shown. Moreover, Florida is situated in the heart of hurricane territory.
The US hurricane season runs from June through to November. We need to look no further than October 2017 for an example of the effect that a major storm making landfall in Florida can have.
Hurricane Irma in 2017 wreaked havoc on the crop, cutting production by 21%. The total orange harvest was predicted to register a 71 year low, according to Bloomberg data.
The US had not been struck by any major Hurricanes for a decade before 2017. However, that year saw three of the most devastating storms ever recorded to make landfall in the USA.
The 2018 hurricane season produced eight major storms. That October, Hurricane Michael struck the Florida panhandle with winds of up to 155 miles per hour, making it one of the top four hurricanes to have ever struck the United States. Remarkably, orange crops were largely undamaged.
Pestilence is another threat to citrus farmers. Florida’s growers are currently battling against so-called greening, a bacterial infection that can fatally damage orange trees This is spread by the invasive Asian Citrus Psyllid, a sap-sucking insect, against which there is no readily available defence.
So the next time you have a glass of orange juice or hear about storms in the Gulf of Mexico, think about all the above and what it may mean for OJ prices.
OJ futures have delivery months throughout the year as different varieties of oranges are harvested at different times. However, the busiest contract months are May and July, followed by September. As with other commodities discussed here, the other back months are traded infrequently.
Trading cotton
Another crop often associated with the Southern United States is cotton, which is thought to have been harvested and perhaps primitively farmed by humans as far back as 6000 BC.
Today cotton is grown in many countries including China, India, Central Asia, the USA, and Brazil (it would seem you can grow almost anything in Brazil).
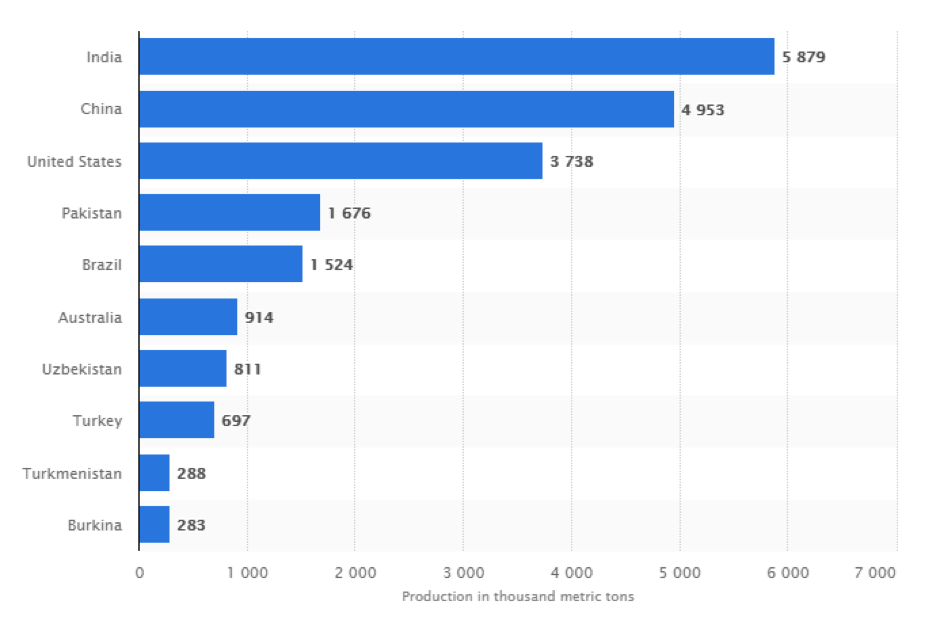
In recent times, India has eclipsed China to become the world's biggest cotton producer. While the majority of cotton production finds its way into textile and clothing manufacturing, it is also used in the production of paper, animal feeds, specialist oils and in the manufacture of pharmaceuticals, rubber and plastics. It has even been used to make bank notes.
Cotton production by country
Cotton has had to weather its own peaks and troughs over time, especially as synthetic fibres rose to prominence in the post-war period. The balance between supply and demand for cotton is closer to equilibrium than in many other commodities.
It might sound as though there would be little reason for cotton prices to change under those circumstances. Actually, the balance between the two drivers is quite a fine one, so cotton prices are highly sensitive to changes in and forecasts of crop sizes.
For example, cotton prices have risen recently on the back of fears about reduced production in India. Those fears are down to the effects that a cotton parasite, the pink bollworm, may have had on production figures. Prices peaked in May 2018 around US$95 and sold off from there across the balance of the year before bouncing again in early 2019.
This illustrates an intrinsic relationship that applies to all cultivated commodities: price will usually move in the opposite or inverse direction to the size of the crop or harvest.
Cotton futures activity is focused on the December and March contracts.
Spotting the trends
As we have seen in the charts above, soft commodities tend to trend, so it makes sense to use trading tools to help you identify, quantify, and act on these price trends.
Among Pepperstone's Smart Trader Tools are a couple of items that can help do just this.
The Smart Trader Tools are a suite of specialist software for MT4/5 specifically designed to enhance and improve your trading experience.
The two tools you might wish to consider using are the:
High Low indicator. This highlights and notifies traders of the appearance of new period highs and lows in a particular instrument. The indicator draws lines on your MT4/5 charts at key price points. You can use multiple versions of the indicator at the same time which means that you can track highs and lows over different time frames, for example, 15 minute, hourly and four hourly.
You can customise the indicator over the time frames that matter to you, and you can be alerted visually or audibly on your trading platform as and when these new highs and lows occur.
Remember that in trading, an uptrend is defined as a series of new higher highs and new higher lows while a downtrend is a series of new lower lows and new lower highs.
Smart Lines. The Mini Terminal in our Smart TraderTools is a potent tool. It’s highly functional with many use cases. One of its many features are Smart Lines.
These are lines that you draw on your chart and which can act as your entry and exit points in the market, be that through a take profit order, a stop loss, or an order to open a new position.
These type of functions allow you to enter into and follow a trend as efficiently as possible by setting targets and take profit levels for all or part of your position and stop losses that help to protect your capital and manage your risk.
You can find out more about the Mini Terminal here.
Note that for Smart Lines to operate your trading terminal will need to be open, logged in, and connected to the internet.
Speak to your Pepperstone account manager to discover how you can get access to the Smart Trader Tools.