- English
- Italiano
- Español
- Français
Analysis
The risk manager – putting the US Treasury’s QRA on the radar

One event which has shown form through 2023 as a market mover is the US Treasury’s QRA (Quarterly Refunding Announcement).
For background the ‘QRA’ – or Quarterly Refinancing Announcement – is where the US Treasury Department announce and quantify its financing needs for the quarter ahead, as well as the composition and breakdown of T-bill and bond issuance.
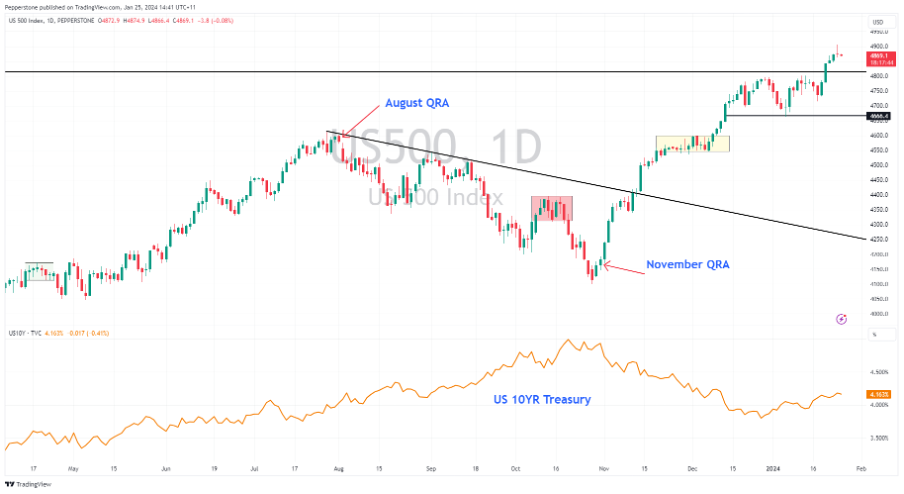
In effect, the QRA could be a complete non-event for markets, or conversely result in a repeat of the powerful moves that we saw in both episodes in August and November - where the US Treasury’s (UST) QRA marked major turning points and trending conditions across bond, equity, and FX markets.
In the art of risk management, the QRA is an event worth monitoring.
Dates for the risk diary
On 29 January the UST announce its financing estimates for the period ahead. 2 days later (31 Jan) we get the breakdown of issuance and USD amount per maturity that they plan to target – this is key.
Coincidentally, just to spice things up, the breakdown of the USTs bond issuance falls on the same day as the FOMC meeting.
The August 2023 QRA case study
In August 2023 the US Treasury detailed they would finance its ballooning fiscal deficit by issuing a greater amount of longer-term US Treasuries than what was expected. With the Fed no longer a buyer of US Treasuries and Japan and China reducing its UST holdings, the highly price-sensitive private sector was asked to take down the increased bond supply.

The result was a sharp sell-off in the US 10yr Treasury, with yields rising from 4% to 5%. As US bond yields soared the S&P500 fell from 4600 to 4100, while the USD index (DXY) rallied by over 5%.
The November 2023 QRA case study
Turn to the following QRA in November 2023 and the US Treasury was keen to curb the sell-off in Treasuries, and a rising interest expense bill - subsequently announcing they would finance its fiscal shortfall away from longer-term bonds and towards US T-bills (debt instruments with maturities of less than 12 months).
While we can also attribute some of the move in markets to the Fed ‘pivot’ and rising expectations of a rate-cutting cycle, amid a soft landing – the move towards ultra short-term T-bill issuance saw the US 10yr yield trend to 3.78%, largely driven by term premium falling from +40bp to -45bp. Subsequently, the DXY fell 6% and the S&P500 rallied 16%.
Watch RRP balances
The RRP facility is an important monetary policy tool for the Fed, as it sets a floor on short-term interest rates (repo, money markets). With money market funds holding a preference to buy US T-bills at govt auctions, over investing in the RRP facility, we’ve seen a consistent drawdown in the level of the RRP facility to $639.56b (search this on TradingView under code – RRPONTSYD).

There are growing concerns that should RRP balances fall below $200b it may start to cause real stress in market funding rates, which as we saw in 2019 would have significantly negative implications for broad market sentiment.
Many consider SOFR (Secured Overnight Finance rate) to be the most important market rate of all, as it represents the cost of short-term financing. If SOFR rates move higher than the level the Fed pays banks to park their excess reserves on their balance sheet (currently 5.4%) – a tool used to put a ceiling on short-term rates - it would show the Fed’s monetary policy levers are no longer functioning efficiently, and that the funding channels are broken.

Traders can monitor this on TradingView by using the code FRED:SOFR-FRED:IORB – should this push above 0bp and certainly above 10bp it will get great attention.
Break it down
So, the concern is if the UST keep its current funding needs to be skewed towards T-bills, then RRP balances will likely fall to worrying levels, funding costs could blow out and equities will take a bath with the USD rallying on safe-haven flows.
Conversely, if the US Treasury move to skew its borrowing needs towards long-term Treasury issuance, then term premium would rise and US 10yr Treasury yields would move higher, again taking the USD higher and equity lower – a re-run of the bearish moves we saw between August and October.
This is a very simplistic breakdown of what is a highly technical concept, but the mix of debt funding could cause some short-term gyrations and it potential result in an earlier end to QT.
Given the US deficit is a growing market and political issue, how it’s funded matters for markets - One for the radar.
The material provided here has not been prepared in accordance with legal requirements designed to promote the independence of investment research and as such is considered to be a marketing communication. Whilst it is not subject to any prohibition on dealing ahead of the dissemination of investment research we will not seek to take any advantage before providing it to our clients.
Pepperstone doesn’t represent that the material provided here is accurate, current or complete, and therefore shouldn’t be relied upon as such. The information, whether from a third party or not, isn’t to be considered as a recommendation; or an offer to buy or sell; or the solicitation of an offer to buy or sell any security, financial product or instrument; or to participate in any particular trading strategy. It does not take into account readers’ financial situation or investment objectives. We advise any readers of this content to seek their own advice. Without the approval of Pepperstone, reproduction or redistribution of this information isn’t permitted.