CFDs are complex instruments and come with a high risk of losing money rapidly due to leverage. 72.2% of retail investor accounts lose money when trading CFDs with this provider. You should consider whether you understand how CFDs work and whether you can afford to take the high risk of losing your money.
- English
- Italiano
- Español
- Français
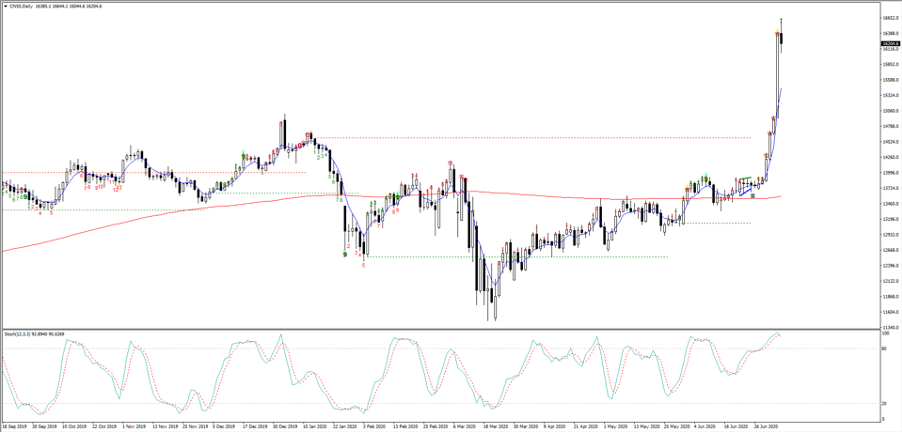
With the China A50 index (CN50 on MT4/5) putting on a lazy 7.5%, while the Hang Seng, the index where we saw the bulk of client flow, rallied 3.8%. Things have settled down a touch today, but China is a truly a hot market. For perspective, the A50 index has gained 24% in 16 trading sessions.
Pepperstone clients can trade the A50 index (CN50) and Hang Seng (HK50), as well as USDCNH (yuan traded in HK). The A50 index being the top 50 Chinese mainland companies traded as a futures index on the Singapore exchange – it has a 96% correlation with the CSI 300.
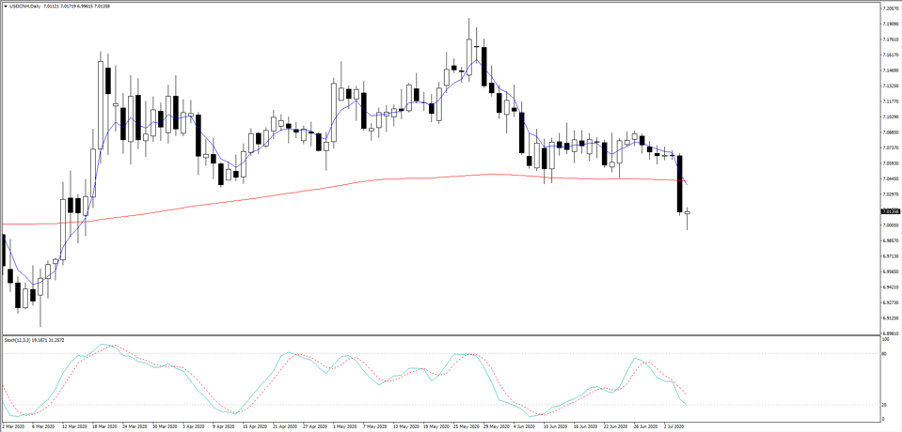
Volume has been incredible too, with 40.58b shares traded through the CSI 300 on Monday – the most since 15 July 2015, with turnover some 212% above the 30-day average. Offshore funds were big buyers of Chinese equities, with orders through the HK to Shanghai (Northbound) ‘connect’ coming in at record levels ($45.12b). They were also big buyers of CNH too, as we can see in the daily chart of USDCNH, with price smashing through the 200-day MA. If USDCNH is trading lower, then it will subsequently put a bid in EURUSD, AUDUSD and NZDUSD too.

Watch this space, but if Chinese equities are going higher and offshore funds want to get exposure via HK, then USDCNH should trade lower.
Listed brokers are flying, as you’d imagine when we see such intense volume through the exchanges, and if we look at broker names traded in HK, we can see some outrageous one-day moves. Some chunky earnings upgrades from CICC are also helping, with the investment bank now seeing 25% y/y growth, although the absolute flow and appetite for equity is obviously the main rationale for buying brokers.
Monday’s one-day move in Chinese HK-listed brokers

Should the bulls be worried about excessive leverage just yet?
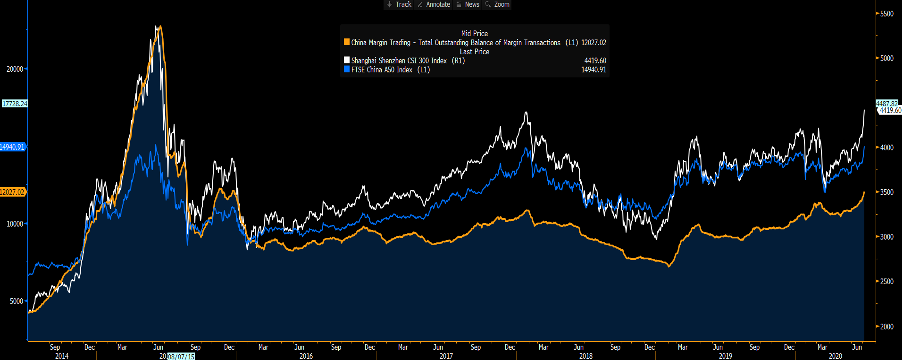
We can look at the level of margin debt used for equity transactions as a vehicle for leveraging up and speculating on financial markets, and here we see this figure hitting RMB12t on Friday – one suspects this would be higher now, although, it is still only half of below the outstanding balance in June 2015, when, of course, we saw rampant equity speculation. A relaxation of the rules governing margin trading in June from the CSRC (China Securities Regulatory Commission) is clearly in play and helping sentiment.
One consideration is that given the increase in the market capitalisation of China’s equity markets is that margin transactions as a percentage of market cap is still only around 14%, where this reached 27% in 2015. We also see margin financing as a percentage of free float sitting at 4% vs 10% in 2015. Neither are at outrageous levels and this is a strong consideration for the regulator, who on one hand see advantages in higher asset prices but has a strong consideration for financial stability. It doesn’t feel like authorities will reign in speculation just yet.
- Yellow - Total outstanding balance of margin transactions
- Blue – A50 index
- White – China CSI 30

Do we fade the rally?
If we look at any technical oscillator, such as an RSI or stochastic it will suggest the upside is limited and that the market is incredibly overbought. The move in the RSI is obviously a function of just how powerful and impulsive the move has been of late, but are we at a point where we think the market is simply going to roll over and decline 15%? My view is that any weakness in the next few days will likely be supported, and while there are risks a touch of the heat comes out of the move, traders will be taking the timeframe in and watching price to assess where buyers step back in.
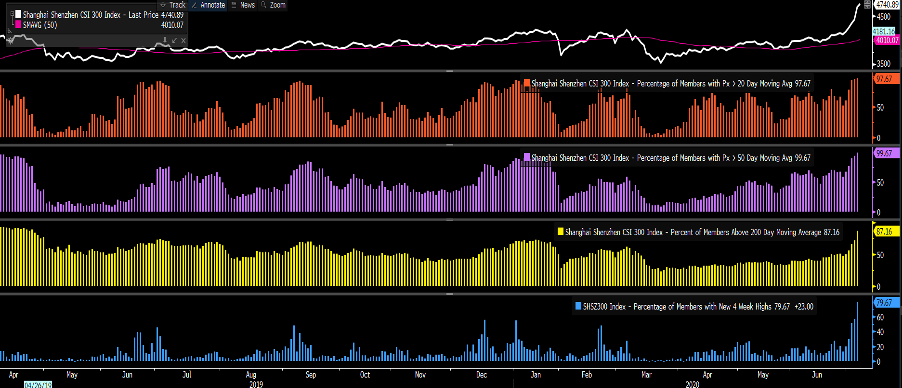
Technicals aside, if I look at certain market internals, they are screaming euphoria – which in any other market would suggest looking very intently at one’s stop placement or even reducing bullish positioning. But China is a different vehicle altogether and when FOMO marries with the shared belief that authorities want higher asset prices we can see markets making new highs despite grossly overbought levels.
- In order – top – China CSI 300
- Number of companies > 20-day MA
- Number of companies > 50-day MA
- Number of companies > 200- day MA
- Number of companies at 4-week high

Catalysts
Let not forget that retail participation in the Chinese markets is arguably far higher than anywhere else in the world, and somewhere north of 70% of the daily flow – so when local traders hear a message they act.

By way of catalysts, many have credited an article in China Securities Journal (from Xinhua) that detailed “support to a strong start for a bull market in A-shares will mark the beginning of new opportunities”. This is certainly positive when married with the recent relaxation of margin trading regulations. We also see monetary policy more broadly having been eased in recent times and the fact that China’s economic data has turned more positive is also a tailwind to risk appreciate – here, we see the Citigroup economic surprise index showing China’s economic data has beaten expectations fairly consistently.
China’s key policy tools
China is hot right now and is a market worth putting on the radar. With all talk of a tidal wave of retail participation in global equities, it seems China has firmly joined the party.
Ready to trade?
It's quick and easy to get started. Apply in minutes with our simple application process.
The material provided here has not been prepared in accordance with legal requirements designed to promote the independence of investment research and as such is considered to be a marketing communication. Whilst it is not subject to any prohibition on dealing ahead of the dissemination of investment research we will not seek to take any advantage before providing it to our clients.
Pepperstone doesn’t represent that the material provided here is accurate, current or complete, and therefore shouldn’t be relied upon as such. The information, whether from a third party or not, isn’t to be considered as a recommendation; or an offer to buy or sell; or the solicitation of an offer to buy or sell any security, financial product or instrument; or to participate in any particular trading strategy. It does not take into account readers’ financial situation or investment objectives. We advise any readers of this content to seek their own advice. Without the approval of Pepperstone, reproduction or redistribution of this information isn’t permitted.
