- English
- Italiano
- Español
- Français


Price Action and Valuation
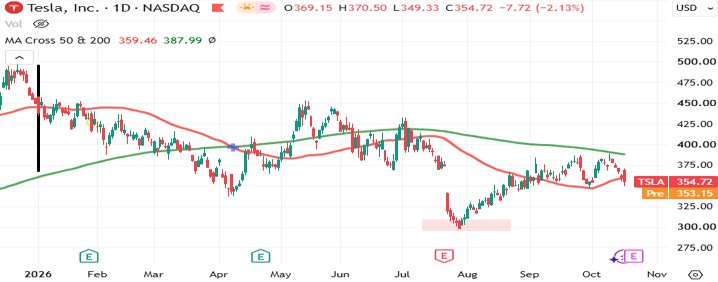
- The stock closed last Friday at $354.72 (−2.1%), capping a down week and leaving it roughly 20% lower year to date versus its December close of around $450 per share.
- The 52-week range runs from a July low of $297 to a high set early in the year. The stock sits 22.5% below that high and 18% above the low. Technically, support is near $354, resistance near $384, and the 200-day moving average near $390.
- Last week’s pressure came from a bank note on a possible merger with SpaceX, alongside the Nasdaq’s 1.88% drop on October 14, another bank’s concern over cash burn, and reports of executive departures and regulatory scrutiny of the Cybercab.
- Valuation: market cap is about $1.4 trillion ($1.45 trillion on October 15). The trailing 12-month P/E is about 327x versus a 5-year median of 107x. On expected 2027 EPS ($1.18), the multiple is about 300x, and about 13x expected 2026 sales ($106.9 billion). The price therefore rests not on current earnings but on the option value of autonomy and robotics.
Quality Read
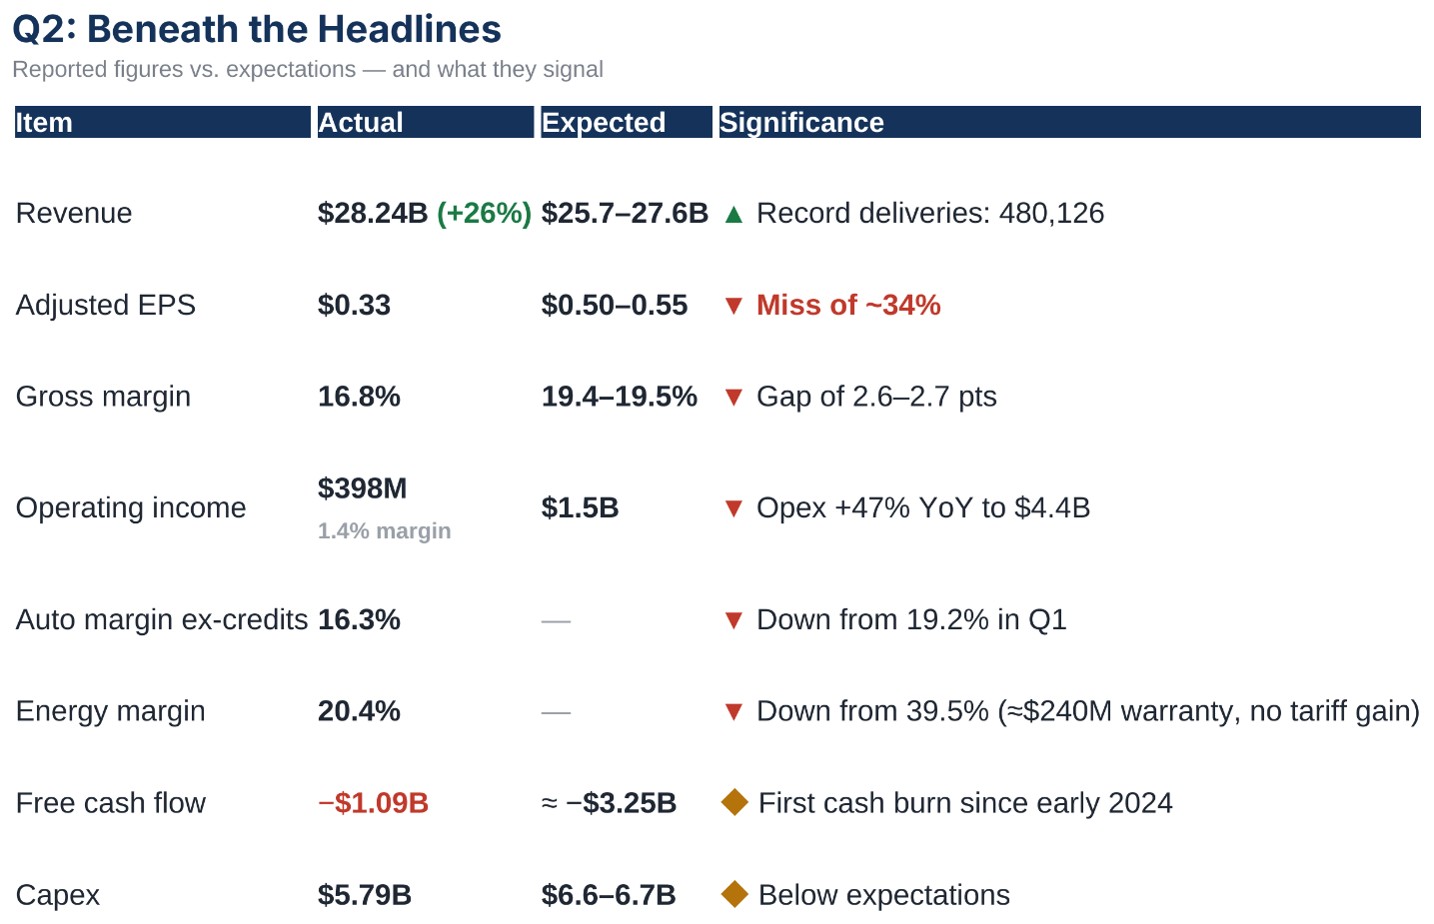
- Volume. Revenue grew on deliveries, while average selling price and regulatory credits fell and AI spending and stock-based compensation rose. Credits were $146 million versus $439 million a year earlier. After excluding about $230 million of one-off items, auto margin was roughly flat sequentially. The weakness is therefore structural.
- Quality of reported earnings. GAAP EPS ($0.32) included an unrealized gain of about $1.0 billion on Tesla’s investment in SpaceX and a California tax reserve release, against operating income of only $398 million. Since Tesla received its SpaceX shares through the xAI deal, reported earnings will move with the SPCX share price.
- Energy. Excluding warranty, margin remains around 28% (rough estimate), above management’s long-term target (mid-to-low 20s). A mechanical recovery is possible, but its ceiling is limited.
- Cash. The Q2 cash beat came from operating cash flow of $4.70 billion versus $3.45 billion expected, and from capex about $0.9 billion lower. Part of the spending has therefore been deferred to H2.
Reaction and Pattern
- The stock closed at $374.10 before the results, then fell about 4% after the close and 12.7% the next day, wiping out about $140 billion. The intraday drop peaked at 15.6% against a priced-in move of ±5.9%. The stock then lost 26% over four weeks before touching the $297 low.
- The pattern repeats. In April the stock rose about 4% after hours on an earnings beat, then closed 3.56% lower when the capex guide was raised to more than $25 billion from $20 billion and free cash flow was said to remain negative. The takeaway is that the market punishes spending and cash burn more than it rewards an EPS beat. The after-hours reaction may also reverse during the live call, so the first hour should not be relied on.
Threshold Math (estimates)
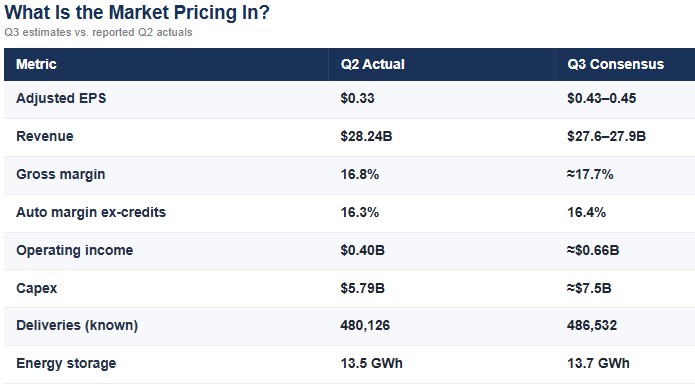
- Margin. Not repeating the energy warranty charge ($240 million) adds about 0.9 points to gross margin, lifting it from 16.8% to about 17.7%, roughly in line with consensus. Consensus therefore effectively assumes flat auto margin and nothing more. Any new warranty provision or decline in credits turns directly into a miss.
- EPS. The gap between $0.33 and $0.43–0.45 equals about $350–420 million pre-tax (on roughly 3.5 billion shares), and the non-repeat of the warranty charge covers 57–69% of it. Every extra $100 million of expense equals about 3 cents.
- Revenue. If revenue per vehicle, energy and services hold at Q2 levels, a simplified model yields about $28.6 billion, roughly $0.7 billion above consensus. Consensus therefore assumes revenue per vehicle falls about 3%. By contrast, the energy revenue estimate ($3.76 billion) looks 20% above the prior quarter ($3.14 billion) despite deployment growth of only 1.5%.
- Cash. With $8.28 billion spent in H1, the target of more than $25 billion requires about $16.7 billion in H2. If Q3 comes in at $7.5 billion, Q4 must be at least $9.2 billion. With operating cash flow similar to Q2 ($4.7 billion), that implies free cash flow of about −$2.8 billion (range −$2.0 to −$3.7 billion). Liquidity of $43.5 billion is sufficient, but the quarterly disclosure leaves the door open to additional debt financing.
Assumptions Embedded in the ≈$355 Price
- Auto margin holds at 16–17% with no further erosion, and capex is funded without issuing equity.
- Value of autonomy. The model values the stock at $450, of which about $135 is for the robotaxi. The core value is therefore about $315, and at $354.7 the market is paying about $40 per share (≈11%) versus 30% in its model.
- Operating indicators. More than 300 Cybercabs in Austin (8x in 30 days), and more than 1 million cumulative driverless miles versus about 380,000 at the Q2 earnings call. Cybercab production has started, more than 55% of North American deliveries include an FSD subscription, and new European approvals have come through. As for Optimus, the Gen 3 design is complete, with possible external sales in H2 2027. Musk described the start as very slow.
- Regional demand is mixed. Domestic China sales were −9% in September versus exports of +58%. German EV registrations jumped 94.7% in September, but Spain was −79% and Portugal −37% in August. Part of the delivery beat came from drawing down about 22,000 vehicles from inventory.
- Merger option. The note sees an announcement as possible before the December 6 shareholder meeting, with the most likely structure being a SpaceX acquisition of Tesla in stock. An illustrative scenario gives Tesla shareholders about 41.7% of the combined entity. The obstacles are the vote (11% of broker shares did not submit proxies last year), governance, and approvals including China. The prediction market gives more than 50% by early 2027.
Options: The Priced Move and How to Read It
- Options price a 7.43% move (≈ ±$26.4), i.e. a range of about $328–381. On October 15 the straddle was about $27.02 at the 362.5 strike (7.5%) for the October 23 expiry.
- Comparisons. The average of the last four reports is 5.95%. The 10-quarter average is about 9.4% (median 8.9%, 80% of moves ≤12%, 95% ≤16.3%), and the actual move exceeded the priced move in 11 of 16 reports. However, these statistics measure the intraday peak, so they overstate relative to the close.
- Regime break. Before July, options priced ≈6.3% versus a recent realized average of ≈4.3%, a premium for the volatility seller. Then came −12.7%. The market has raised the priced move to ≈7.5%, but it is still below the 10-quarter average.
- Positioning. Volume of 2.97 million contracts, a volume Put/Call ratio of 0.59 (below the usual 0.68), and a skew tilting further toward downside protection. The open-interest Put/Call ratio is 0.8. Calls are concentrated around 350 and 370, which may create a pinning effect ahead of weekly expiry (inference).
- Range location. The lower bound (≈328) roughly matches the post-earnings close in July (≈327), and the upper bound (≈381) touches the 384 resistance. The July low is 16% away from the current price.
What Should Be Watched in the Release
- Auto margin excluding credits (16.3%) and regulatory credits ($146 million).
- Energy: new warranty charge, and whether margin reaches 25% or higher.
- Operating expenses ($4.4 billion, +47% YoY).
- Distribution of capex into Q4, the financing language (debt or equity), and free cash flow.
- Autonomy: Cybercab count, new cities, driverless miles, European FSD approvals and the subscription rate, and the NHTSA file.
- Optimus: the Gen 3 unveiling date and the start of production at Fremont (first batches expected in Q3 per the Q2 call).
- SpaceX and Terafab: how Musk answers the merger question.
- Q4 guidance: deliveries, tariffs, and mix after the end of Model S and X production.
Timeline: Tuesday, October 20, SpaceX results after the close; Wednesday, October 21, Tesla; Friday, October 23, weekly options expiry; and through December 6, the shareholder meeting window.
The material provided here has not been prepared in accordance with legal requirements designed to promote the independence of investment research and as such is considered to be a marketing communication. Whilst it is not subject to any prohibition on dealing ahead of the dissemination of investment research we will not seek to take any advantage before providing it to our clients.
Pepperstone doesn’t represent that the material provided here is accurate, current or complete, and therefore shouldn’t be relied upon as such. The information, whether from a third party or not, isn’t to be considered as a recommendation; or an offer to buy or sell; or the solicitation of an offer to buy or sell any security, financial product or instrument; or to participate in any particular trading strategy. It does not take into account readers’ financial situation or investment objectives. We advise any readers of this content to seek their own advice. Without the approval of Pepperstone, reproduction or redistribution of this information isn’t permitted.