- English
- 中文版
The Daily Fix: What happens if we actually see the 15% tariffs kick in?

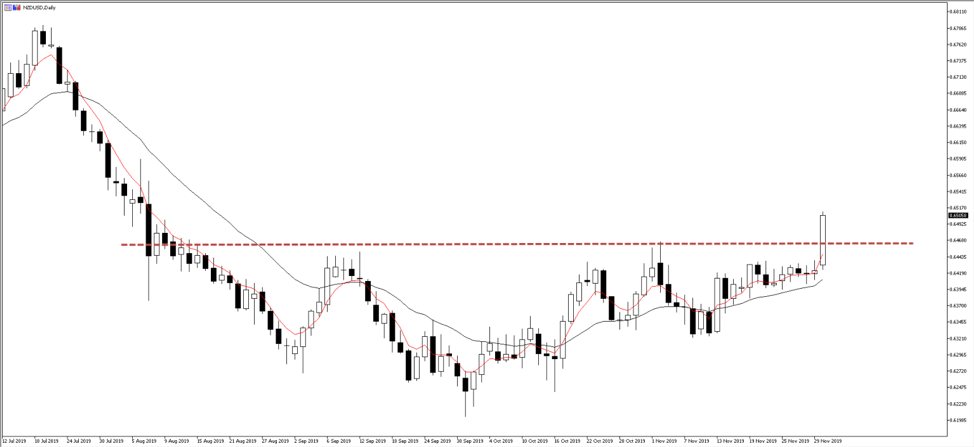
It’s a good day to be long the NZD and the bird has found its mojo, flying high against all major currencies, notably vs the CAD (NZDCAD +1.4%). NZDUSD was well traded as price smashed through the 0.6450 ceiling, pushing to the highest levels since 7 August. The combination of a solid rise in NZ Q3 terms of trade and a very market-friendly fiscal plan, set to be announced next week, is music to FX traders’ ears. AUDNZD has also been well traded, breaking below Friday’s low of 1.0535 and negating the falling wedge pattern (seen on the daily). One suspects the 21% probability of a further rate cut priced for the February meeting will be part reduced when the rates market re-opens shortly.
Fiscal stimulus expectations growing in Germany
The idea of fiscal stimulus in Germany has been steadily rising for weeks, but with the new leadership within the SPD party has increased the risk of new elections, in turn, elevating the view of fiscal measures further. The SPD party are pro-fiscal stimulus, so any view that we can take Merkel out of the equation is seen as a EUR positive, although, the market is not anywhere near as enthused by what they’ve heard in NZ, which is fact. There is still much water to flow under the bridge before Germany go hard on breaking away from its fiscal discipline and it’s difficult to get overly excited just yet.
Long EURCHF has been a trade we’ve been warming to in the team, and after a powerful breach of the 1.0004 ceiling, a fate we felt could see the pair the multi-month trading range of 1.1060, we’ve seen sellers kick in and a potential key day reversal brewing on the daily.
Long EURUSD and EURCAD have been the trades if you wanted to express a bullish view on the EUR, with EURUSD contributing to a 0.44% easing of the USD index on the session. EURGBP has found better buyers and its second higher low in a row. Although price has been confined to the 20-day MA and while I see modest upside risks in the ST, I hold limited conviction and still want to see a bit of the heat coming out of the GBP before wading into broad GBP longs again.
US manufacturing was supposed to expand not deteriorate
The USD has found it tough going, and I am surprised the greenback is not down more when we saw such a poor November US ISM manufacturing report. All the market-based leading indicators strategists focus on were indicative of a move back into expansionary territory on the manufacturing index, but the outcome not only missed the consensus of 49.2 but with headline coming in at 48.1, it also fell modestly from the October read. Perhaps the most concerning issue has been the new orders sub-component which came in at 47.2 (vs 49.1 in October) – the lowest since June 2012, while the prices paid component fell to 46.7.
This much-watched data point certainly doesn’t justify the equity rally in any capacity and it’s no surprise that we saw the S&P 500 falling a further 0.7% into 3110 and the lows of the day. The manufacturing data hitting the market at a time when sellers were prevalent anyhow, with headlines around trade causing anxiety levels to rise, with implied volatility rising a touch, as traders sought cheap downside hedges and we currently see the VIX index up 1.9 vols to 14.50%. Traders haven’t been overly unperturbed by the news that new tariffs were to be implemented on Brazil and Argentina, but they have taken notice of comments from US Commerce Secretary Wilbur Ross (on FOX Business) around putting up tariffs on 15 December if nothing happens by then.
What happens if 15% tariffs do actually increase on the 15th?
It promises to be a very interesting day on the markets on Monday 16th, with a consensus view that we will see the 15% tariff increases pushed out and revisited in late January. So, these comments offer some risk that perhaps if the 15% tariffs do kick in on $160b of Chinese exports we could face a wild day on Monday, with the S&P 500 likely to gap down 2% or so, and USDCNH moving up hard, taking AUD and KRW down with it. That said, by lowering expectations, and causing better two-way risk into the event, it raises the prospect of a relief rally even if they is no agreement to formally roll back existing and new tariffs. Where the mere agreement to revisit talks in 2020 and closer to Chinese NY may cause buyers in the S&P 500 and who knows, even new highs.
It’s interesting that the poor US manufacturing data has not resonated in the US bond market, and granted we have seen modest buying in US 2-yr Treasury’s, a function that rates markets have moved to an 8% chance of a cut (from 3% chance of a hike) for the 12 December FOMC meeting. It’s the long-end that fascinates as US 10s and 30s are up 5bp (1.82%) and 7bp (2.27%) respectively, causing a reasonable steepening of the curve. Inflation expectations are firm, while gold is unchanged (likely due to real yields moving modestly higher), oil is +1.5%, while high yield credit modestly underperformed investment-grade.
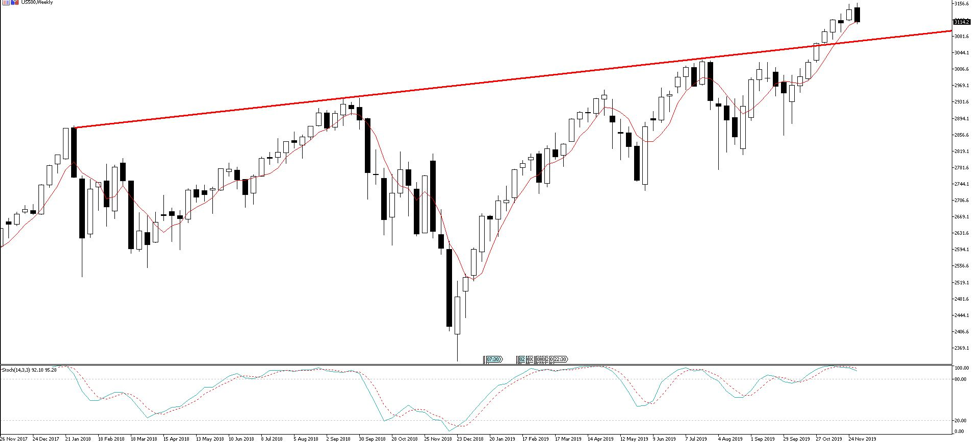
Ok, we’ve seen a weakening tape in the S&P500 (currently -0.9%) and the set-up on the weekly chart is looking dangerously like a key week reversal. However, broad financial conditions haven’t tightened to any great extent and this presumably led equity investors to support weakness, pushing US indices higher from the earlier lows. Until the central bank liquidity dynamics change its hard to be short risk with any conviction.
A tough start for Asia
We do see a tough Asia equity open and although we see the Hang Seng open -0.5% lower at this stage, the ASX 200 and Nikkei 225 should open around 1.6% weaker a piece. The RBA meeting is the highlight, but with much communication from the likes of the Dr Lowe of late, no economists calling for a move and rates market pricing an 8% chance of a cut, it threatens to be a non-event.
The material provided here has not been prepared in accordance with legal requirements designed to promote the independence of investment research and as such is considered to be a marketing communication. Whilst it is not subject to any prohibition on dealing ahead of the dissemination of investment research we will not seek to take any advantage before providing it to our clients.
Pepperstone doesn’t represent that the material provided here is accurate, current or complete, and therefore shouldn’t be relied upon as such. The information, whether from a third party or not, isn’t to be considered as a recommendation; or an offer to buy or sell; or the solicitation of an offer to buy or sell any security, financial product or instrument; or to participate in any particular trading strategy. It does not take into account readers’ financial situation or investment objectives. We advise any readers of this content to seek their own advice. Without the approval of Pepperstone, reproduction or redistribution of this information isn’t permitted.