- English
- 中文版
Trade-driven treasuries - why USDCNH helps explain low yields

It’s risk-off for the bond markets, with US 10-year treasury yields near record-lows. Bonds are very influential: not just in what pricing implies about inflation expectations and growth, but also for businesses eyeing cost of capital to assess a project’s net present value. We wanted to know the extent to which recent moves in the benchmark US 10-year treasury have been driven by trade tensions, so we decided to compare the 10-year yield with our default trade proxy: USDCNH.
The US 10-year treasury note is an indicator of sentiment, driven by the market’s view on long-run inflation expectations, growth, and general risk. You might hear its yield being called the ‘risk-free rate’, although this seems to make less sense when the US deficit is ballooning out by the day. Bond prices drop and the yield lifts when confidence in the economy is high. But when confidence is low, price rises and the yield falls. It’s a check-up on the overall health of the US and, arguably, global economy.
At the time of writing, the 10-yr treasury yield is 1.75%, only 30bp (basis points) from the September lows and 40bp from the all-time low 1.35% on August 2016. For further context, one year ago today the rate was 3.06%, and the all-time high was 15.84% in 1981.
Such a low yield has historically indicated abysmal confidence in the economy, but does that make sense today when US equities are at all time-highs? Many other factors impact yields today, such as liquidity.
So with the ‘risk-free’ rate almost as low as it’s ever been, indicating a dismal investor outlook for growth and inflation, we wanted to know the extent to which US-China trade tensions are influencing the 10-year bond. We ran a year-to-date regression of daily USDCNH data (white bars – our independent variable) against the daily yield of US 10-year treasuries (yellow, inverted), and found a 0.852 correlation coefficient as well as strong statistical significance of a shared trend.
Put simply, 85.2% of the move in US Treasuries can be explained by the move in USDCNH.
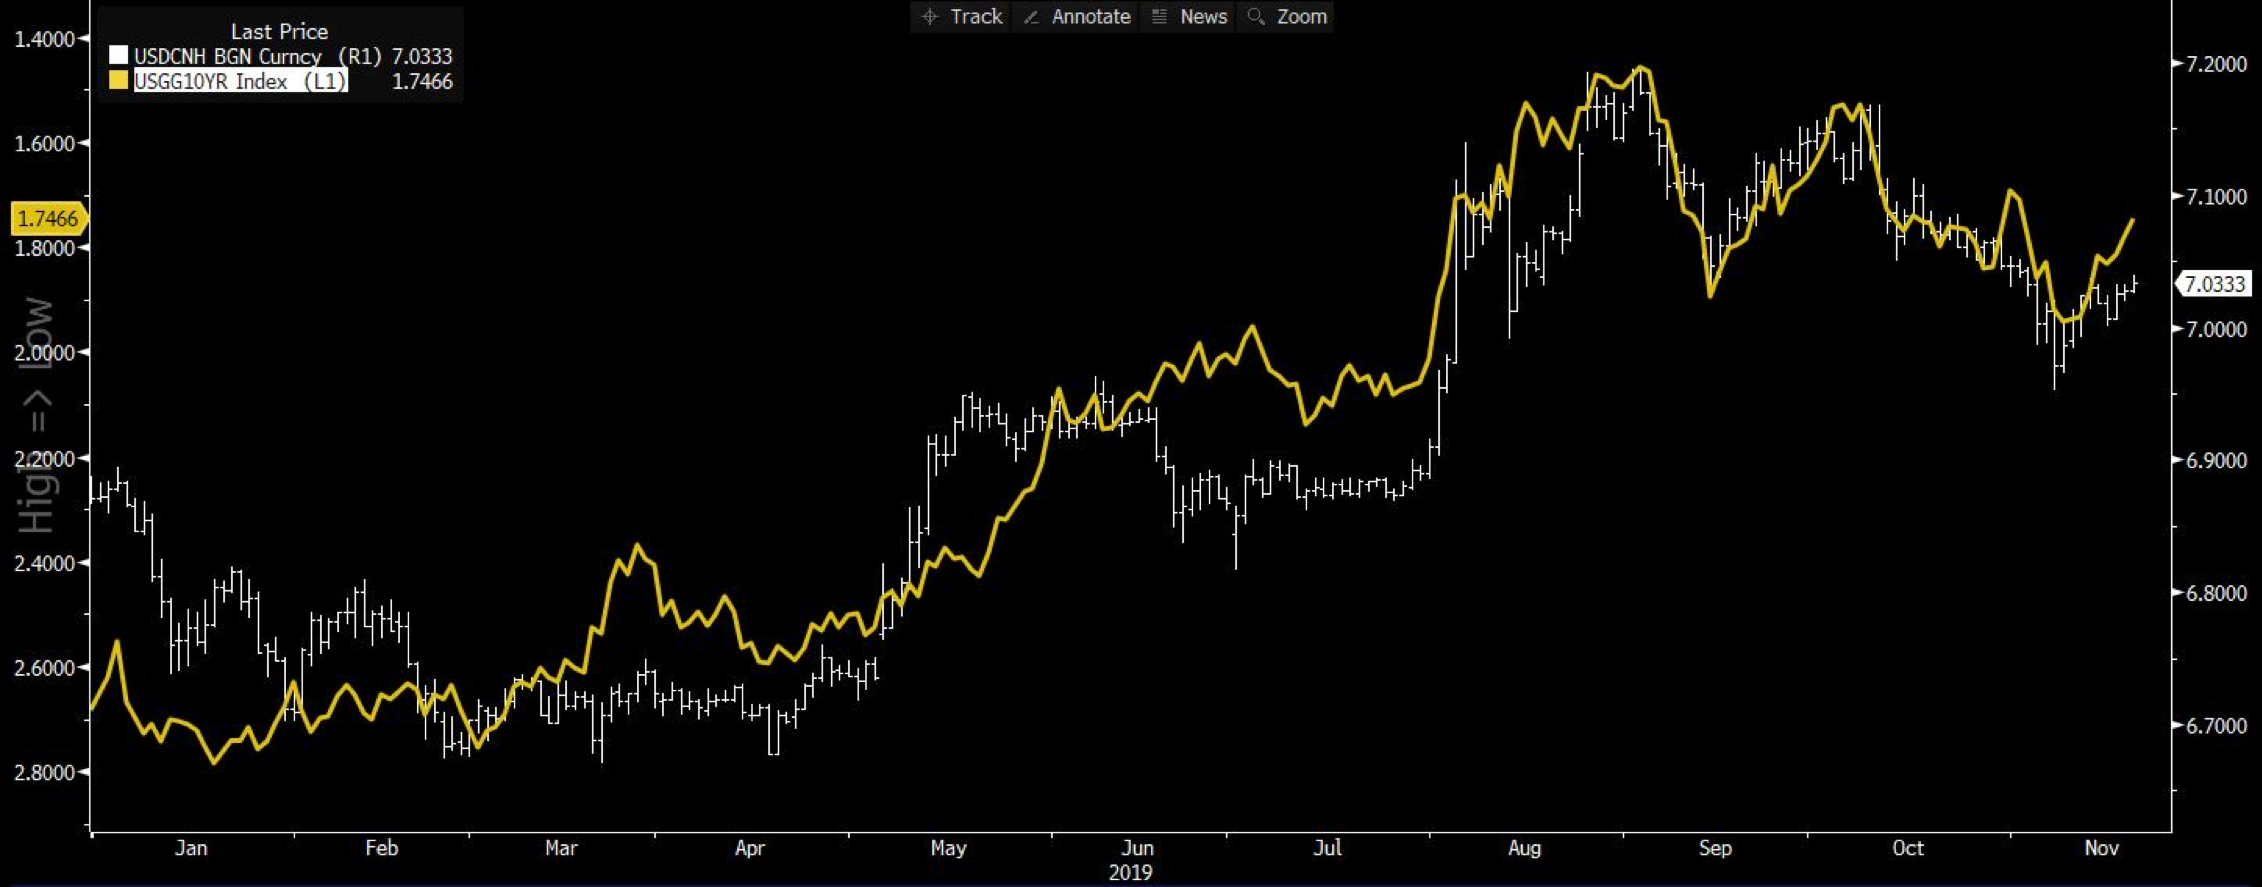
"USDCNH chart"
You’ll see in the chart above that USDCNH and the 10-year treasury rate have tracked a similar trend throughout 2019 - narrowing even closer since September as markets eagerly await developments on a possible phase one trade deal.
The greenback tends to strengthen against the Chinese yuan whenever trade tensions escalate, and weakens when markets get a taste of good news, whether that be a possible truce, deal or just a tariff reduction. At this juncture, it feels like USDCNH is most sensitive to the view on tariffs rollbacks. If they are removed, which looks increasingly unlikely, we would expect CNH to rally against the USD, and using the above statistical logic US Treasury’s should sell off in appreciation (yields higher).

"USDCNH currency chart"
Zooming into the last six months, note the steep increase in the 10-year yield (remember we’ve inverted the trendline) in early September when China offered goodwill agricultural purchases and the market moved to a risk-on mood. USD weakened against CNH on the good news.
Soon after when Trump made it clear he was not interested in a partial deal, it was risk-off again as the 10yr yield fell alongside a restrengthening USD.
Trade is clearly the significant driver of US bond yields, a worthwhile consideration when trading the USD more broadly against currencies like the JPY, AUD, and select emerging market (EM) currencies.
The material provided here has not been prepared in accordance with legal requirements designed to promote the independence of investment research and as such is considered to be a marketing communication. Whilst it is not subject to any prohibition on dealing ahead of the dissemination of investment research we will not seek to take any advantage before providing it to our clients.
Pepperstone doesn’t represent that the material provided here is accurate, current or complete, and therefore shouldn’t be relied upon as such. The information, whether from a third party or not, isn’t to be considered as a recommendation; or an offer to buy or sell; or the solicitation of an offer to buy or sell any security, financial product or instrument; or to participate in any particular trading strategy. It does not take into account readers’ financial situation or investment objectives. We advise any readers of this content to seek their own advice. Without the approval of Pepperstone, reproduction or redistribution of this information isn’t permitted.