- English
- 中文版
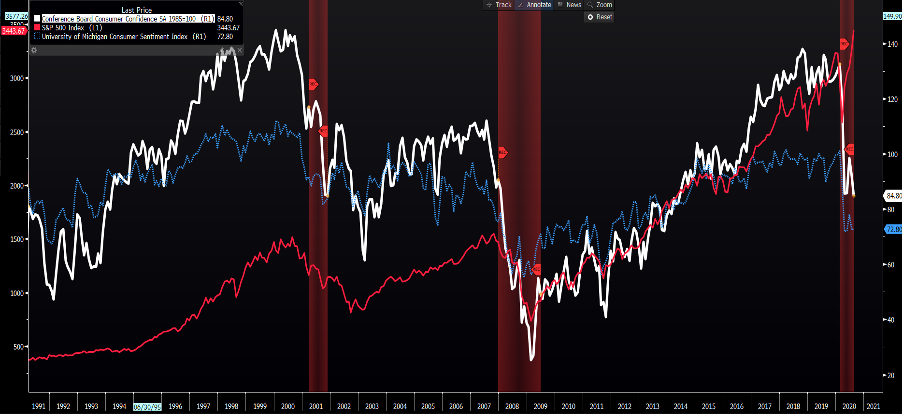
I guess the news flow has been there, with the market hanging on the tailwinds of vaccine and US-China trade deal headlines. On the data side, the German IFO was marginally better, although the expectations sub-survey was a touch light. US consumer confidence was well below expectations at 84.8 and printed a new six year low and even pulled below the levels seen in April. The stock market didn’t reacted like perhaps it once would have and if we look at the correlation between CB consumer confidence (white), the Uni of Michigan consumer confidence survey (blue) and the S&P 500, this is just another chart you can add to the divergence pile.

(Source: Bloomberg)
Also, on the data docket we saw US new home sales smash expectations with a 13.9% increase in July, while the Richmond Fed manufacturing easily beat at 18 vs 10 eyed.
In equity land, the S&P 500 pushed up another 36bp, closing on the highs of the day. With healthcare and comm services leading the way, with tech not far behind. Energy was the laggard, with a 1.42% loss and that despite crude 1.8% higher for both WTI and Brent. Where we see XTIUSD finally through the 200-day MA with Hurricane Laura tearing through the Gulf Coast, with more than 84% of output in the Gulf of Mexico temporally shutdown
The NAS100 has led again with a 0.82% gain and I hold longs for now looking to exit on a daily close through the 5-day EMA - a level which has defined the recent trend since the 12 August. That may change, where I may square and reverse, with the timeframe taken into 30 minutes chart, as I think there are risks that suggest a short opportunity in the coming session - it could be good for 150-200 points – one to watch, and react to should price react.
We’ve seen selling in US Treasuries, with yields at the longer end moving higher on a relative basis, causing a steepening of the curve. As mentioned, data was mixed, but the Treasury department got a massive $50b 2yr Treasury auction away without any issues at all and demand was good. Inflation expectations have kept pace with Treasuries and therefore real yields have not really moved and this is possibly a reason why gold and silver remain lost and continue to consolidate after the monster run from 1670 in June to the recent high of 2076. As we see on the daily and weekly timeframe, there is solid support into 1910/00, with buyers happy to support for now.
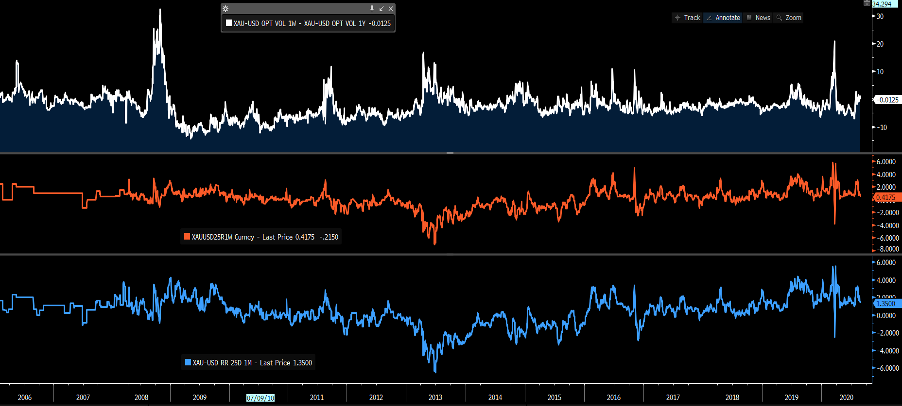
If 1900 goes then we may see a decent flush out of longs, which should offer a buying opportunity for a new run-up past September. If I look at the options market, the skew (‘risk reversals’) between call and put implied volatility is finely balanced and traders see risks to price moves as incredibly symmetrical. Gold is in need of a new catalyst and as the headline writers say “Gold’s time to shine” is not now. Again, a good flush out would perhaps be that catalyst for a longer-term bull run.
- Top pane – Gold 1-week - 1-year implied volatility
- Middle – 1-week risk reversals (call minus put volatility)
- Lower – 1month risks reversal

On the FX side, gold didn’t really follow the USD through Asia, then suddenly caught on through US trade and as the USD moved lower, then gold caught a bid from 1914.

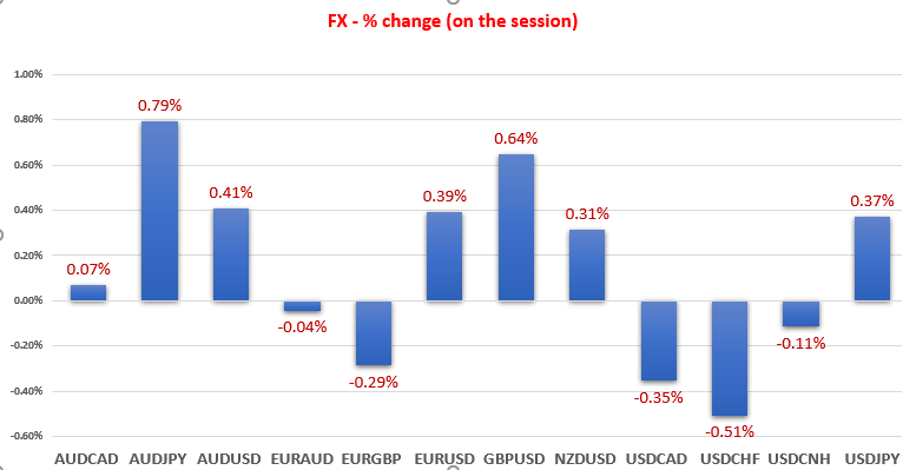
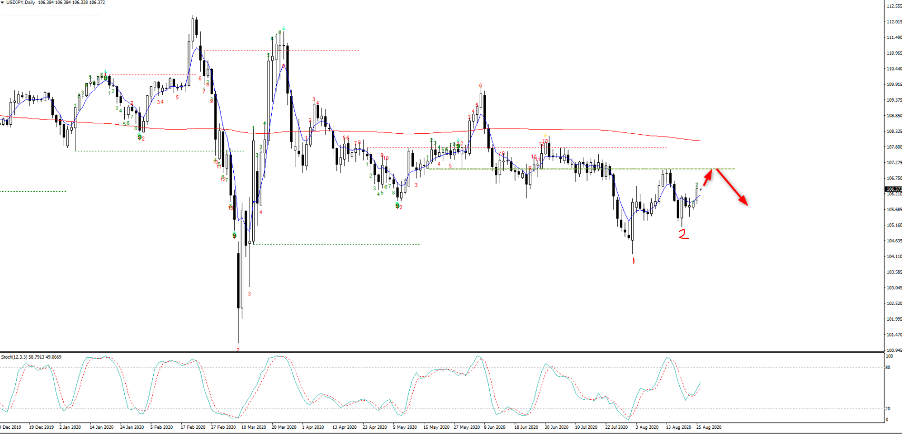
We’re left with the USD down 32bp on the day but scanning across the respective pairs and the USD was lower vs all major currencies except USDJPY, which is 37bp higher but finding sellers into 106.58. After two bullish outside days of late, there is clear support for the pair, but the key resistance sits into 107.00. So that is one for the radar and levels to take the timeframe right in and react accordingly as and when we get there. Cable has been a mover too, despite the recent headlines about poor EUR-UK trade talks. Again, a pair consolidating and one the bulls will jump on if this breaks higher.

Related articles
Ready to trade?
It's quick and easy to get started. Apply in minutes with our simple application process.
The material provided here has not been prepared in accordance with legal requirements designed to promote the independence of investment research and as such is considered to be a marketing communication. Whilst it is not subject to any prohibition on dealing ahead of the dissemination of investment research we will not seek to take any advantage before providing it to our clients.
Pepperstone doesn’t represent that the material provided here is accurate, current or complete, and therefore shouldn’t be relied upon as such. The information, whether from a third party or not, isn’t to be considered as a recommendation; or an offer to buy or sell; or the solicitation of an offer to buy or sell any security, financial product or instrument; or to participate in any particular trading strategy. It does not take into account readers’ financial situation or investment objectives. We advise any readers of this content to seek their own advice. Without the approval of Pepperstone, reproduction or redistribution of this information isn’t permitted.


