- English
- 中文版
Traders’ Weekly Playbook: Navigating Key Market Events and Trading Opportunities

Equity trading views for the week ahead
Having gone into last weeks ‘Traders’ Playbook’ playing for upside in select equity indices, crude and the USD, we see that this has played out fairly well – in the case of equity, we saw another strong week of equity appreciation, with the NAS100 (+6.8% w/w - week on week) and S&P500 (+5.3% w/w) leading the charge, with both US indices closing higher on all five trading days last week. US tech and consumer discretionary equity outperformed the S&P500 by 2.65% and 2.25% w/w, respectively, driven notably by a 17% w/w gain in Tesla and a 16% w/w gain in Nvidia, and assisted by solid gains in Google, Meta, Amazon and Apple.
The S&P500 moves past the monthly options expiry (OPEX), and we look to see if dealers roll off unwanted open interest, and eliminate legacy gamma exposures, which would lead to a reduced hedging requirement – a factor that could limit the upside in US equity given the influence these hedging flows have had on the performance and the momentum in the MAG7 names.
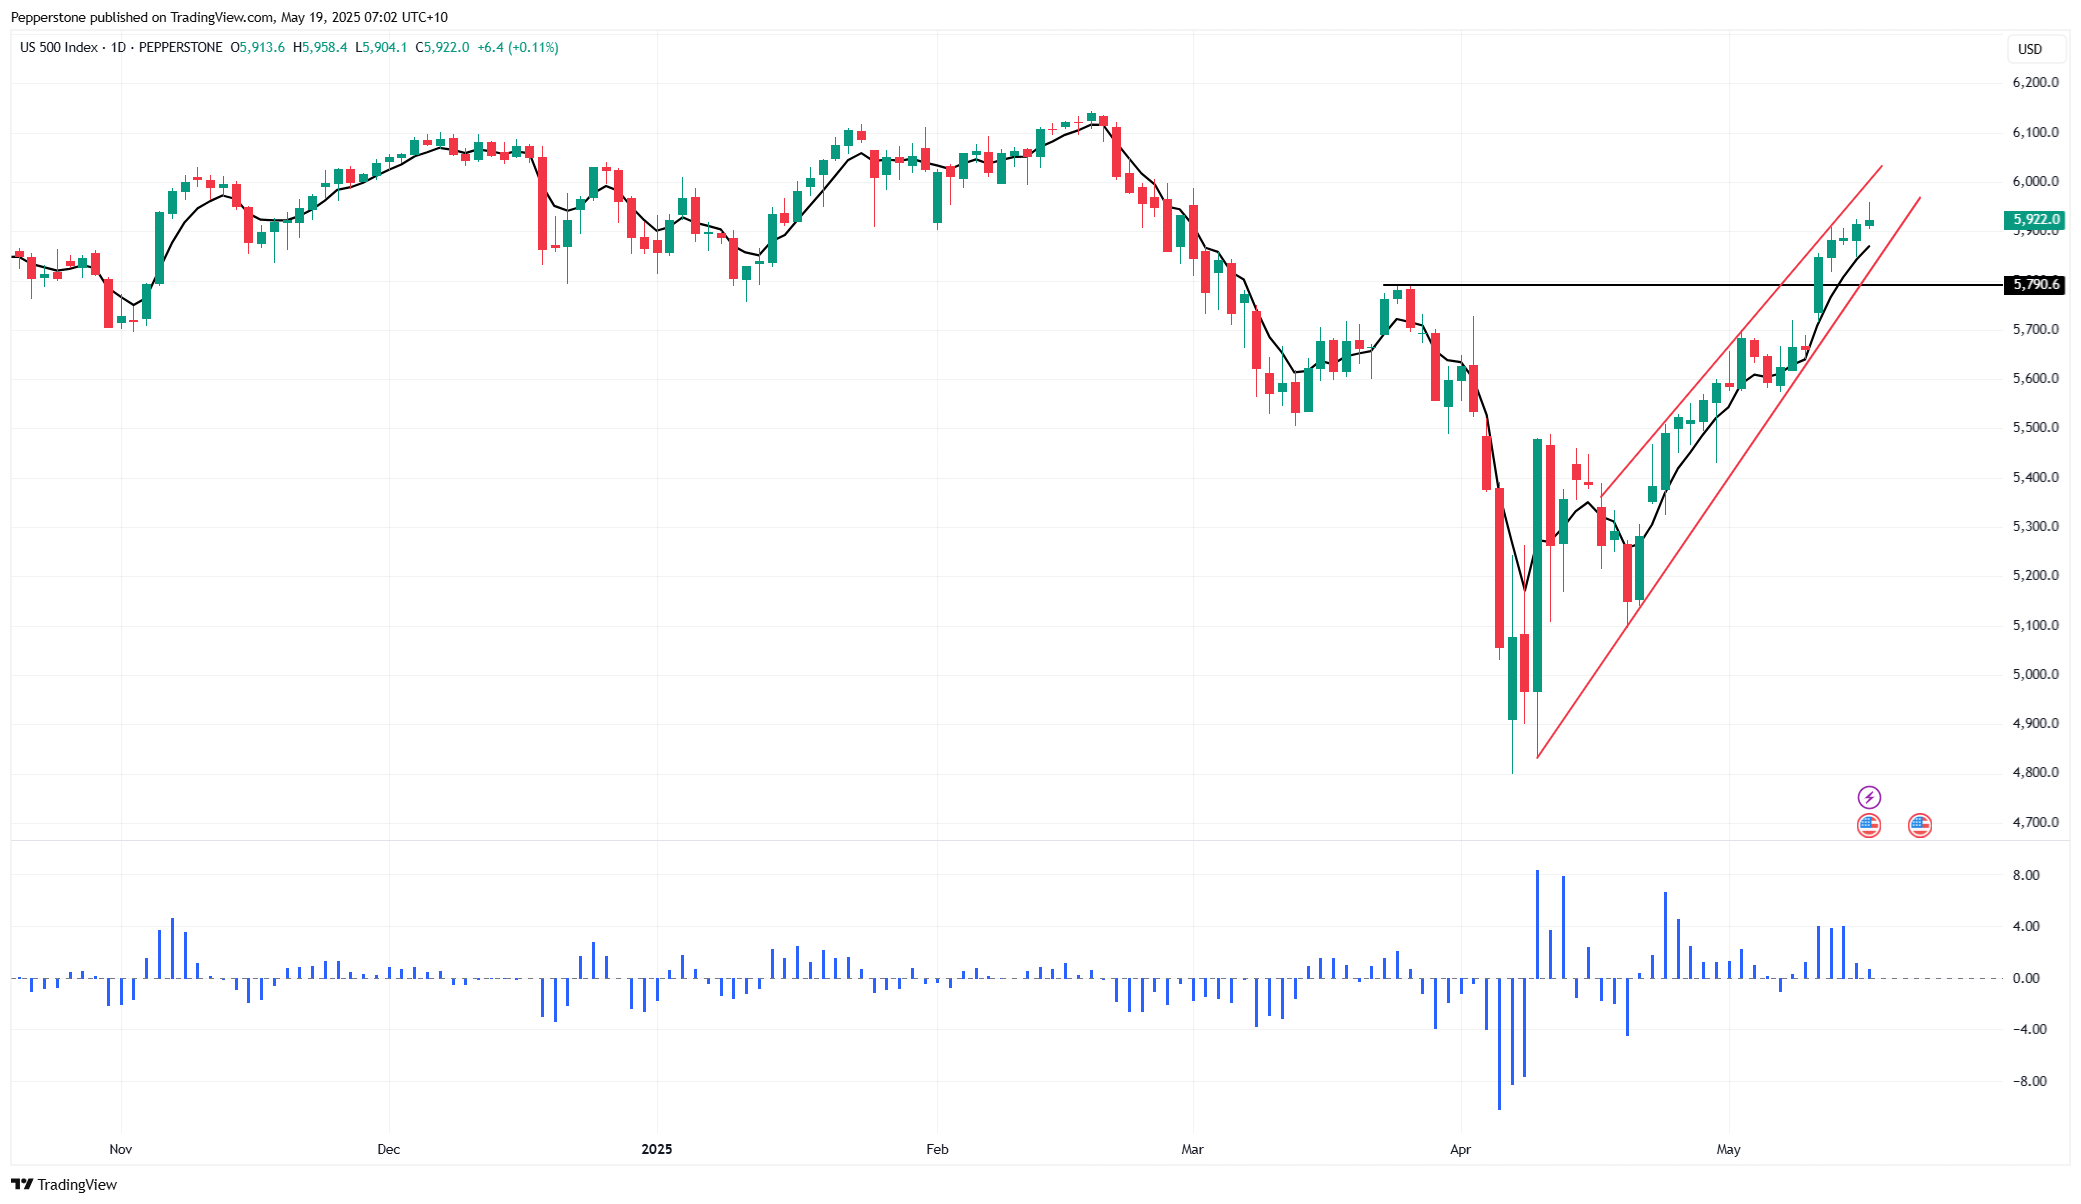
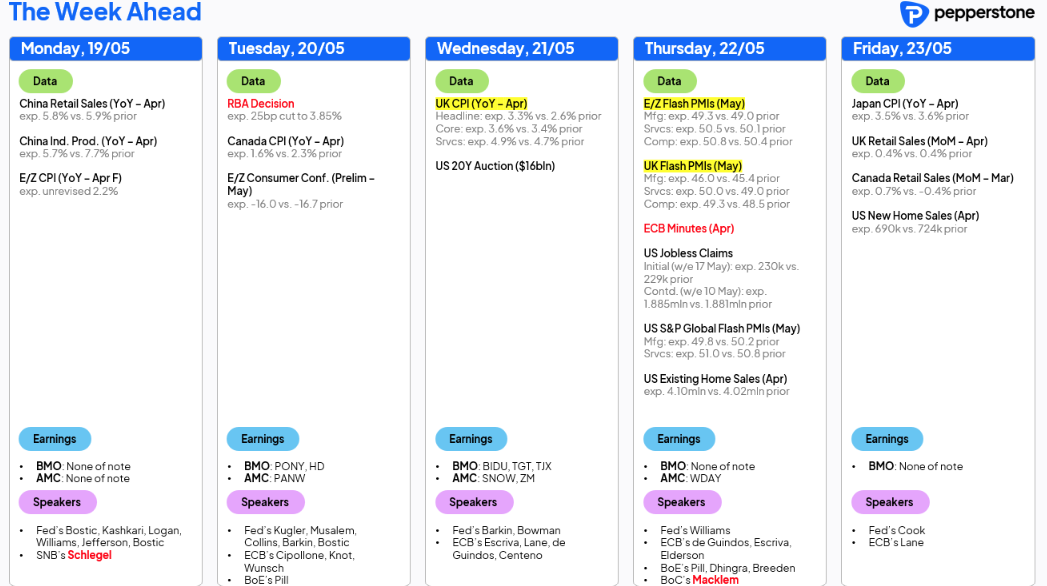
We look ahead to a quiet week on the US economic data front with earnings from Home Depot (Tuesday) and Target (Wednesday) on the radar, where the focus remains on guidance on consumer demand and tariff-related risk. I remain biased for further upside in both the SPX500 and NAS100 and will remain that way as long as price holds (and closes on the daily timeframe) above the 8-day EMA, as well as rising uptrend support - by having these simple systematic exit rules, it keeps me unemotional and participating even when it doesn’t feel right.
I acknowledge that the price action in the US equity bourses has been pushed higher by mechanical and systematic flows, as well as the resumption of corporate equity buybacks. However, improving fundamentals have also warranted the rally in the major US equity indices and led to a solid outperformance from US equity cyclicals vs defensives. Case in point, the Atlanta Fed US Q2 GDP tracking rate is currently seen at a healthy 2.4%, with several sell-side economists also upgrading their US and China 2025 GDP forecasts last week. US earnings upgrades have outpaced downgrades throughout May, a factor supporting the reemergence of the long US–short ROW equity trade.
The prospect of new all-time highs in global equity indices?
With the S&P500 +7% in May and on track for the best monthly performance since Nov 2023, I find it hard to bet against the bull trend just yet, and that would need Nvidia et al to take a hit, although that risk may well evolve as traders look to manage exposures going into NVDA’s earnings (on 28 May) with some seeing a heightened risk that they miss the $43.25b (+10% QoQ) in consensus Q126 sales expectations and/or fail to guide to $46.60b for Q226 sales and Q2 margins of 72.14%. I also consider that while we may get new trade deals this week, at 11%, we have likely seen the trough in the US effective tariff rate, and the risk over the coming months is that this will gravitate to higher levels.
The German DAX shows us the way when it comes to printing new highs, and other global indices may follow suit soon enough - the S&P500 and NAS100 fall within 5% of their own respective all-time highs, while the ASX200, CAC40, and FTSE100 all sit within striking distance of this milestone. As a rough guide, S&P500 1-week implied volatility closed on Friday at 12.98%, which equates to an expected move on the week of -/+1.83% (with a 68.2% level of confidence). Subsequently, while 1-week vol was a poor guide last week as to the extent of the S&P500 weekly change, a 3.5% rally this week, to get the S&P500 to new highs, seems a tall order.
Trading FX in the week ahead
The DXY gained 0.6% w/w, and while the USD took a small hit in the final moments of futures and FX trade on the Moody’s rating downgrade, I expect the effects of the rating downgrade to be short-lived. Technically, the DXY continues to move in a rising channel (or what could be seen as a bear flag pattern) and last Monday looked primed for a run to the inverse head & shoulders target of 103, but failed at the 50-day MA. Being a USD bull is tough as rallies are short-lived and have failed to kick - on the higher timeframe, we see EURUSD and GBPUSD consolidating and currently offering limited signal for the momentum traders.
AUDUSD also kicks onto the radar, with the pair holding a range of 0.6500 to 0.6350 since mid-April and in need of a new catalyst to evolve the trading environment from sideways consolidation towards a state of trend. We see a better trending state (for the AUD) vs the NZD, CHF and EUR, although the price action holds a low rate of change and the movement is more of a grind.
The RBA set to deliver a ‘hawkish cut’
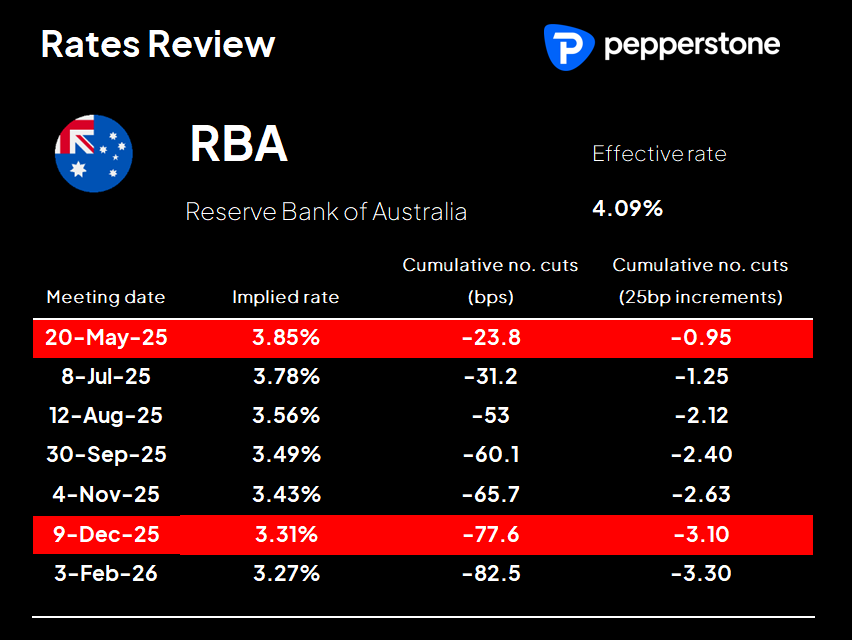
Tuesday’s RBA meeting is a risk for AUD positions and ASX200 interest rate-sensitive stocks, even if a 25bp cut is fully priced by AU swaps/rates futures and seen as a done deal. The RBA rarely go against such high conviction in market pricing, but this time around it wouldn’t materially surprise if the RBA did leave the cash rate at 4.10% - in fact, they could hold rates and justify their actions and not face the sort credibility-related outcry from market players that would typically be the case for any central bank who went against an 80%+ implied outcome.
That said, it would still surprise if they didn’t cut the cash rates by 25bp, with the real cash rate (deflated by trimmed mean CPI) at 1.20% - the highest since 2012 – and inflation holding within the RBA’s 2-3% target range – however, the risk is that that the accompanying statement fails to meet the additional 50bp of implied easing priced through to December, and that may skew the risk towards AUD upside from the meeting.
The China April data deluge on Tuesday may also get some attention, as will the expected cut to the prime rate on Wednesday. The economic activity data doesn’t capture the rollback of US-China tariffs, so it may be seen as stale. China/HK equity may still be sensitive to the data as growth, not just liquidity, attracts capital, and I would be a better buyer of the HK50 (our cash market and futures) on a close above 23,600.
Gold remains a trader favourite, and our volumes remain elevated – that may well be a function that gold 1-week realised volatility is comparatively high at 25% (the 72nd percentile of the 52-week high-low range) and there is increasing disagreement from market players around the near-term direction for gold. After finding buying support at the former 3 April breakout high, the price action has come back into balance with buyers supporting at $3160 and better supply seen at $3240. ETF flows – both in the GLD ETF and the main Chinese gold ETFs – have seen consistent outflows, while we also look at the US Treasury market with yields across the curve pushing recent range highs, with a potential push into 4.6% on the UST 10yr, a near-term risk for the gold market.
Good luck to all.
The material provided here has not been prepared in accordance with legal requirements designed to promote the independence of investment research and as such is considered to be a marketing communication. Whilst it is not subject to any prohibition on dealing ahead of the dissemination of investment research we will not seek to take any advantage before providing it to our clients.
Pepperstone doesn’t represent that the material provided here is accurate, current or complete, and therefore shouldn’t be relied upon as such. The information, whether from a third party or not, isn’t to be considered as a recommendation; or an offer to buy or sell; or the solicitation of an offer to buy or sell any security, financial product or instrument; or to participate in any particular trading strategy. It does not take into account readers’ financial situation or investment objectives. We advise any readers of this content to seek their own advice. Without the approval of Pepperstone, reproduction or redistribution of this information isn’t permitted.