- English
- 中文版

This triggered the worst selling of the S&P 500 in the last 12 weeks with prices sinking as low as 6%, and the DOW Jones moving down 7% over the trading period. For many traders, this will be an opportunity to either pick up indices CFDs at cheaper prices for the longer term, or to see if further bearish momentum pushes the S&P 500 back to previous lows.
With this increased volatility, the margin FX and gold markets have also started to look attractive. The synergies between Gold (XAUUSD) strength and bearish market movements have been well documented, but over the last few months the AUD/USD has been correlated to the S&P 500, so could this create further opportunity? Let us discuss this below.
S&P 500 down 6% straight into 3000 psychological support
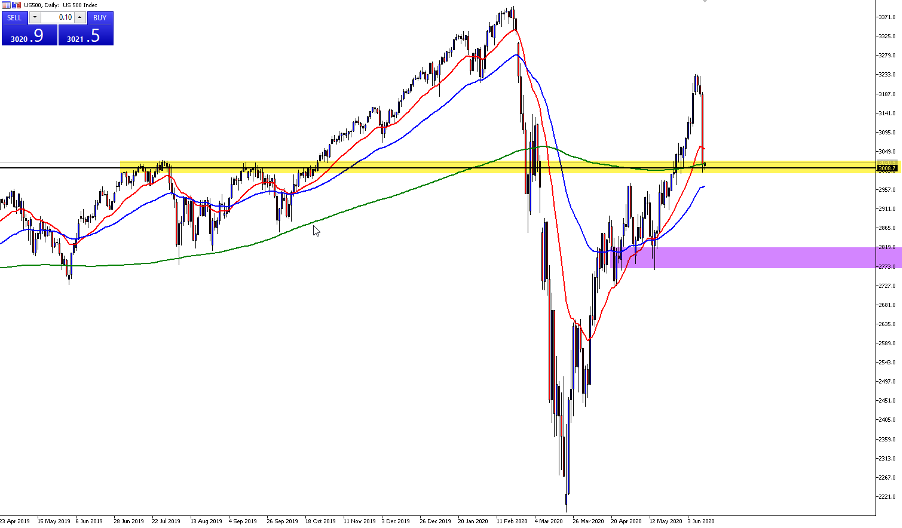
The S&P 500 has now sold off for three consecutive days, with the total movement from top to bottom currently being approximately 200 points. Price has now reached several key technical zones. The 3000 psychological area (highlighted in yellow) where previous resistance has now become potential support, and the 200 simple moving average (green line), which will likely act as dynamic support for the short-term price movements.
If price were to continue lower, the next key area of support at 2800 (highlighted in purple) would become the most likely technical area for the S&P 500 to find more buying support.
The correlation between the S&P 500 and the AUDUSD
If you were to overlay the S&P 500 charts and AUDUSD charts since February, you would see a clear correlation. The Aussie (AUDUSD) has continued to show strength while the S&P 500 has also strengthened significantly.
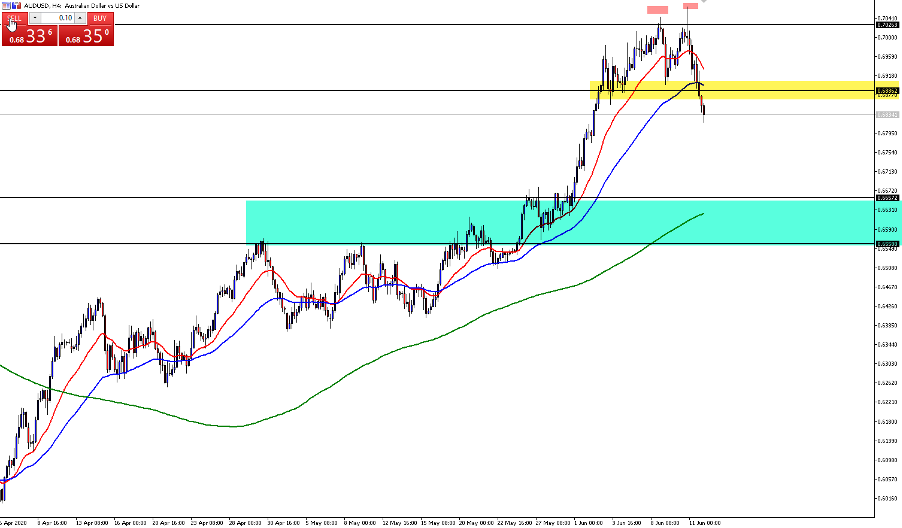
Last night a double top pattern formed showing bearish sentiment on the AUDUSD with price breaking below the intervening trough at 69.000 and moving lower. A double top pattern signifies weakness in the bullish sentiment on the AUDUSD, alerting traders to a possible change of trend.
This could mean the AUDUSD continues to find weakness into the green highlighted area where the 200 simple moving average on the 4hr will act as some form of dynamic support. If the S&P 500 also continues its bearish momentum, this would further strengthen the case for the double top and the expectation that the correlation would continue between the two instruments.
So, if the AUDUSD and S&P 500 is potentially weak, what could this mean for gold
One of the most underutilised technical trading concepts is the idea of cross instrument analysis. Gold (XAUUSD) often outperforms during periods of uncertainty and share CFD market weakness. If a clear connection between AUDUSD weakness and share CFDs market weakness is currently evident, then why not take a technical look at the XAUAUD.
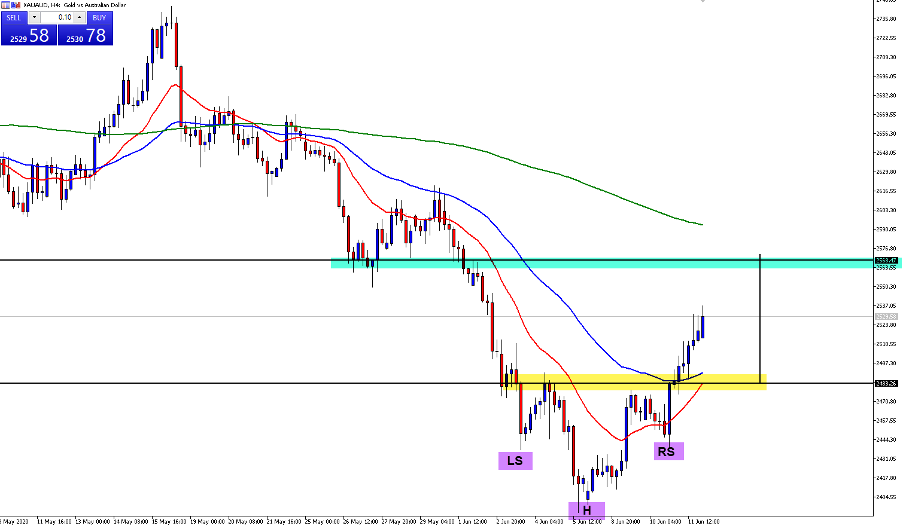
The XAUAUD has formed an Inverse head and shoulders pattern on the 4hr chart which broke yesterday, where the left shoulder and right shoulder (highlighted in purple) are approximately equal in size. The close above 2480 and the 50 day exponential moving average (blue line) has confirmed that the buyers are currently in control, and the area highlighted in green is the technical Take Profit zone for an Inverse Head & Shoulders pattern such as this.
The importance of cross instrument analysis
Whenever possible it is great for traders to think about the instrument they are trading and the opportunities within similar pairs. The above ideas outline a thought process which many traders often underutilise, and it is another tool to help investors better understand how the markets operate.
When considering which pair might be right for your setup, why not check out a few comparable pairs and see if the prospects are even better there?
Related articles

Ready to trade?
It's quick and easy to get started. Apply in minutes with our simple application process.
The material provided here has not been prepared in accordance with legal requirements designed to promote the independence of investment research and as such is considered to be a marketing communication. Whilst it is not subject to any prohibition on dealing ahead of the dissemination of investment research we will not seek to take any advantage before providing it to our clients.
Pepperstone doesn’t represent that the material provided here is accurate, current or complete, and therefore shouldn’t be relied upon as such. The information, whether from a third party or not, isn’t to be considered as a recommendation; or an offer to buy or sell; or the solicitation of an offer to buy or sell any security, financial product or instrument; or to participate in any particular trading strategy. It does not take into account readers’ financial situation or investment objectives. We advise any readers of this content to seek their own advice. Without the approval of Pepperstone, reproduction or redistribution of this information isn’t permitted.