- English
- 中文版
The Daily Fix: The USD laughing in the face of recent bearish calls

As mentioned yesterday, index valuation is at extremes and while this has mattered little and has been an awful timing tool, when we see the S&P 500 tracking 20x 2021 earnings the bulls need new news and inspiration to push price higher. That inspiration isn’t readily available.
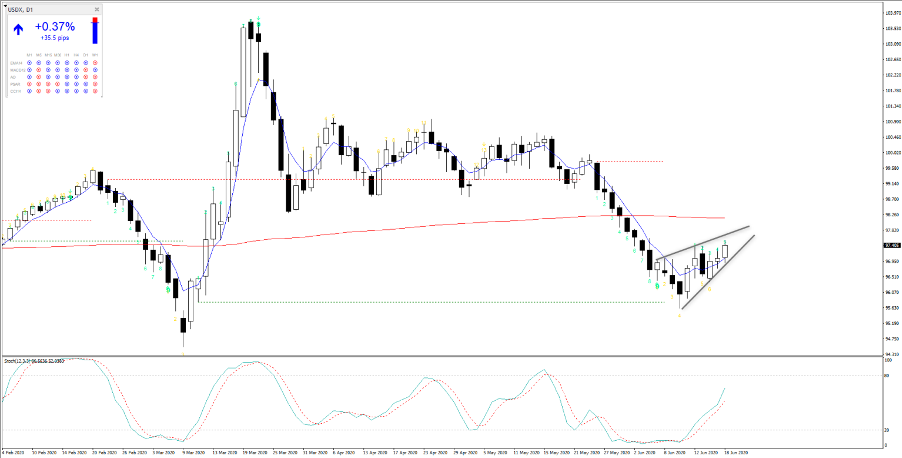
We did see some life in margin FX markets, however, with the USD continuing to laugh in the face of several incredibly bearish calls of late. EURUSD is looking to push through 1.1200 and that could open up a near-term move into 1.1139 (S2 and the daily implied option move). The USDX, which takes a 57% weighting of the EUR has been moving higher, although we see price tracking in a bear flag and should the USD bears step up to complete the pattern then I’d go along with that – until then, I am not betting against the USD and to do so would need the bullish tape in global equities to resume.
GBP has been well traded in the wake of the BoE meeting and while the BoE avoided talk of negative rates and lifted its QE program by the minimum expected, the flow has been quite heavy on the GBP offer. EURGBP looks the more interesting trade, with the cross holding the 90-handle and there is scope to head to 0.9090, although we will need to see the move extend through 0.9020. In GBPUSD, a break of the 50-day MA in cable (now 1.2427) takes us to 1.2290 in my opinion.
The week ahead
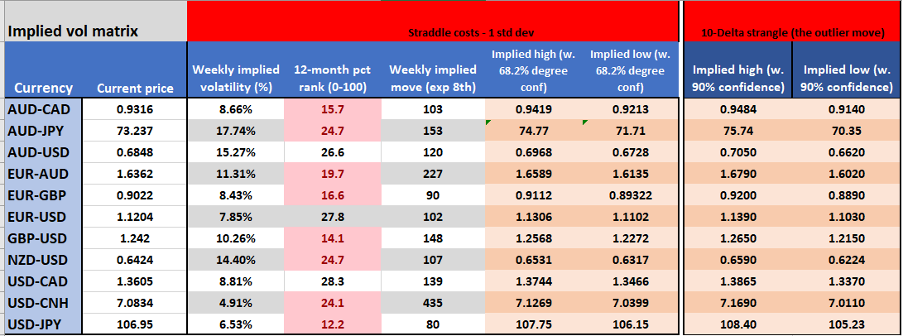
Turning the page to next week, data is on the light side, although there are a few bits to watch in Europe, with PMIs, and the IFO survey on the docket. I have put together the weekly volatility matrix, which looks at the option market and at the ATM straddle and 10-delta strangle price. For non-options traders, these strategies are for traders to buy and sell volatility and offer an explicit degree of movement implied in price, with a 68.2% degree of confidence and 80% that price will be contained within this range. I like to use this for spot margin FX trading as it helps understand if the market sees movement given the known event risks – we can use this effectively for risk purposes.
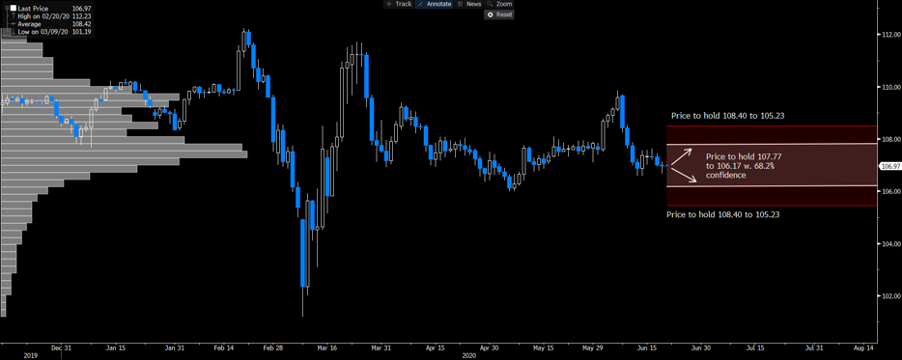
One way to visualise this is to draw the ranges, in a similar fashion as a forward-looking Bollinger band. Here, I have used USDJPY and drawn the straddle range and 10-delta strangle which gives me the outlier move. 10-delta is effectively an option which the market sees as having a 10% chance of price moving past the strike and ‘in the money’.
Basically, it would be a big surprise if price was to move either side of the wings. Pivot points are good tools and I use these as well in conjunction.
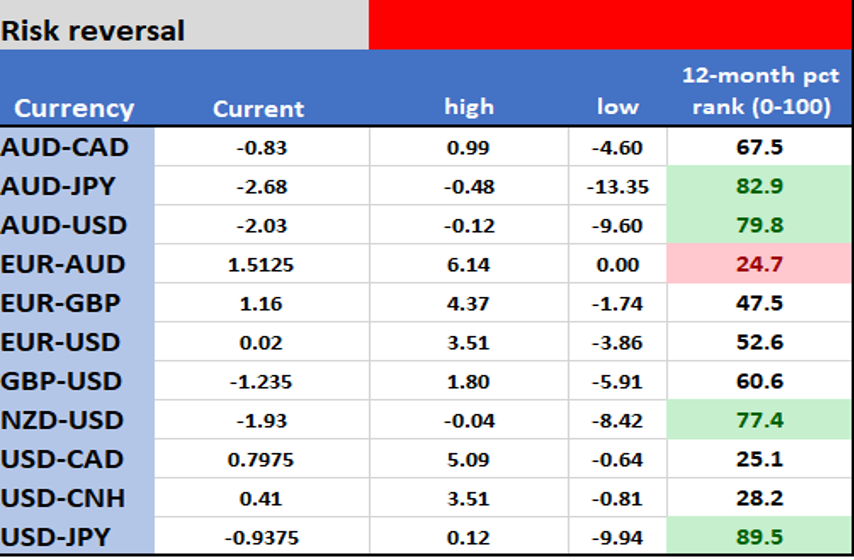
We can look at the weekly margin FX risk reversal matrix too. A ‘risk reversal’ is basically the 1-week call volatility subtracting 1-week put vol against it. If you see a negative number, it means put (bearish) vol trades at a premium to call (bullish) vol and tells me the market has been better buyers of downside structures as opposed to bullish ones. Or put another way, if the market expects a move it expects a more aggressive downside move than upside.
Some pairs, such as AUDUSD will generally always trade a negative, hence we look at the level in relation to a 12-month range, or preferably 3-year range. It offers a great alternative way of measuring sentiment in a currency pair.
Related articles


Ready to trade?
It's quick and easy to get started. Apply in minutes with our simple application process.
The material provided here has not been prepared in accordance with legal requirements designed to promote the independence of investment research and as such is considered to be a marketing communication. Whilst it is not subject to any prohibition on dealing ahead of the dissemination of investment research we will not seek to take any advantage before providing it to our clients.
Pepperstone doesn’t represent that the material provided here is accurate, current or complete, and therefore shouldn’t be relied upon as such. The information, whether from a third party or not, isn’t to be considered as a recommendation; or an offer to buy or sell; or the solicitation of an offer to buy or sell any security, financial product or instrument; or to participate in any particular trading strategy. It does not take into account readers’ financial situation or investment objectives. We advise any readers of this content to seek their own advice. Without the approval of Pepperstone, reproduction or redistribution of this information isn’t permitted.