- English
- 中文版
.jpg?height=93&quality=100)
The Turkish lira has come under tremendous selling pressure (falling over 15% in the early hours of trade) due to the replacement of the Central Bank of the Republic of Turkey (CBRT)’s Governor. This boiled down to Friday’s meeting which saw a 200 bps hike (100 bps above consensus) from Naci Agbal to try and stem the high inflation ailing Turkey’s economy. He has now been replaced with Sahap Kavcioglu, who is a believer of Erdoganomics, in that higher rates leads to higher inflation. Last month he stated – “Many countries with domestic/foreign problems have negative real interest rates so could Turkey”. We’ve seen a lot of interesting developments in financial markets, but I never thought I’d hear the suggestion of NIRP in Turkey. This reshuffle of the Central Bank Governor would make him Turkey’s fourth in the space of two years. Turkey is one of the largest and most important developing markets, with problems there raising the risk of a contagion and potential spill over into other EM FX crosses.
Agbal was in a difficult position as the only way to stem recent weakness in the lira was to hike rates, but Erdogan is anti higher rates and therefore didn’t take kindly to this policy move. The credibility of the Central Bank has been severely damaged as a result. This will have seriously dented investor confidence and the trust that had been built up from the last market rout, with investor expectations about policy direction shifting dramitically. For those that took a gamble on Turkey, they will be nursing substantial losses. The iShares Turkish ETF is down almost 20% today and indicates a swift reversal of investor enthusiasm towards Turkish assets. The yield on the Turkish 10-year has spiked by over 200 bps and the most liquid (5-year) Credit Default Swaps (insurance on a country defaulting on their debt) is now well above 400 bps, providing a measure of investor emotions regarding Turkey.
Some have suggested today’s lira weakness was exacerbated by a violent carry trade unwind from retail Japanese investors who were short JPYTRY. Positioning data from Friday points to long positions in lira-yen of 263,585 contracts. Turkey has a large current account deficit and with investors feeling nervous and hesitant to fund that deficit there could be a sharp adjustment within the current account, heaping further pressure on the lira. FX reserves are running on fumes after being significantly depleted last year, Soc Gen, estimates about -$40 bn in net FX reserves excluding swaps. This could lead to more unorthodox monetary policy as well as “soft” capital controls being implemented shortly. The lira will remain on a volatile rollercoaster ride as the forces in the FX market push and pull the currency all over the place. In terms of important dates to pencil in we have an inflation release on the 5th of April and the next CBRT meeting on the 15th of April where I think the new Governor will reverse the latest hike, but will ultimately be forced by the market eventually to hike rates.
Spain and France have the largest exposure to Turkey’s problems through their banks and if the situation gets worse we could see some follow through into the euro. Nordea’s chart below provides a nice graphical representation of this exposure.
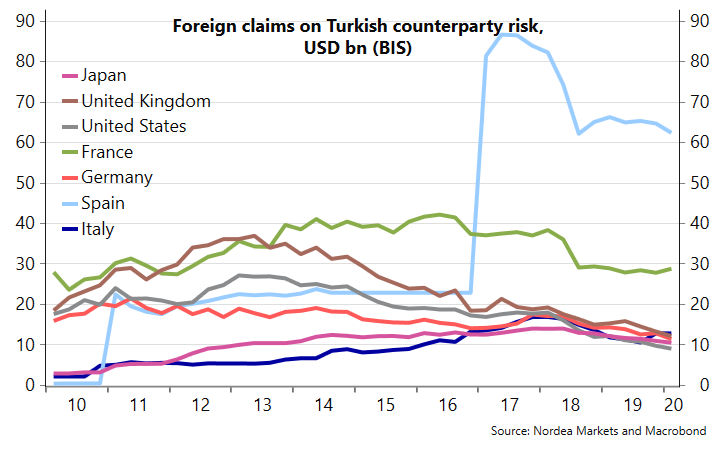
Source: Nordea
The lira has some serious technical damage on its charts. Price almost spiked to the November highs around 8.50/8.60. Price will need to close below the 7.9 resistance level for further weakness to be stemmed. The 50-day SMA remains above the 200-day SMA and therefore the bias remains to the upside for USDTRY.
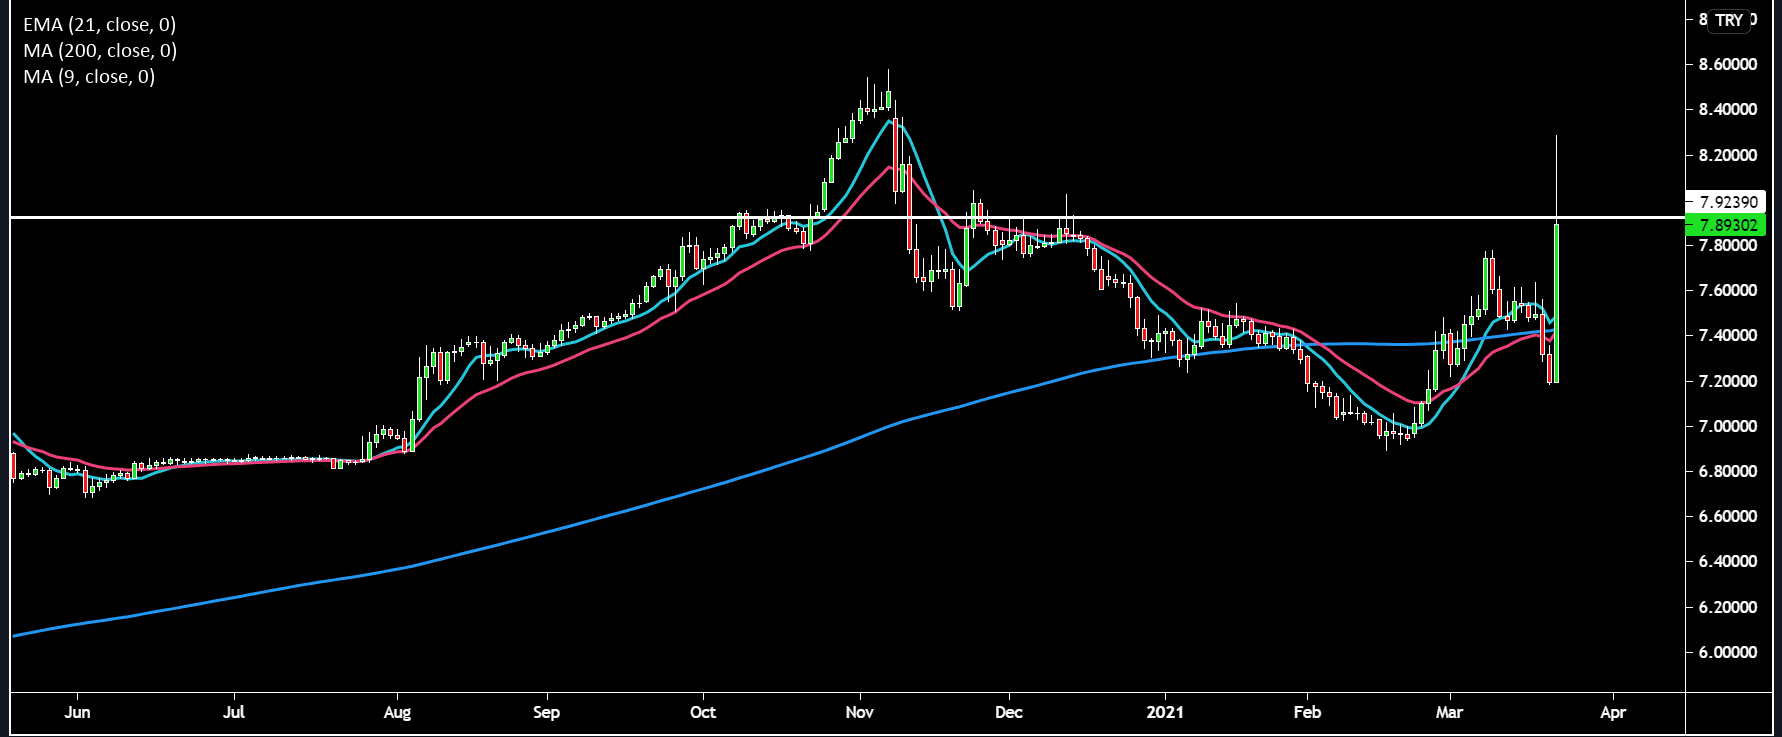
Pink line: 21-day EMA, Light Blue line: 50-day SMA, Dark Blue line: 200-day SMA (same for the other chart)
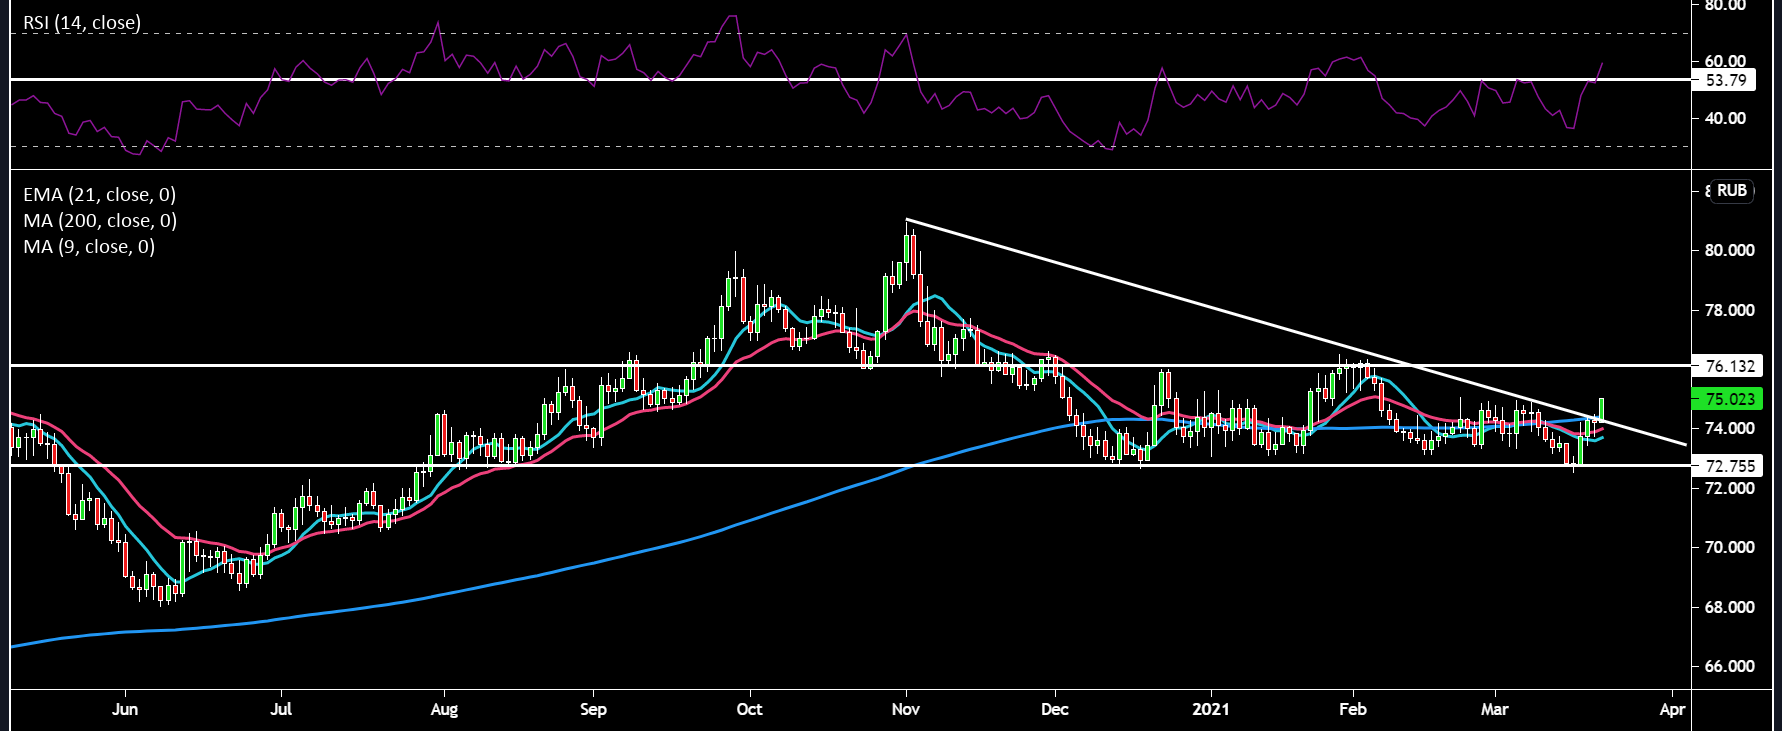
Russia is another interesting currency to take a look at. On Friday the Russian Central Bank hiked rates by 25 bps when market expectations were for rates to remain flat. Any hoped for strength has been eroded due to a couple of factors. The price of oil came under large pressure last week with a circa 7% slump lower. There was hawkish rhetoric between President Biden and Russian President Putin, which would have enlarged the geopolitical risk premium embedded in the USDRUB pair. Further evidence of this would be from the divergence in the correlation between the price of oil and the USDRUB which started to from last year around the US presidency. Today’s price action is weaker on the back of lira spill over weakness. The technicals provide a trading opportunity as USDRUB seems to be in a range between 72.75 and 76. Price has also broken above its downtrend line in place from November 2020. The RSI is now pushing above the 53.8 resistance level and the shorter term moving averages are pointing up, looking like they want to slice through the 200-day SMA. If price does continue to push higher we’ll have to watch if it holds the 76 resistance area or we could see further weakness towards the 78-80 zone. If price were to break to the downside of the range (72.75) then 70 starts to look like a good first price target.
Related articles
.jpg?height=420)

Ready to trade?
It's quick and easy to get started. Apply in minutes with our simple application process.
The material provided here has not been prepared in accordance with legal requirements designed to promote the independence of investment research and as such is considered to be a marketing communication. Whilst it is not subject to any prohibition on dealing ahead of the dissemination of investment research we will not seek to take any advantage before providing it to our clients.
Pepperstone doesn’t represent that the material provided here is accurate, current or complete, and therefore shouldn’t be relied upon as such. The information, whether from a third party or not, isn’t to be considered as a recommendation; or an offer to buy or sell; or the solicitation of an offer to buy or sell any security, financial product or instrument; or to participate in any particular trading strategy. It does not take into account readers’ financial situation or investment objectives. We advise any readers of this content to seek their own advice. Without the approval of Pepperstone, reproduction or redistribution of this information isn’t permitted.