- English
- 中文版
Learn to trade
How are forex patterns made?
Forex patterns are made by the movement of a currency pair on a price chart. By deciphering these forex patterns, we can give ourselves a bias on the next price move. Some patterns come with projected targets known as the ‘measured move’. This forms part of a study known as technical analysis.
In this blog we will look at bearish formations. Please keep in mind that these forex patterns can all be reversed to highlight a bullish scenario instead.
Reversal Patterns
Double or Treble Top or Bottom
A double or treble top occurs when sellers appear at a price level. This is the initial resistance where the first selloff is seen. Buyers then return to test the previous resistance zone. A push lower from this area forms a double top.
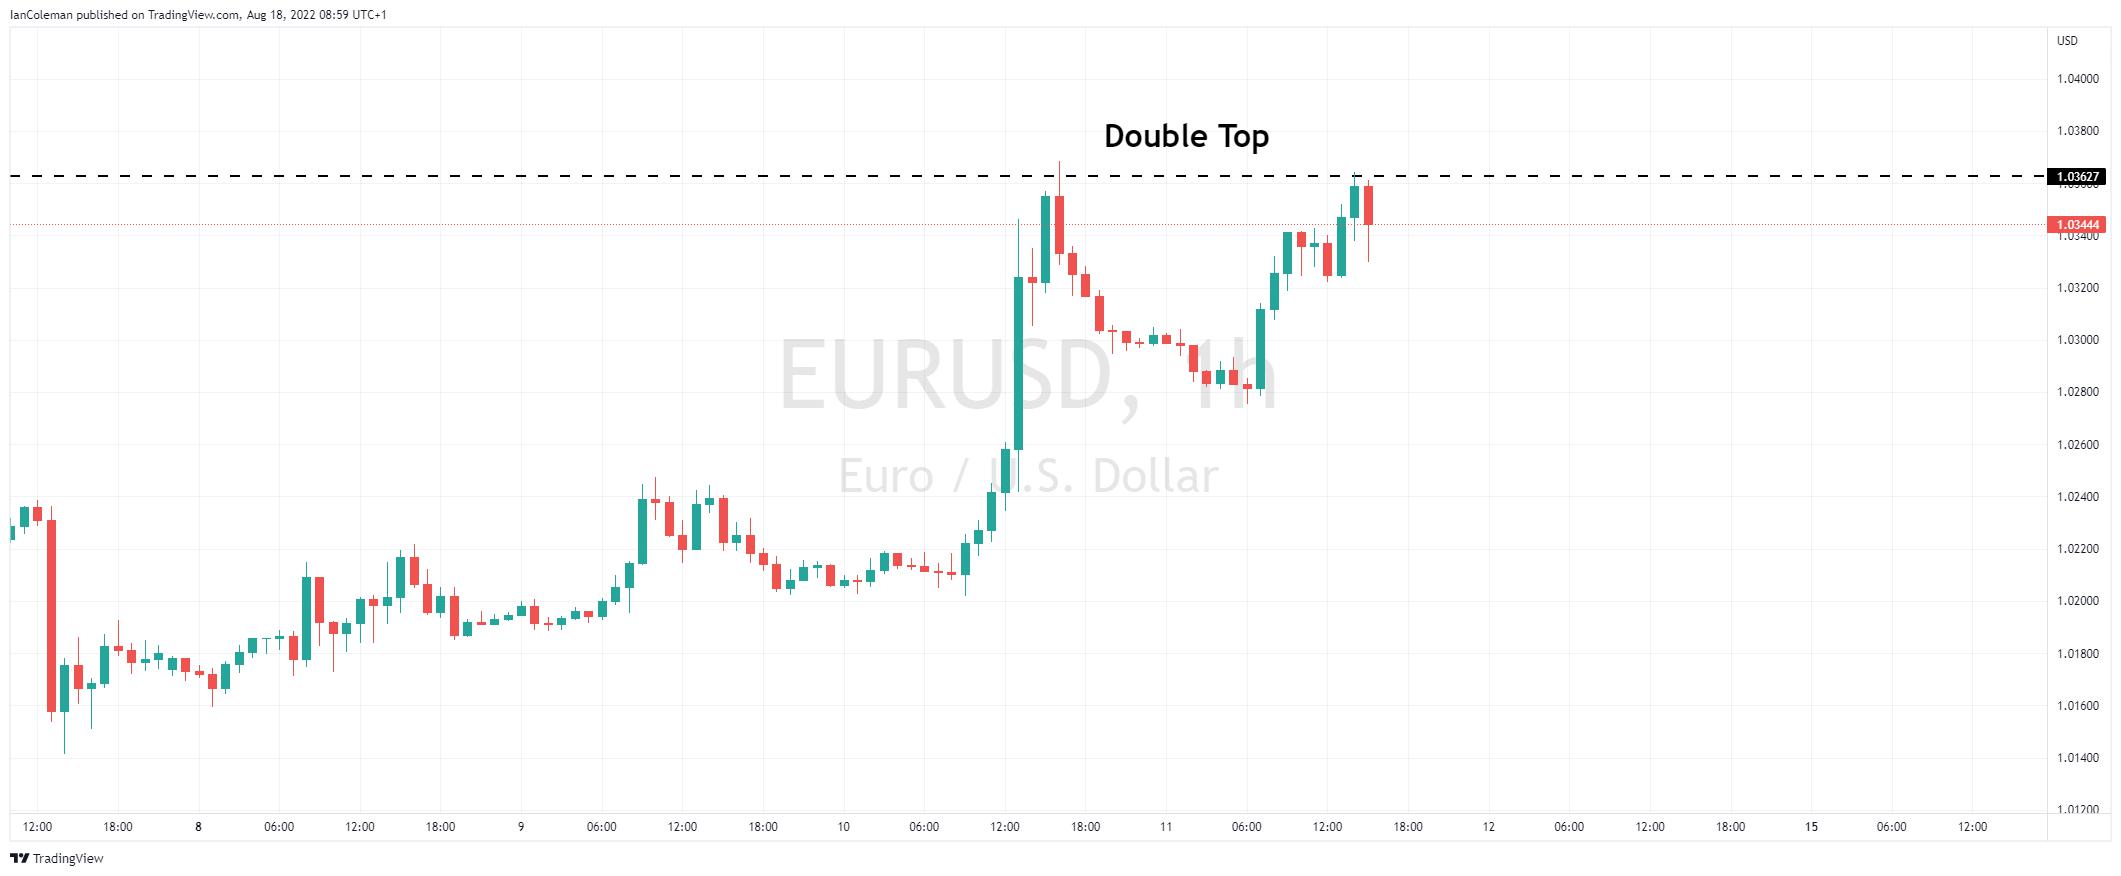
Figure 1 Trading View Double Top
The forex pattern is confirmed with a break of the previous swing low.
The measured move target is the length from the swing high to the swing low. This length is then projected from the swing low, the breakout level.
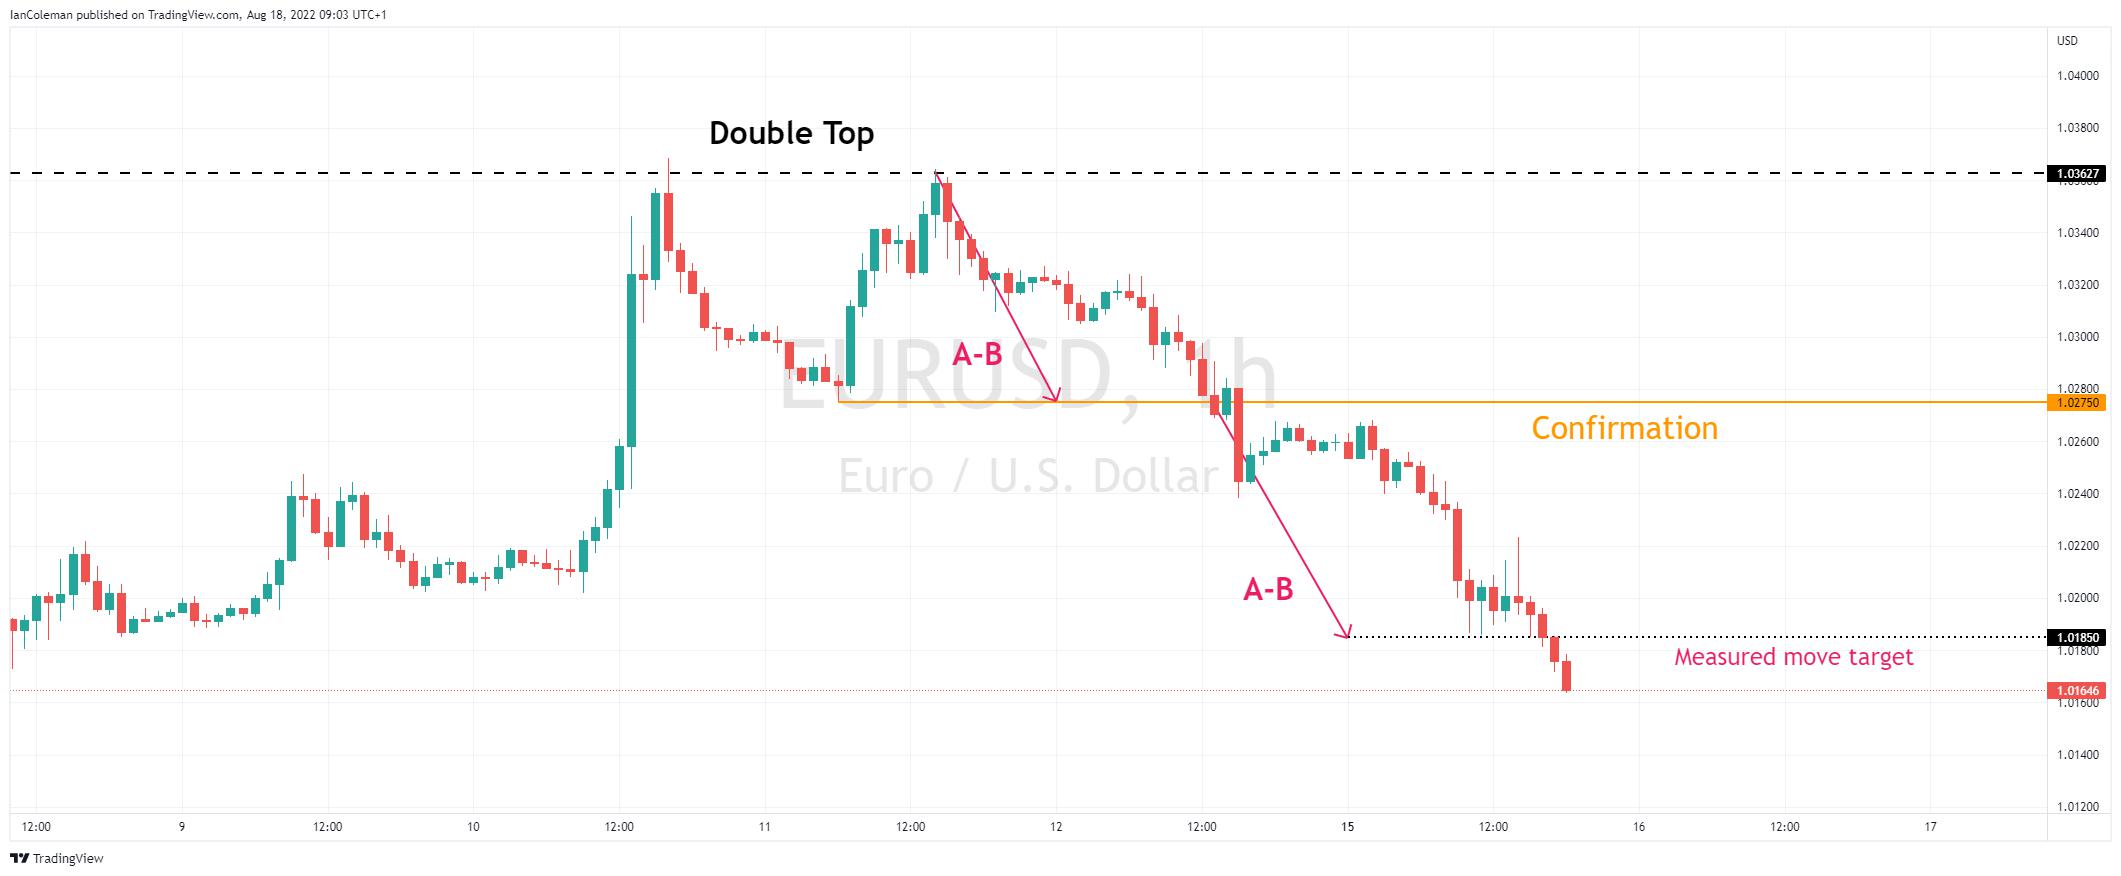
Figure 2 Trading View Double Top confirmation
The treble top forex pattern tests the resistance zone three times. It is sometimes analysed as a Head and Shoulders pattern
Head and Shoulders
A Head and Shoulders forex pattern occurs when a resistance zone is tested three times. Note that buyers manage to push to a new swing high in the 2nd wave of buying but fail to produce a new swing high in the 3rd wave. The subsequent selloffs offer a support line. This is known as the neckline.
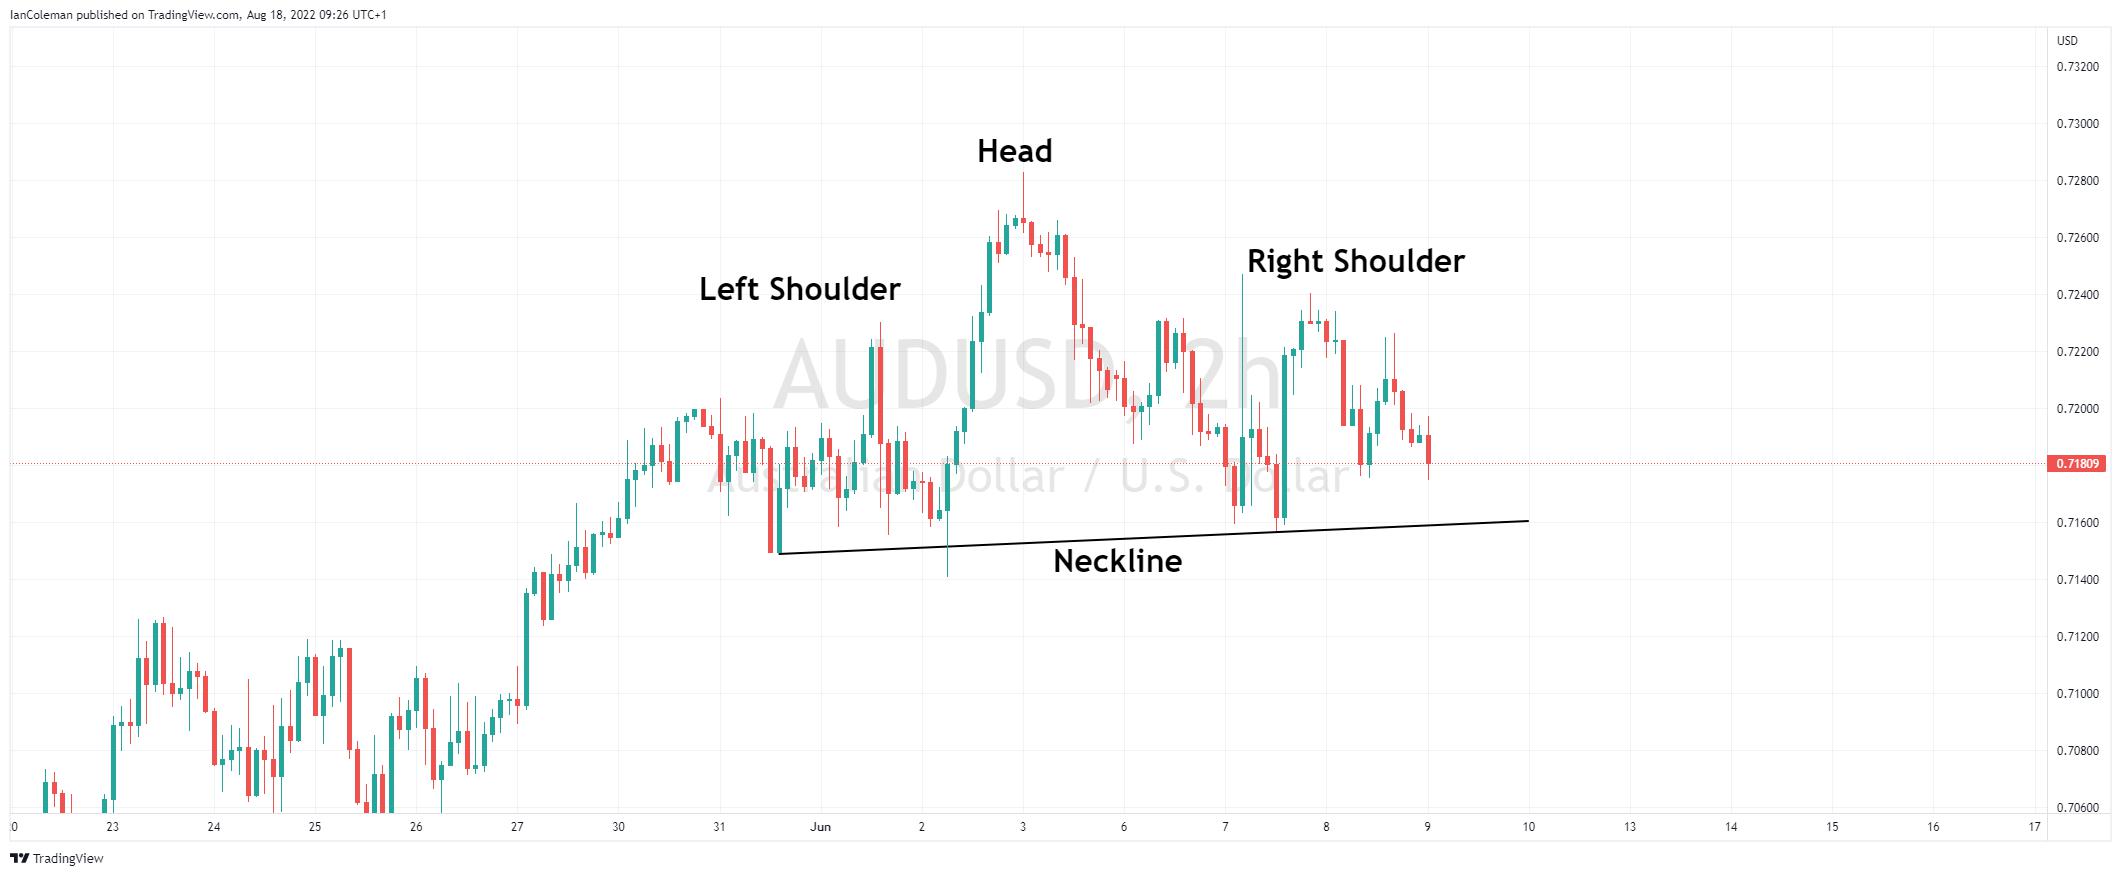
Figure 3 Trading View Head and Shoulders
The forex pattern is confirmed on a break of the neckline. The measured move target is the length from the head to the neckline, projected from the neckline (breakout level).
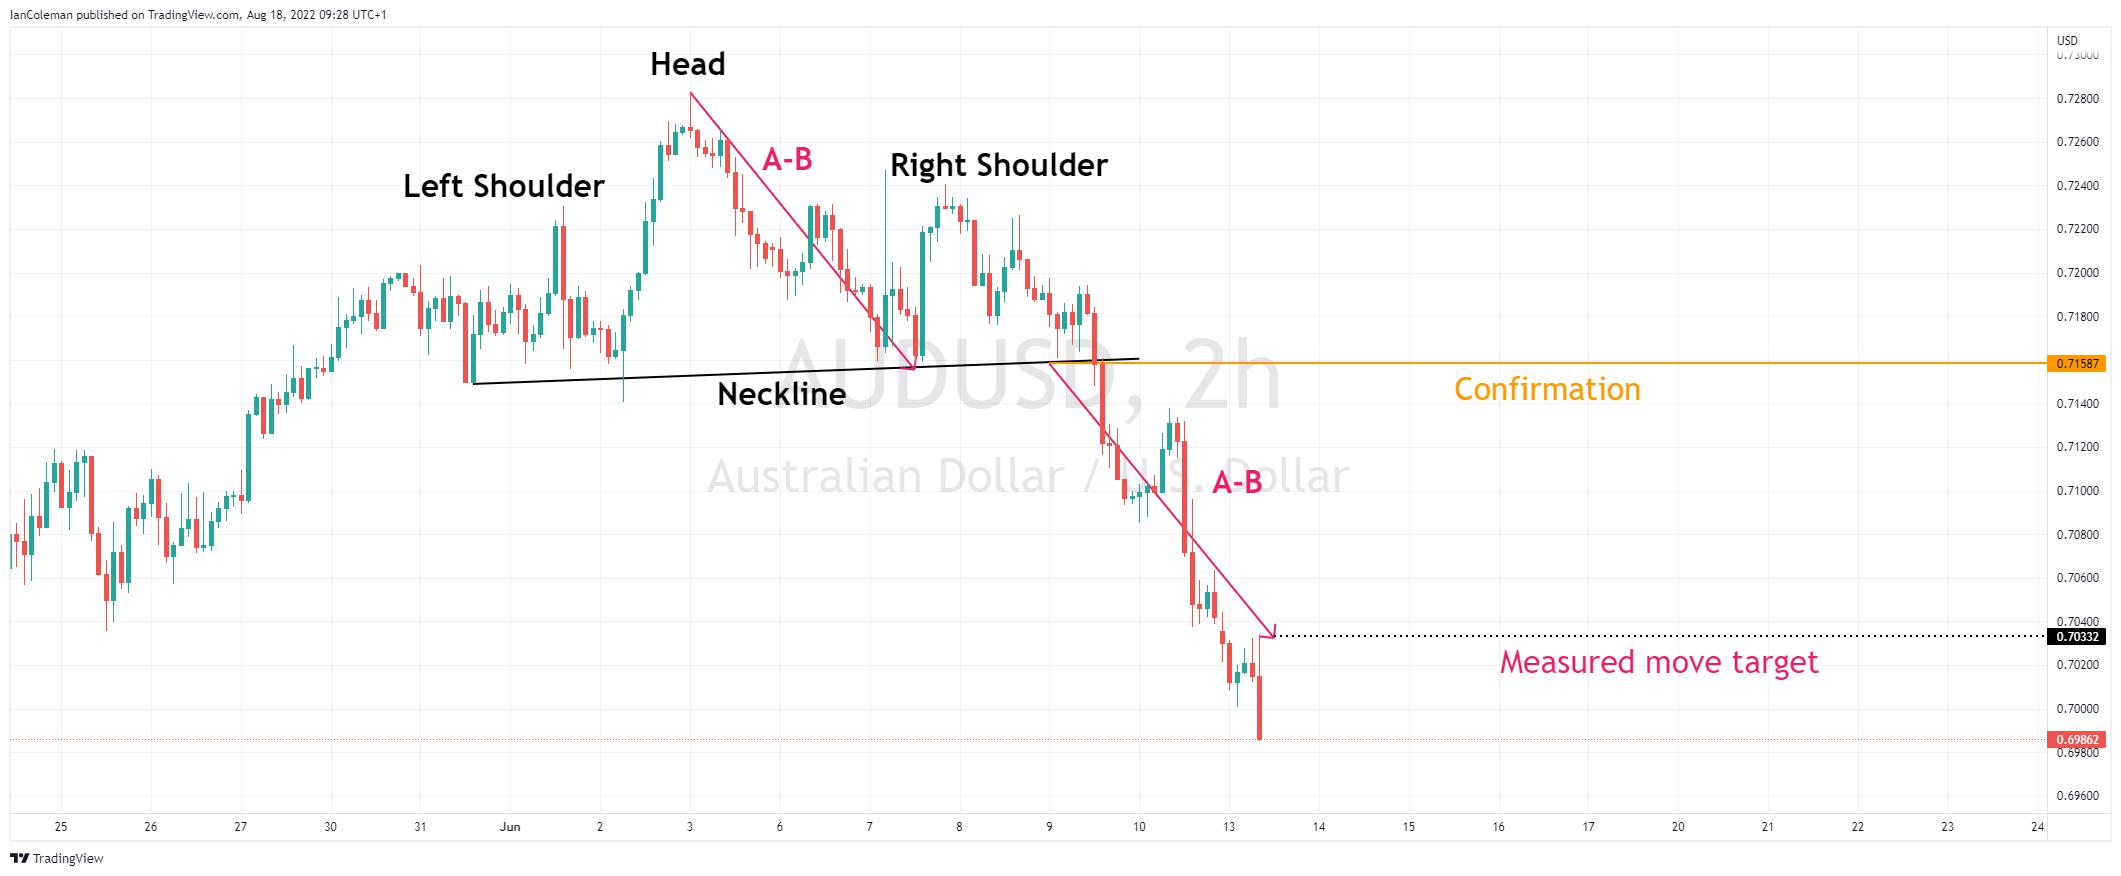
Figure 4 Trading View Head and Shoulders confirmation
Ending Wedge
An ending wedge forex pattern occurs when the market keeps making higher highs and higher lows, but the rallies are losing momentum. This forms a pattern known as a Rising or Ending Wedge.
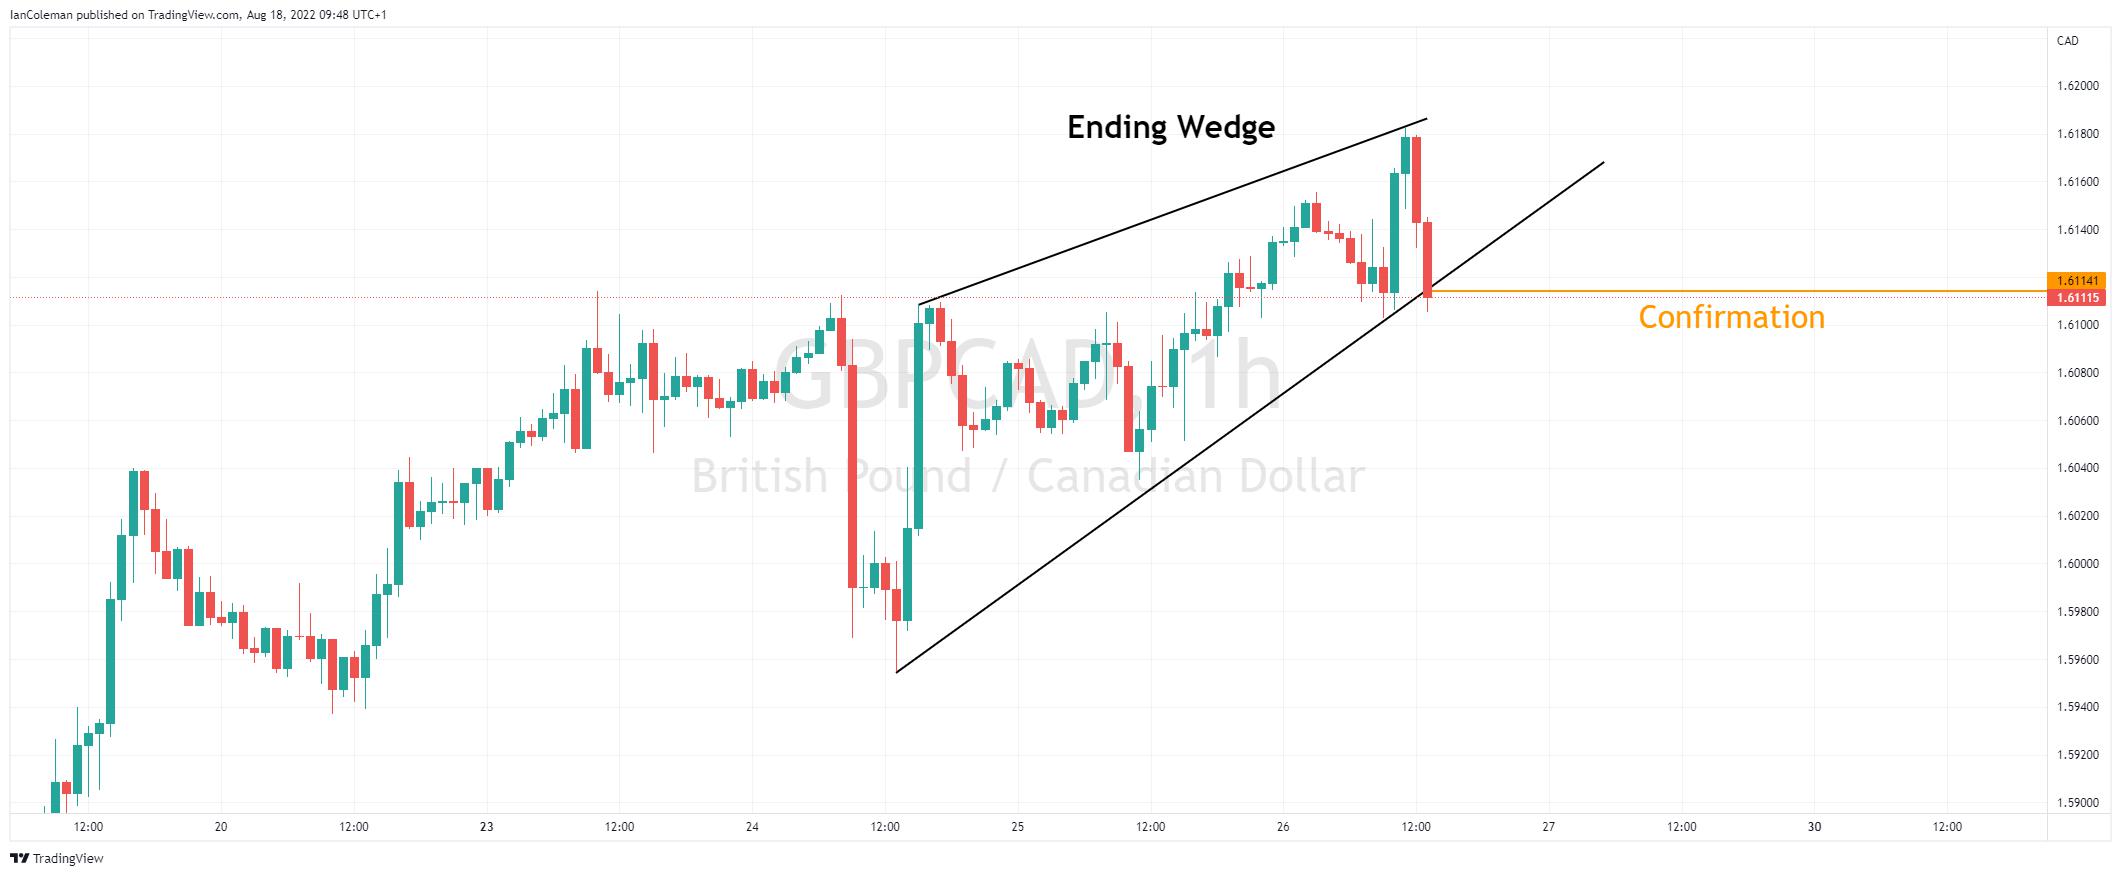
Figure 5 Trading View Ending Wedge
A move through the lower trend line support is confirmation of a breakout. The measured move target is the start of the wedge.
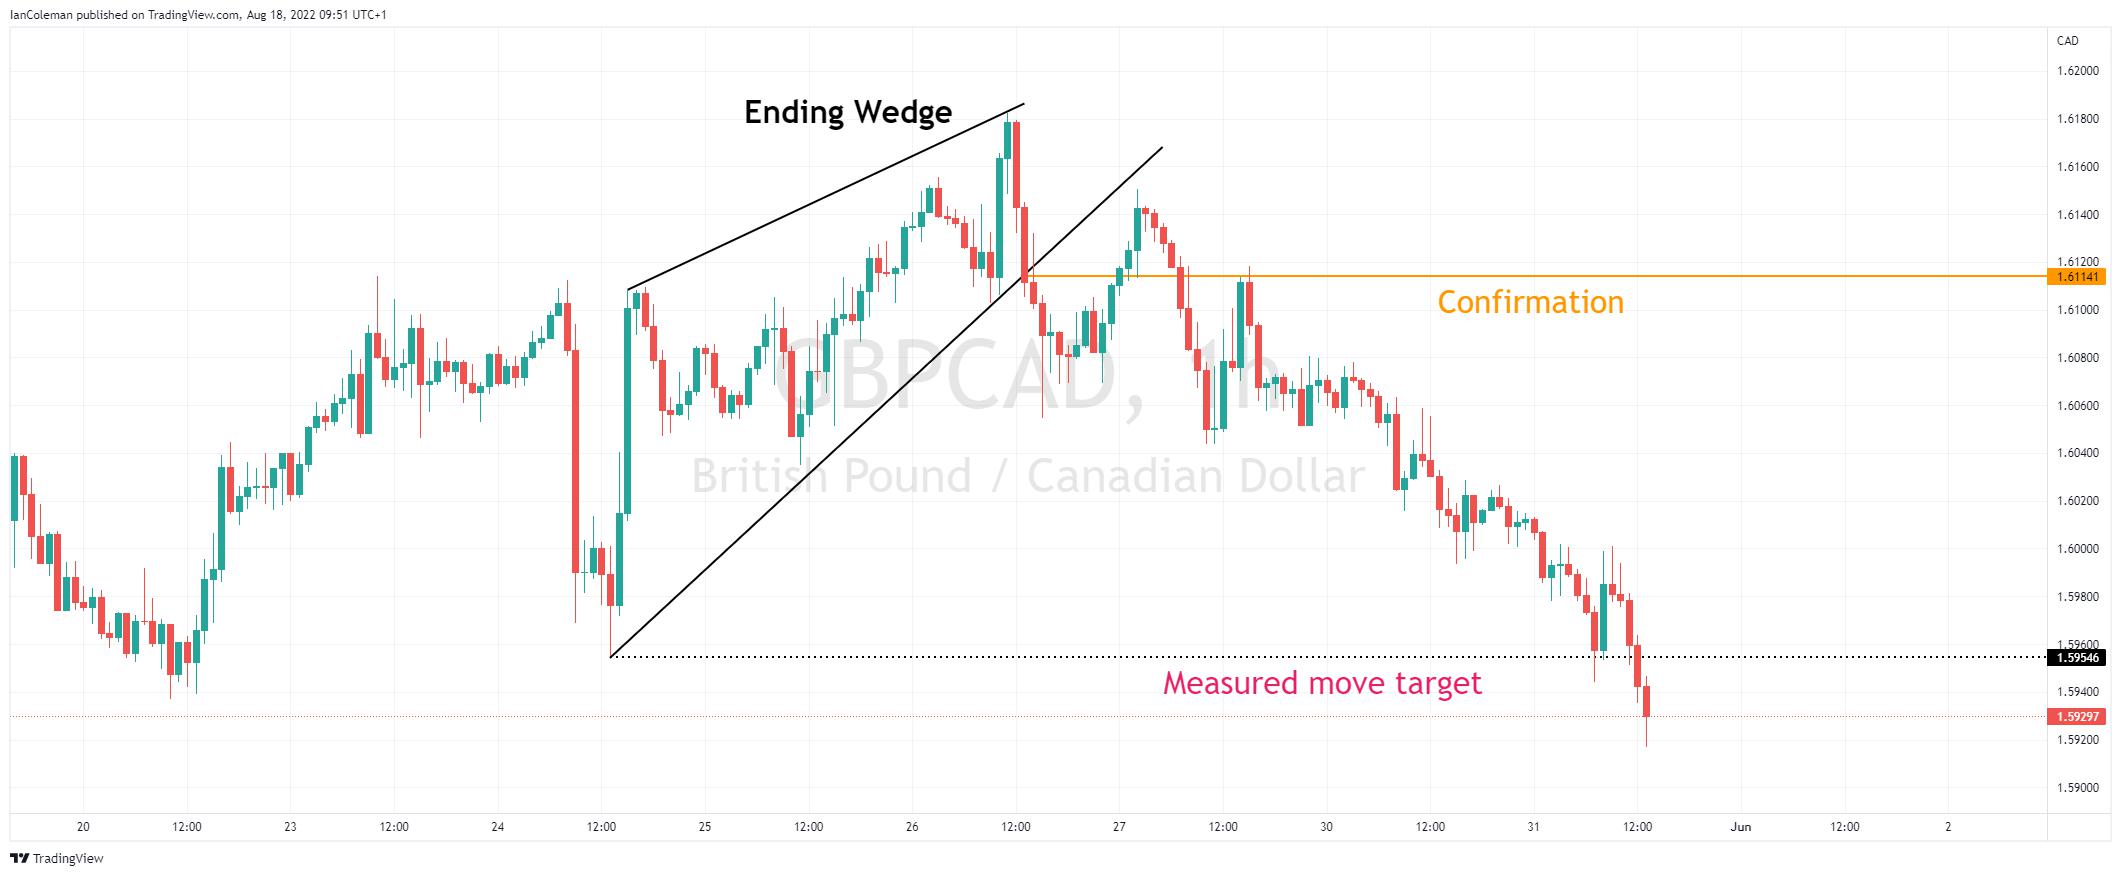
Figure 6 Trading View Ending Wedge confirmation
Continuation patterns
Channel
Trends move in waves. A downward trend forex pattern is highlighted as having lower highs and lower lows. By connecting three points from the swing highs forms a downward channel.
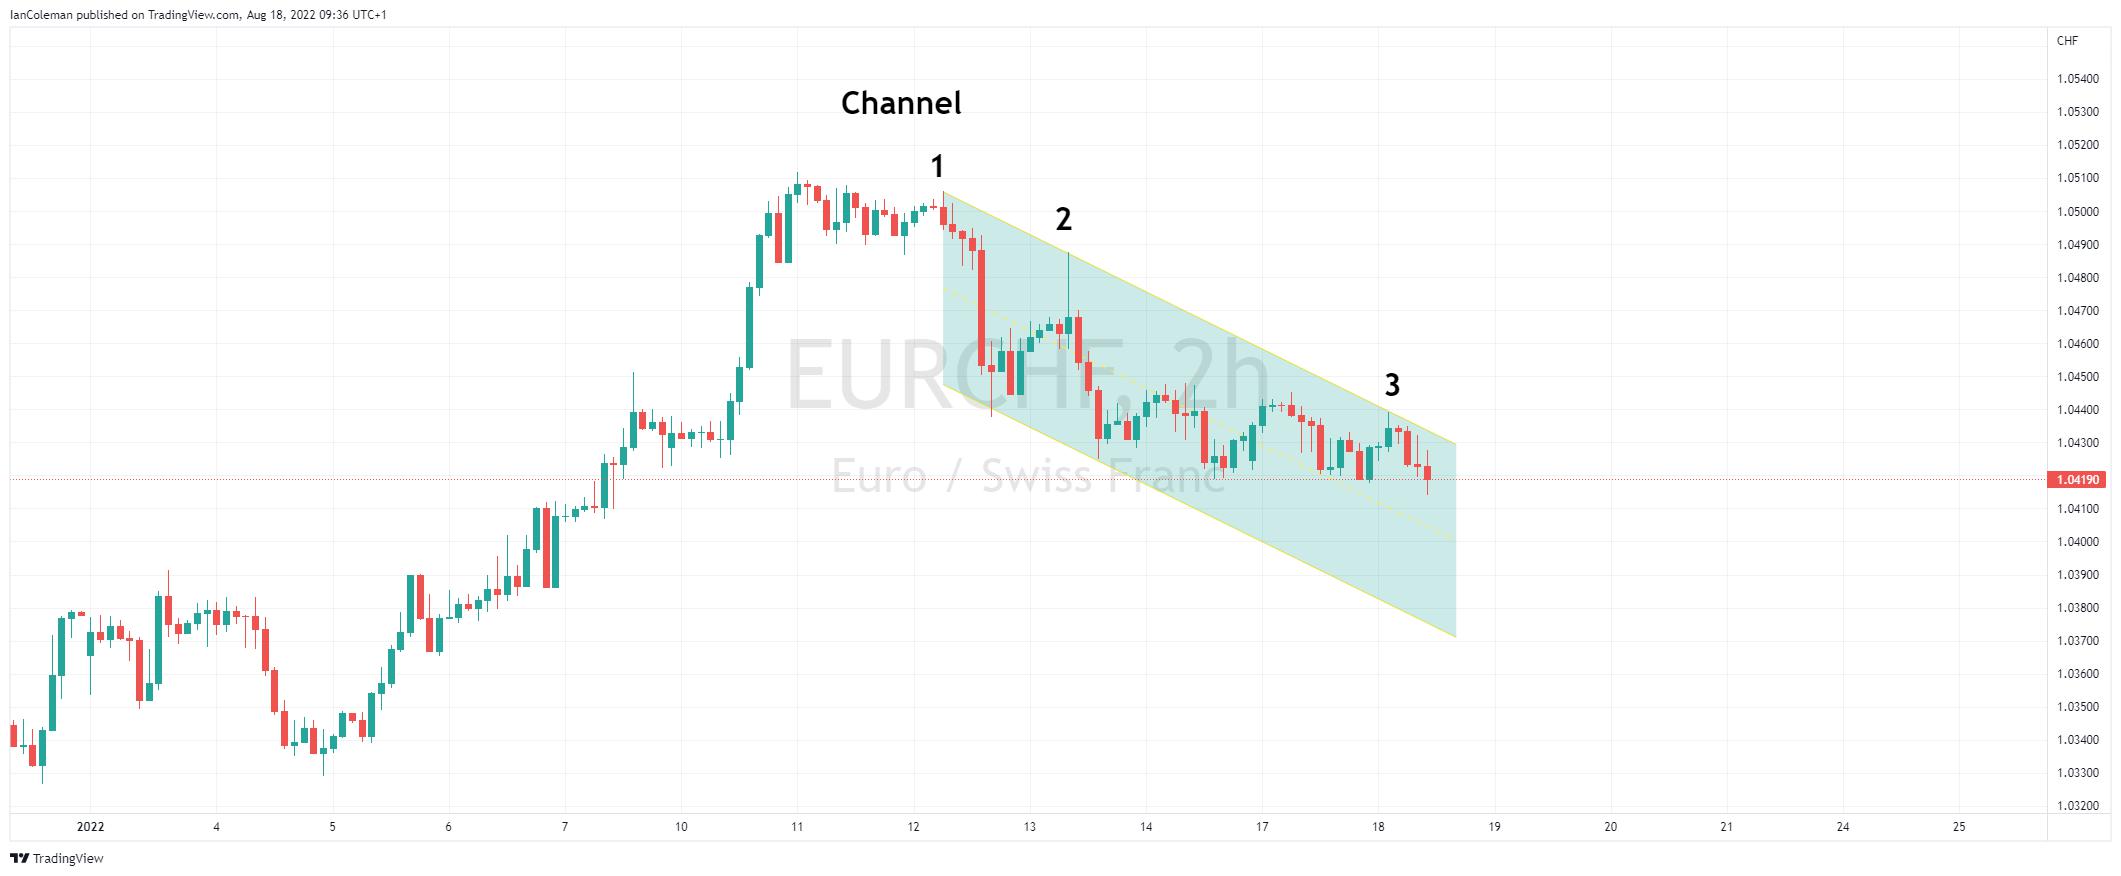
Figure 7 Trading View Channel
If the price action stays within the channel, the negative move continues. A breakout of the channel might suggest a change of trend.
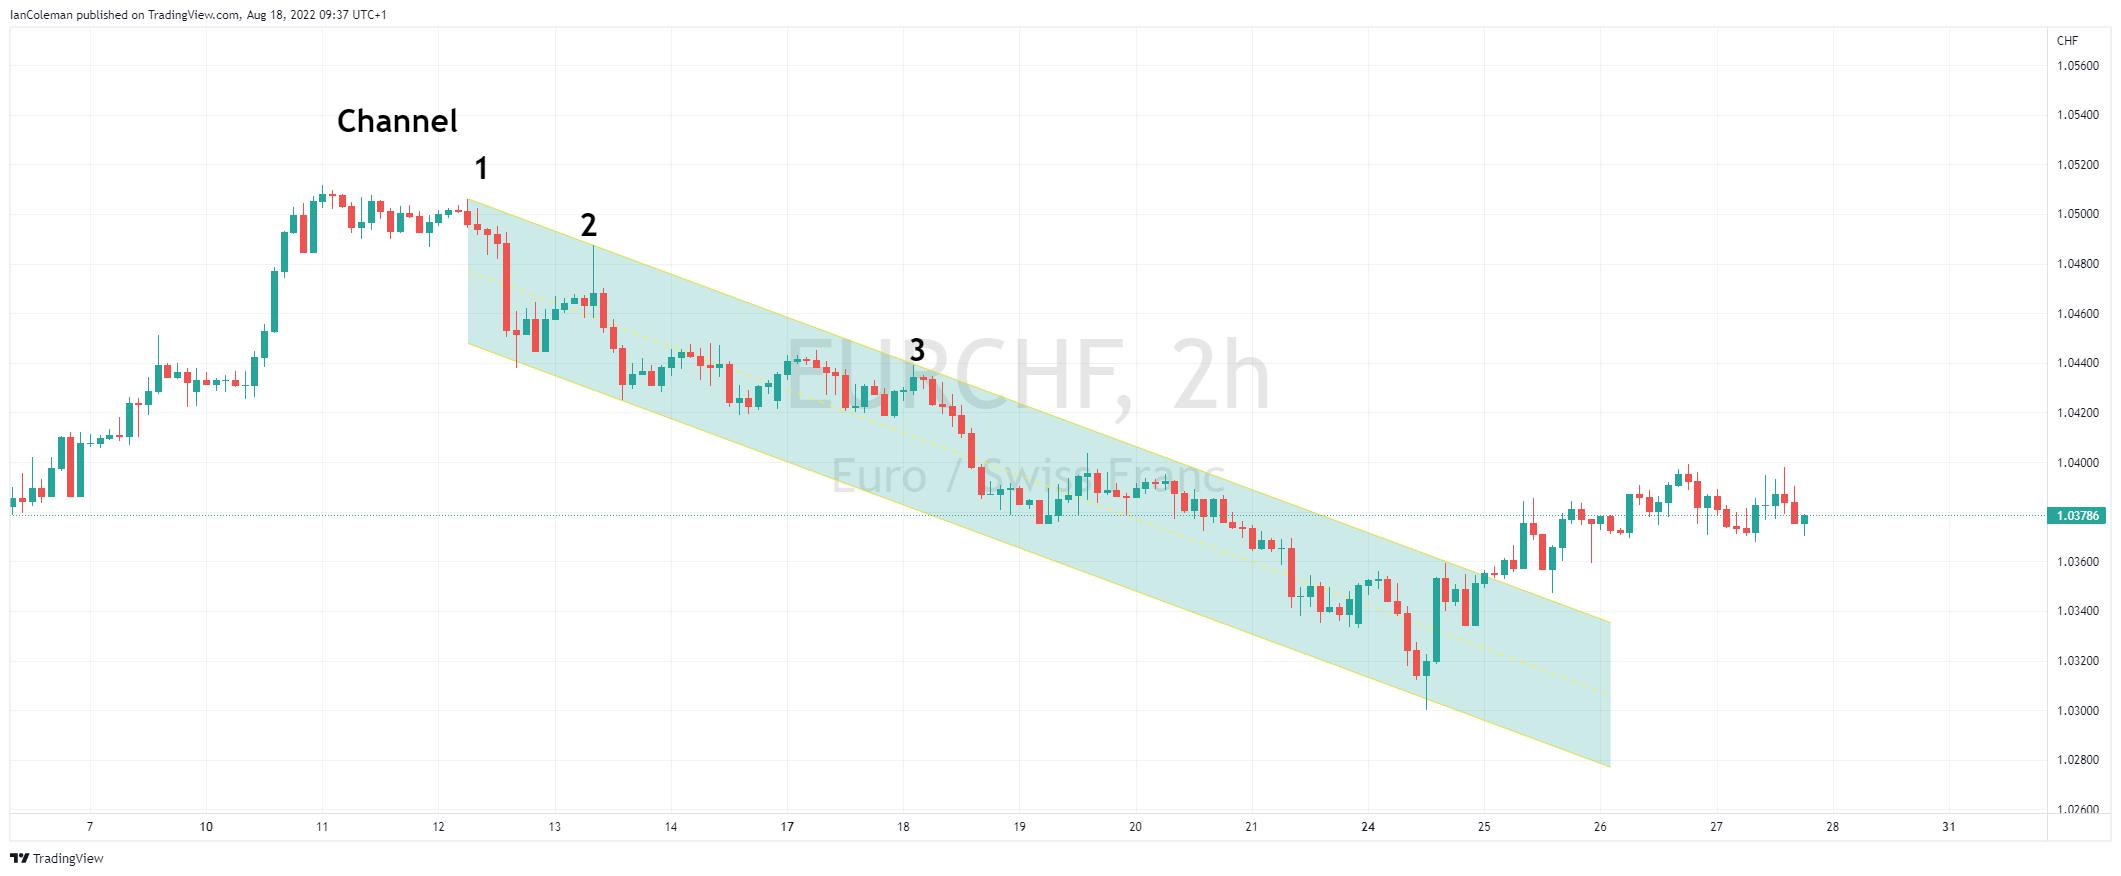
Figure 8 Trading View Channel continuation
Flag or Pennant
A flag or pennant forex pattern occurs when the market has moved aggressively to the downside. This forms the flagpole. We then get a period of consolidation in a sideways motion or mildly against the previous trend. This consolidating period forms the flag.
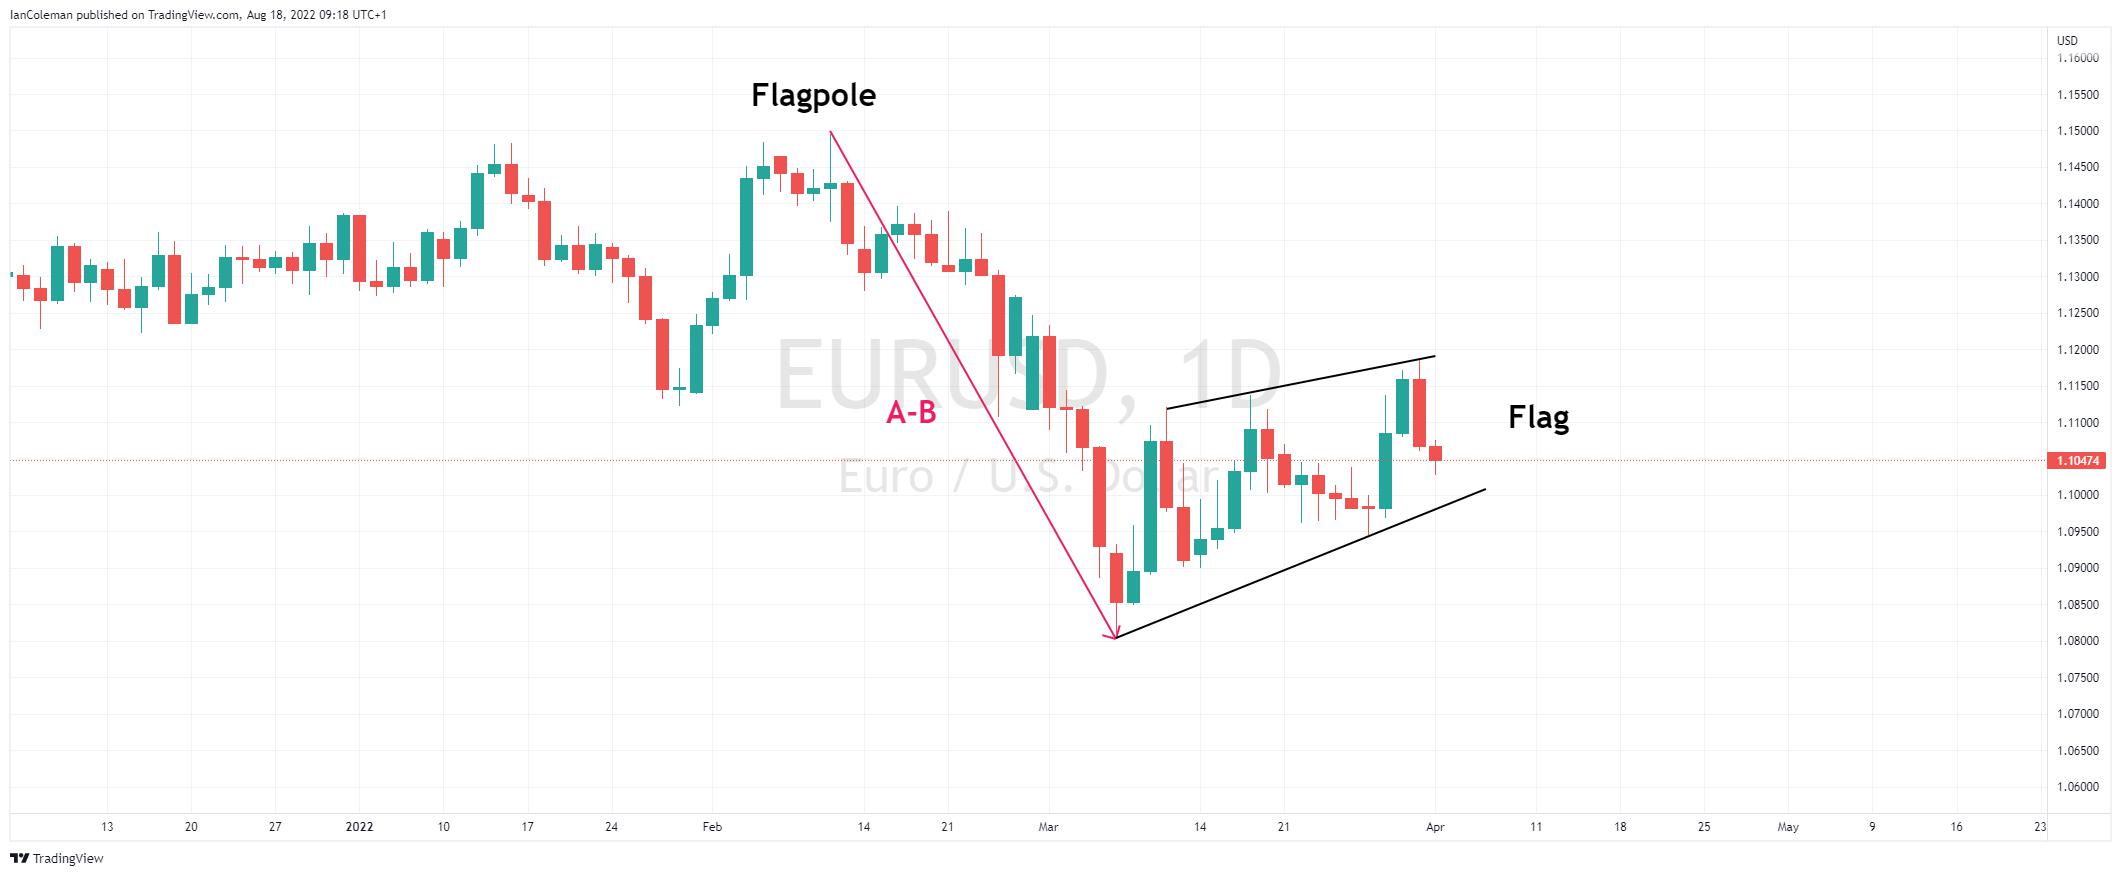
Figure 9 Trading View Flag
A breakout of the flag is needed to confirm the original trend is back underway. The measured move target is the length of the flagpole projected from the highest point of the flag.
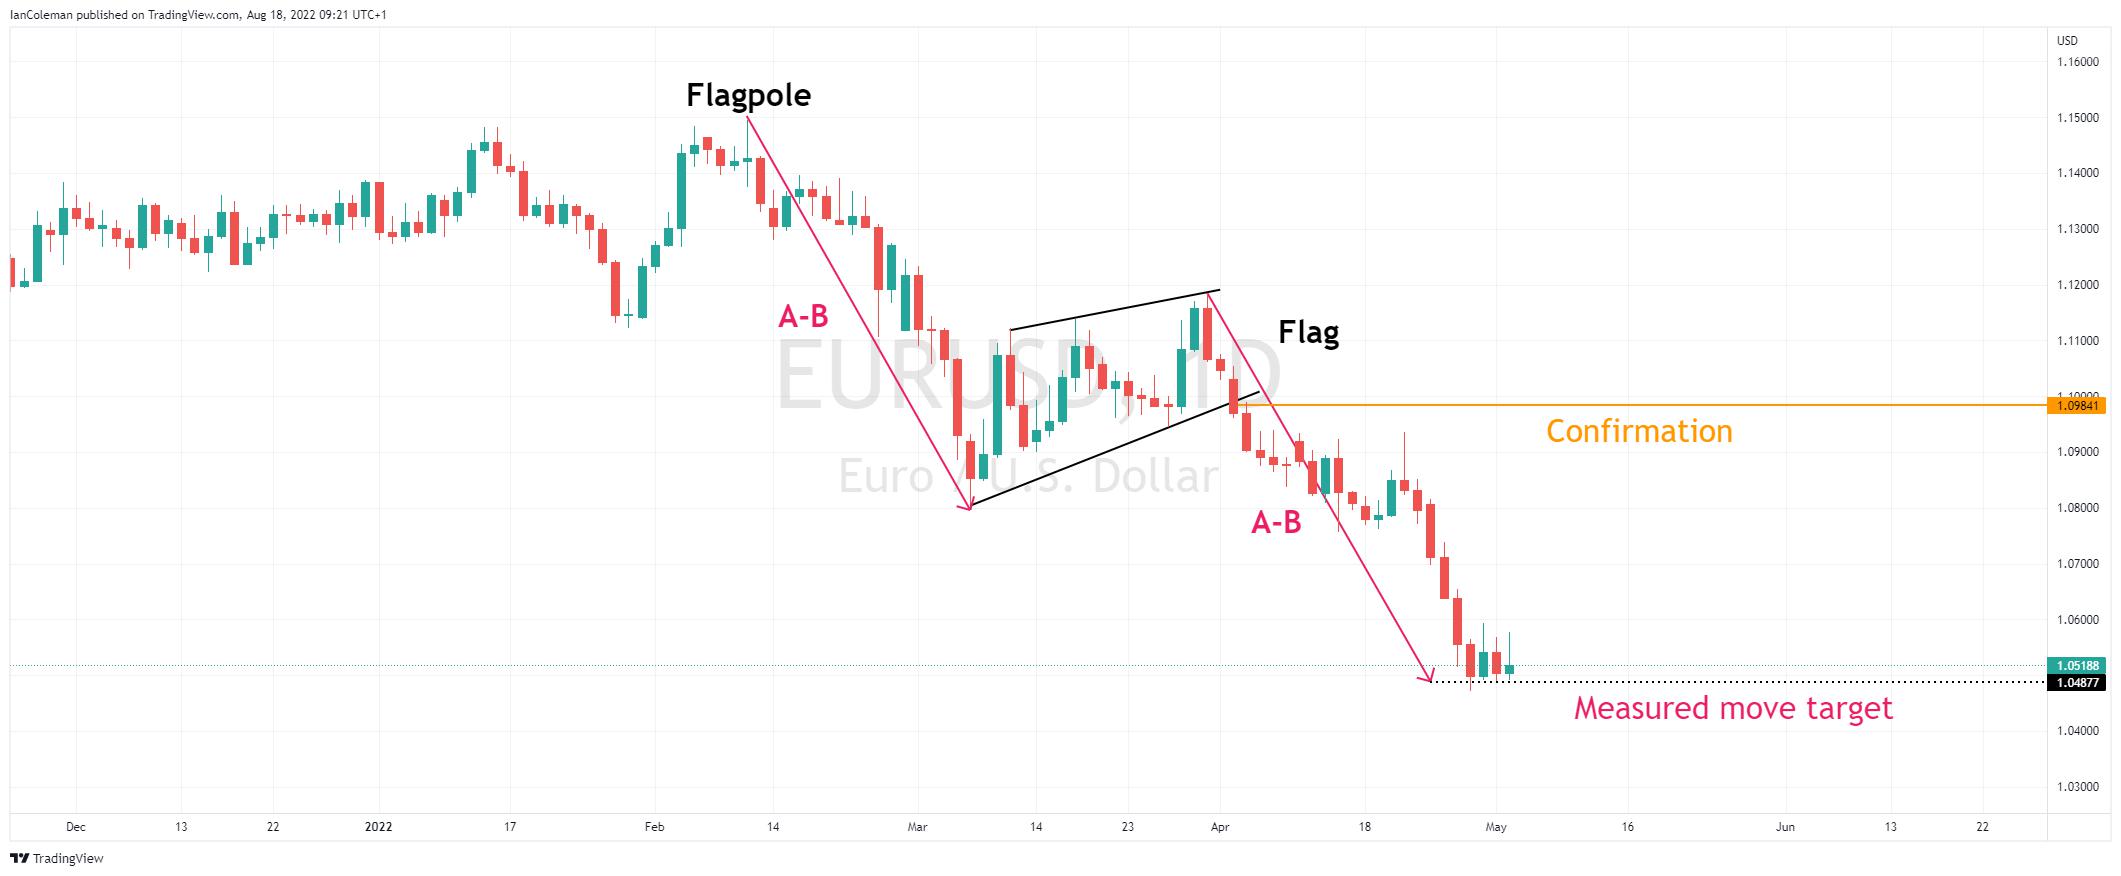
Figure 10 Trading View Flag confirmation
Triangle
A bearish triangle forex pattern occurs when the market hits a solid area of support. Sellers continue to emerge at lower levels. These lower highs form the side of the triangle.
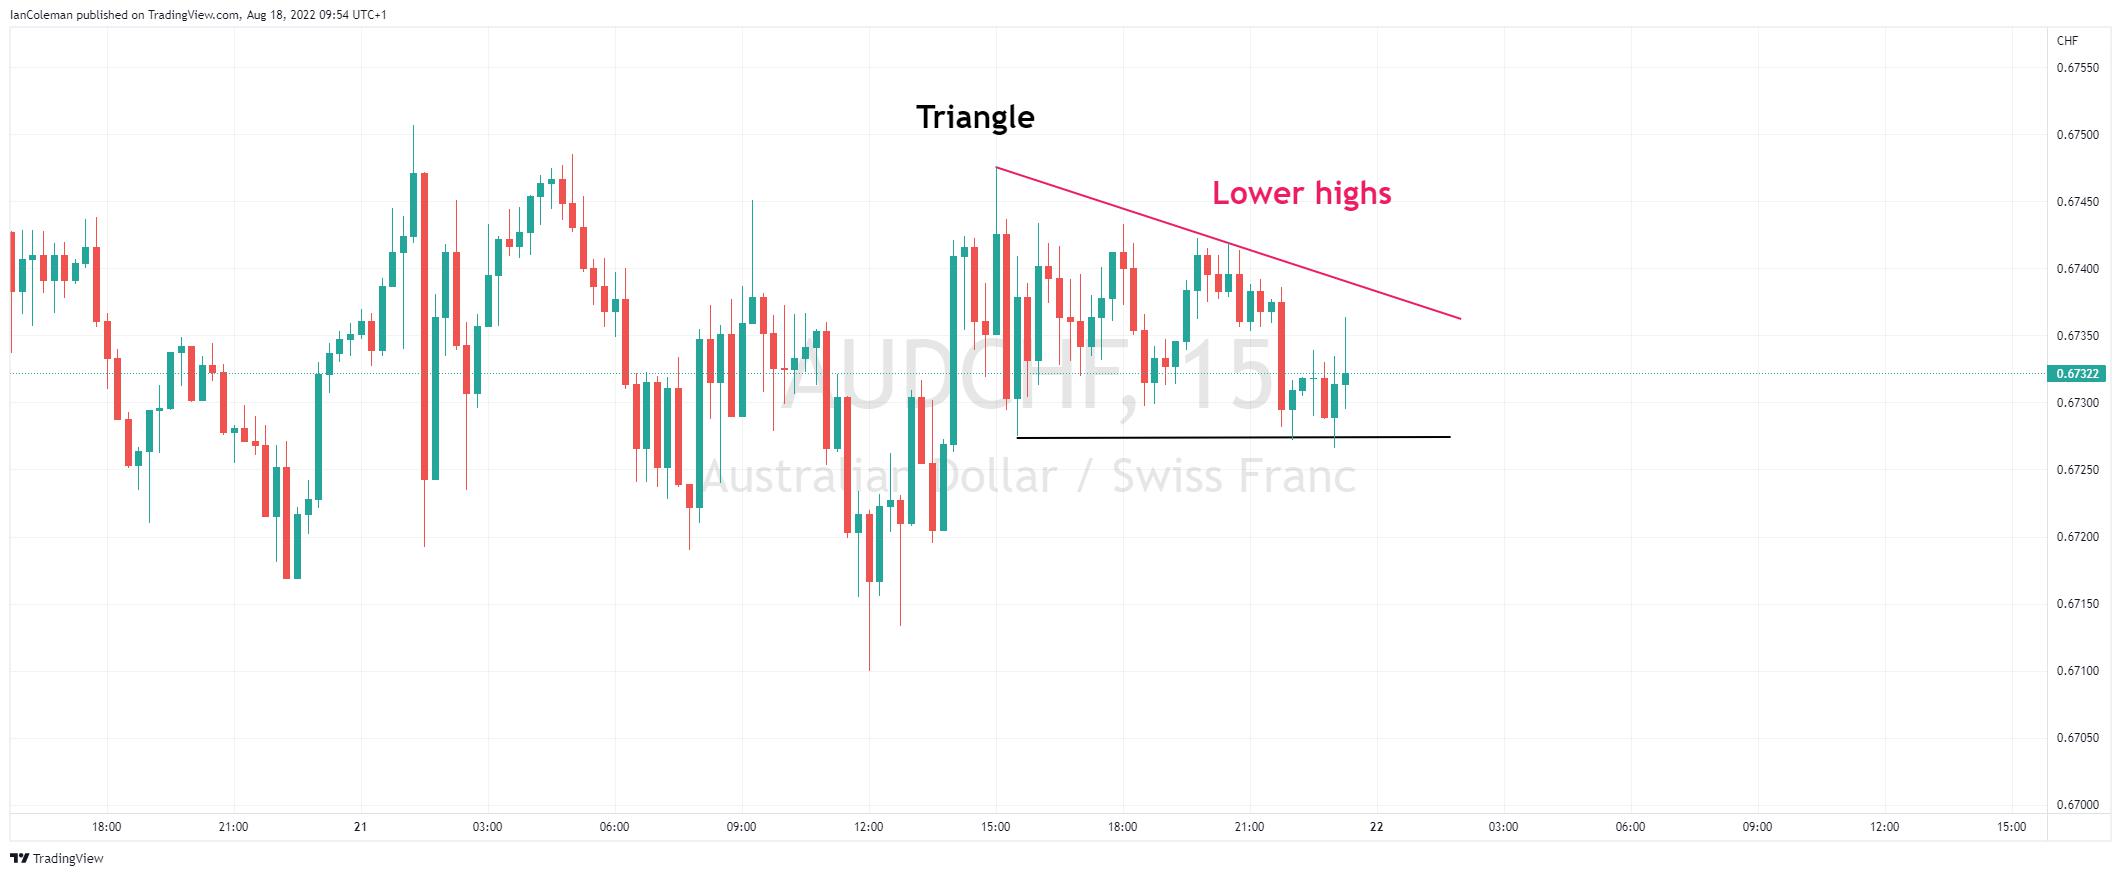
Figure 11 Trading View Triangle
A break of support and the measured move is calculated by taking the highest point of the triangle, to the support, and projecting this from the breakout level.
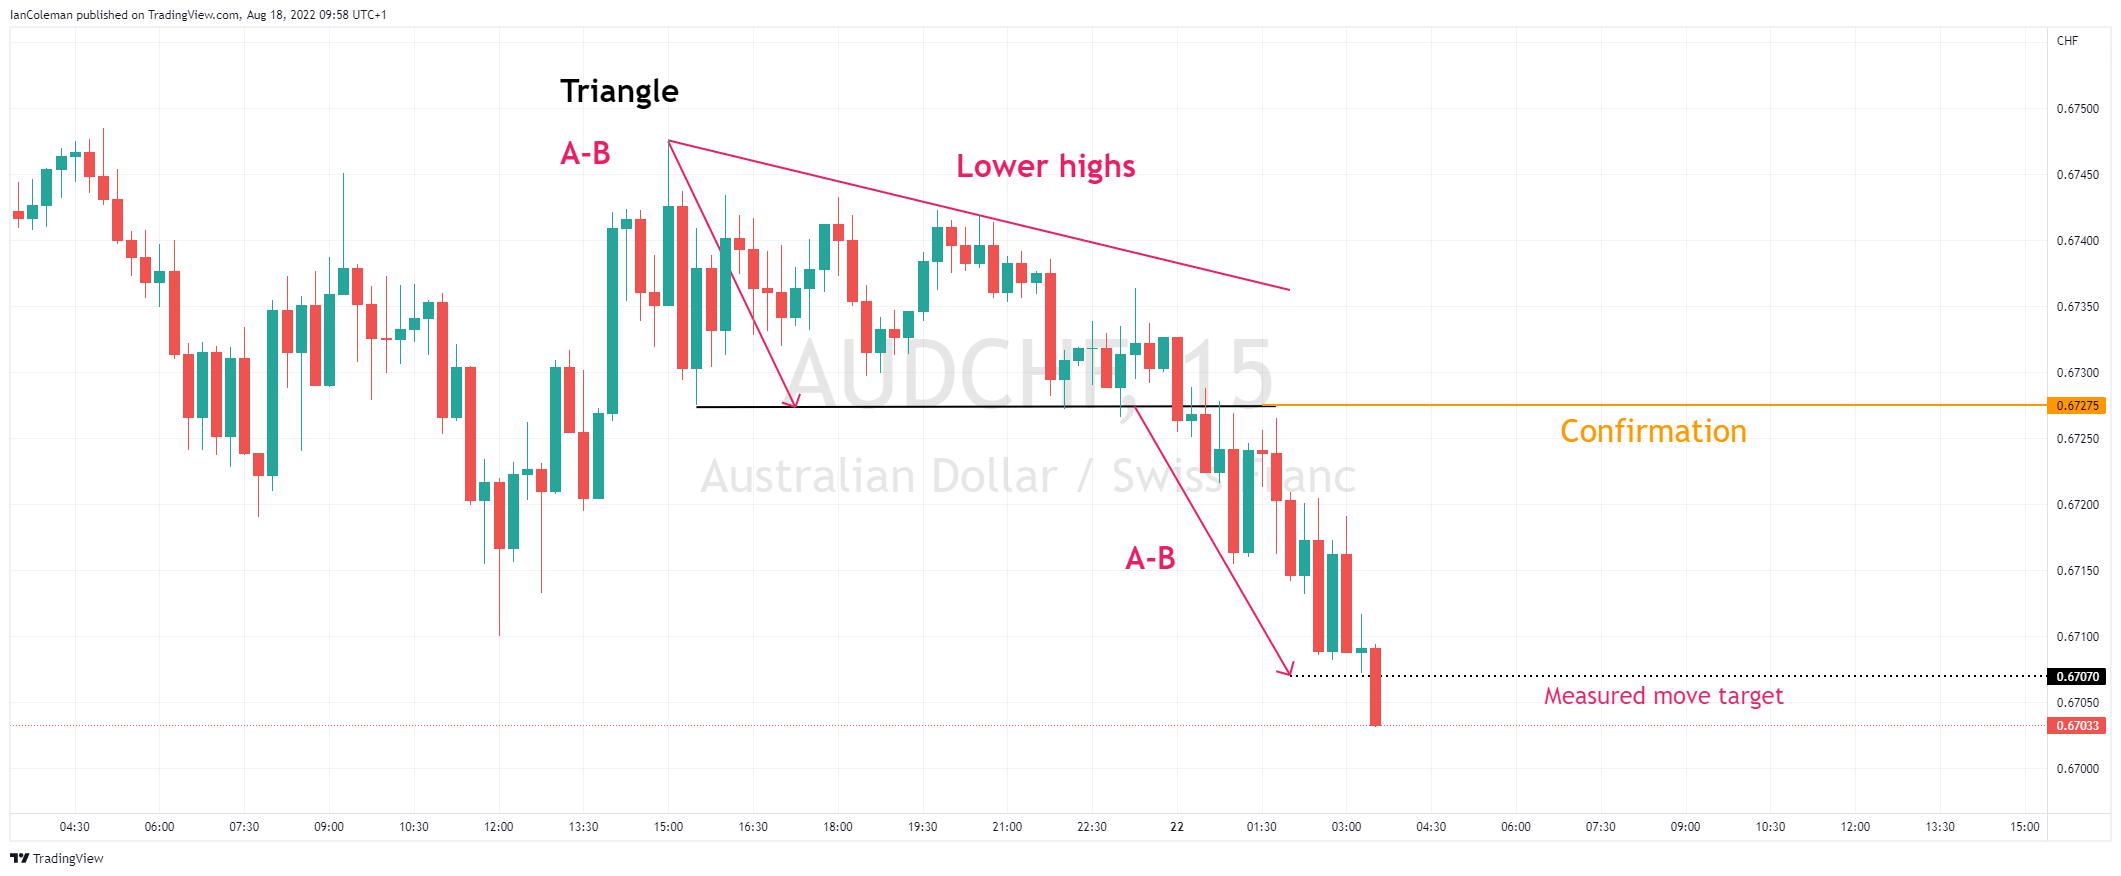
Figure 12 Trading View Triangle confirmation
Related articles


The material provided here has not been prepared in accordance with legal requirements designed to promote the independence of investment research and as such is considered to be a marketing communication. Whilst it is not subject to any prohibition on dealing ahead of the dissemination of investment research we will not seek to take any advantage before providing it to our clients.
Pepperstone doesn’t represent that the material provided here is accurate, current or complete, and therefore shouldn’t be relied upon as such. The information, whether from a third party or not, isn’t to be considered as a recommendation; or an offer to buy or sell; or the solicitation of an offer to buy or sell any security, financial product or instrument; or to participate in any particular trading strategy. It does not take into account readers’ financial situation or investment objectives. We advise any readers of this content to seek their own advice. Without the approval of Pepperstone, reproduction or redistribution of this information isn’t permitted.