Pepperstone logo
Pepperstone logo
  • English
  • 中文版
  • Ways to trade

    Pricing

    Trading accounts

    Pro

    Premium clients

    Refer a friend

    Active trader program

    Trading hours

    24-hour trading

    Maintenance schedule

  • Trading platforms

    Trading platforms

    TradingView

    Pepperstone platform

    MetaTrader 5

    MetaTrader 4

    cTrader

    Integrations

    Trading tools

  • Markets

    Markets to trade

    Forex

    Shares

    ETFs

    Indices

    Commodities

    Currency Indices

    Cryptocurrencies

    Dividends for index CFDs

    Dividends for share CFDs

    CFD forwards

  • Market analysis

    Market news

    Navigating Markets

    The Daily Fix

    Meet the analysts

  • Learn to trade

    Trading guides

    CFD trading

    Forex trading

    Commodity trading

    Stock trading

    Crypto trading

    Bitcoin trading

    Technical analysis

    Candlestick patterns

    Day trading

    Scalping trading

    Upcoming IPOs

    Gold trading

    Oil trading

    Webinars

  • Pepperstone Pro

  • Partners

  • About us

  • Help and support

  • English
  • 中文版

Learn to trade

Trading

Performance review on Naspers' share price

Pepperstone
Pepperstone
Trading Guides
6 Sept 2022
Share

Some basic information about Naspers

Naspers is a global internet group and one the largest technology investors in the world. Naspers share price is quoted and traded on the Johannesburg Stock Exchange. Stock market ticker NPN.

Naspers is a popular traded stock in the South African region.

The rise and fall of Naspers share price

Like a lot of technology stocks, Naspers share price outperformed during the COVID-19 lockdown period with the stock reaching a high of 388800 in January 2021.  This was driven by consumers being locked down and craving digital first technology for entertainment.

So why the decline? Is this selloff a broad-based decline in technology stock or is Naspers share price taking the brunt of the fall?

A look from a technical perspective  

The MSCI World Information Technology Index tracks large and mid-cap technology companies’ performance from 23 developed markets (orange line). Although this broader technology index started its decline later, in October 2021, there is clear a correlation with Naspers share price. Technology stocks have seen a small period of increased value over the last few months.

Preview

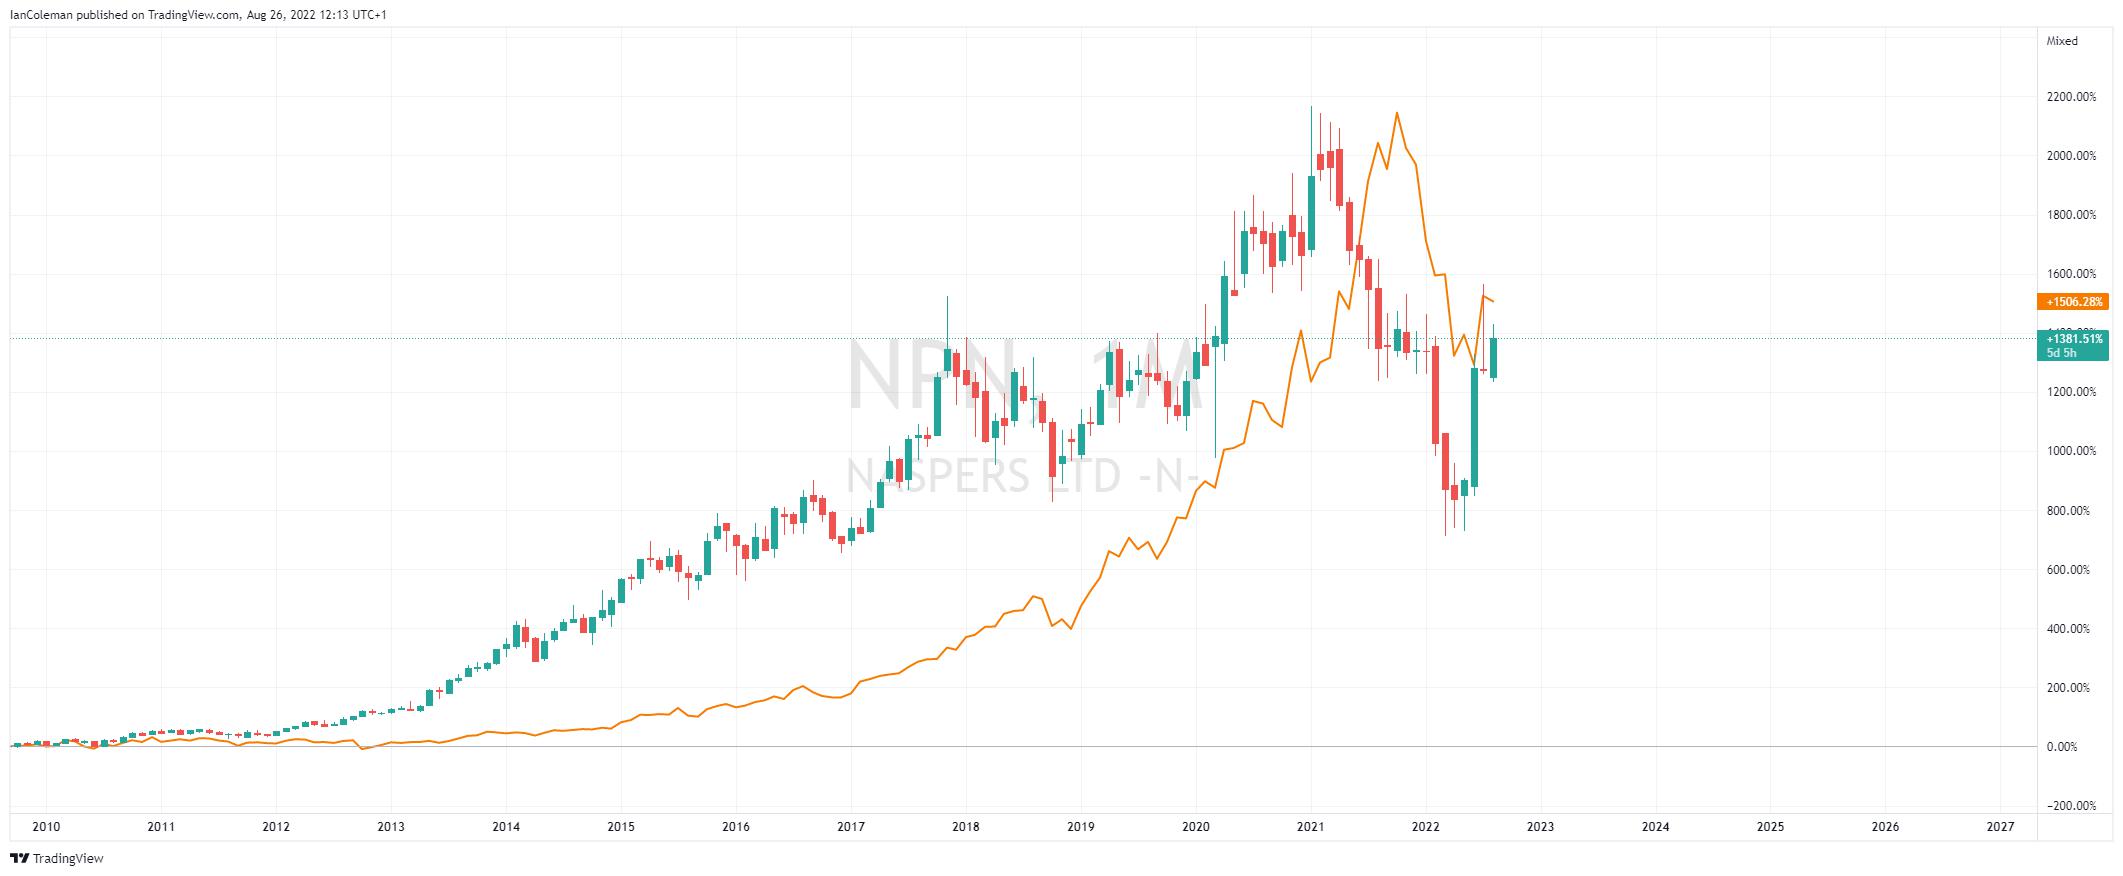
Figure 1 Trading View NPN versus MSCI

NPN weekly price chart

After the initial selloff from January to August 2021, NPN share price saw a period of consolidation. From a technical analysis approach, this could be seen as a bearish flag formation. A break of the trend channel low, on the week 14th February, fell short of achieving its measure move target of 121100.

Preview

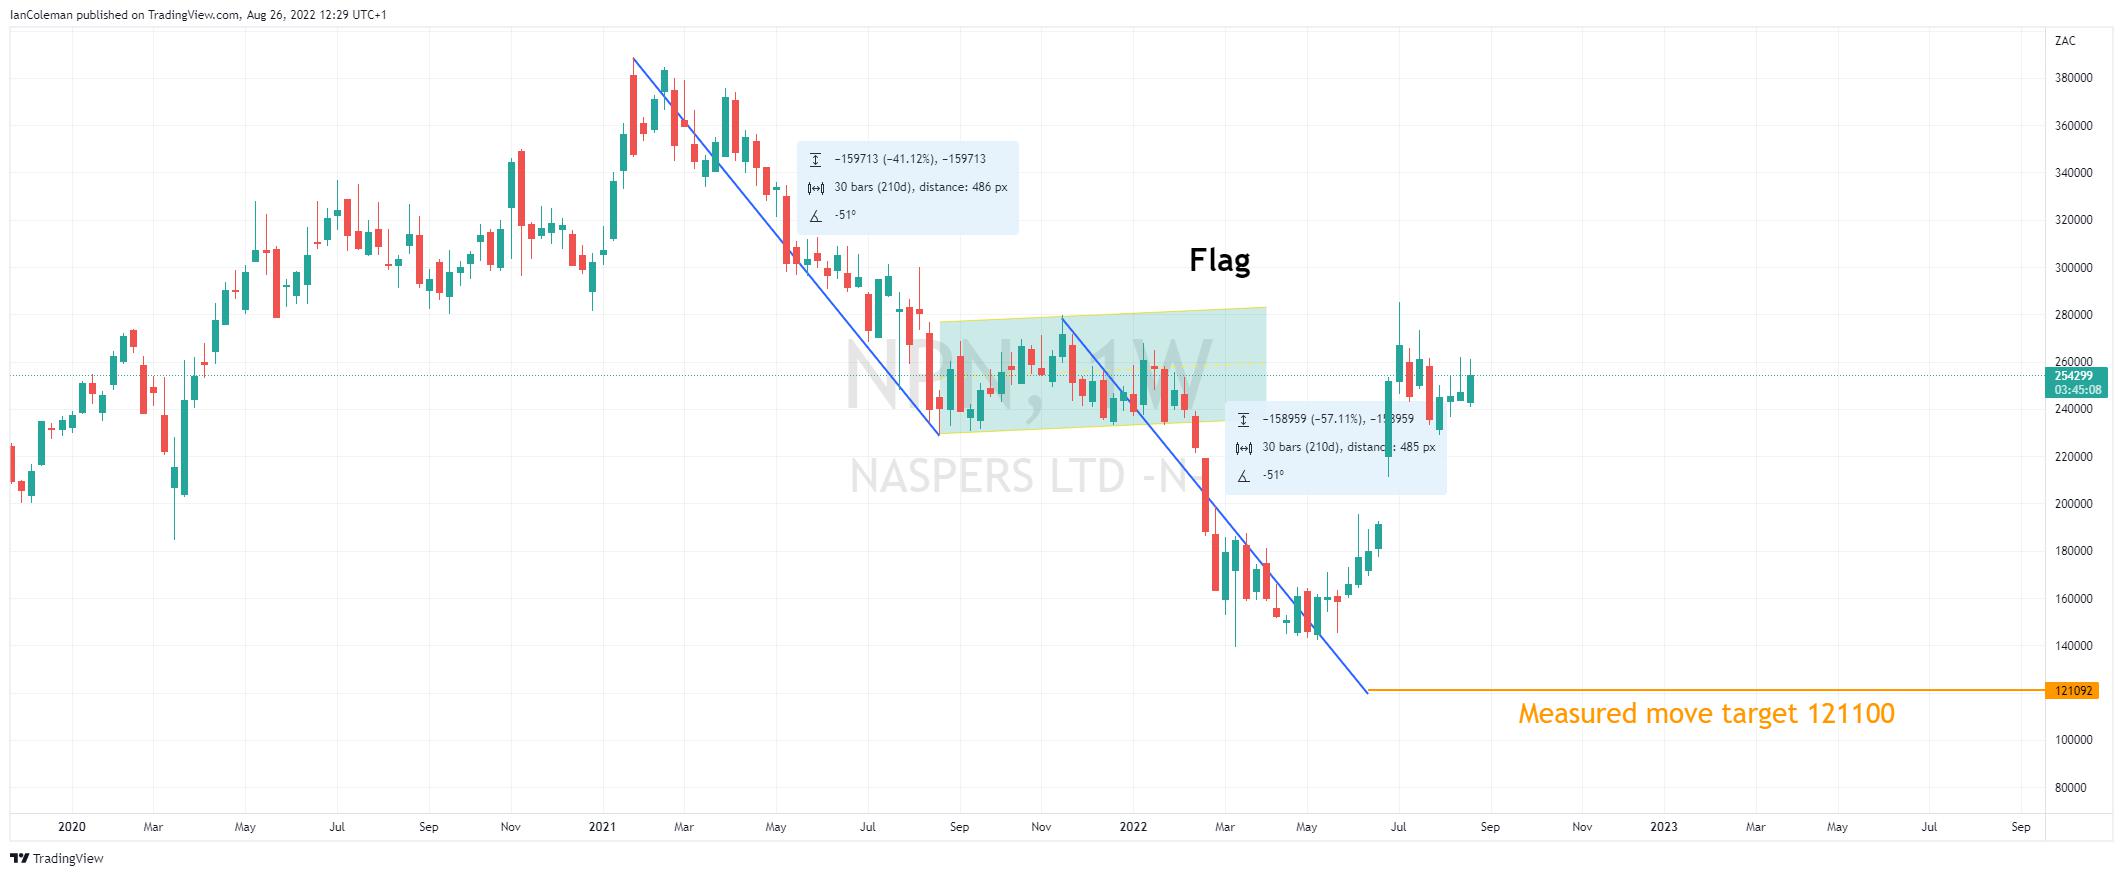
Figure 2 Trading View NPN Flag formation

NPN daily price chart

A surprise Earnings Report on the 27th of June resulted in a jump in the NPN share price from 191276 to 244500, leaving a gap or window open. Gaps and windows tend to be closed.

Preview

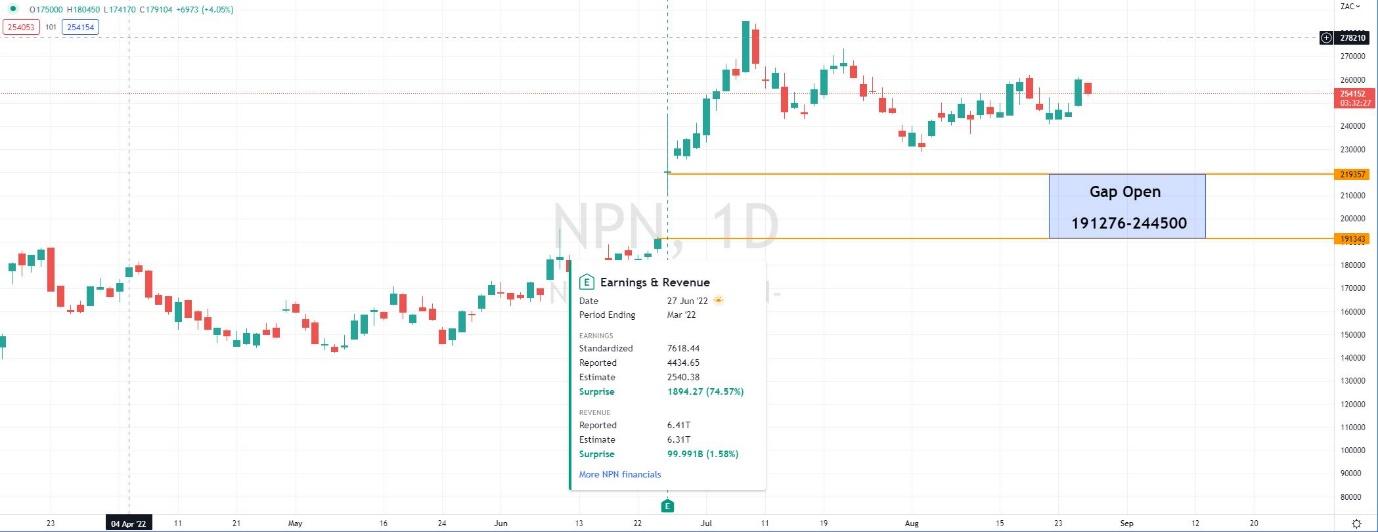
Figure 2 Trading View NPN Earnings report gap open

NPN monthly price chart

The strong upward move on the week 1st of June has resulted in Marabuzo support at 202435. This is a technical support level taken from the middle of a strong bullish or bearish candle. This area has been pivotal in 2017 and 2019. It should also be noted that the area is central with regards to the gap/window left open.

Preview

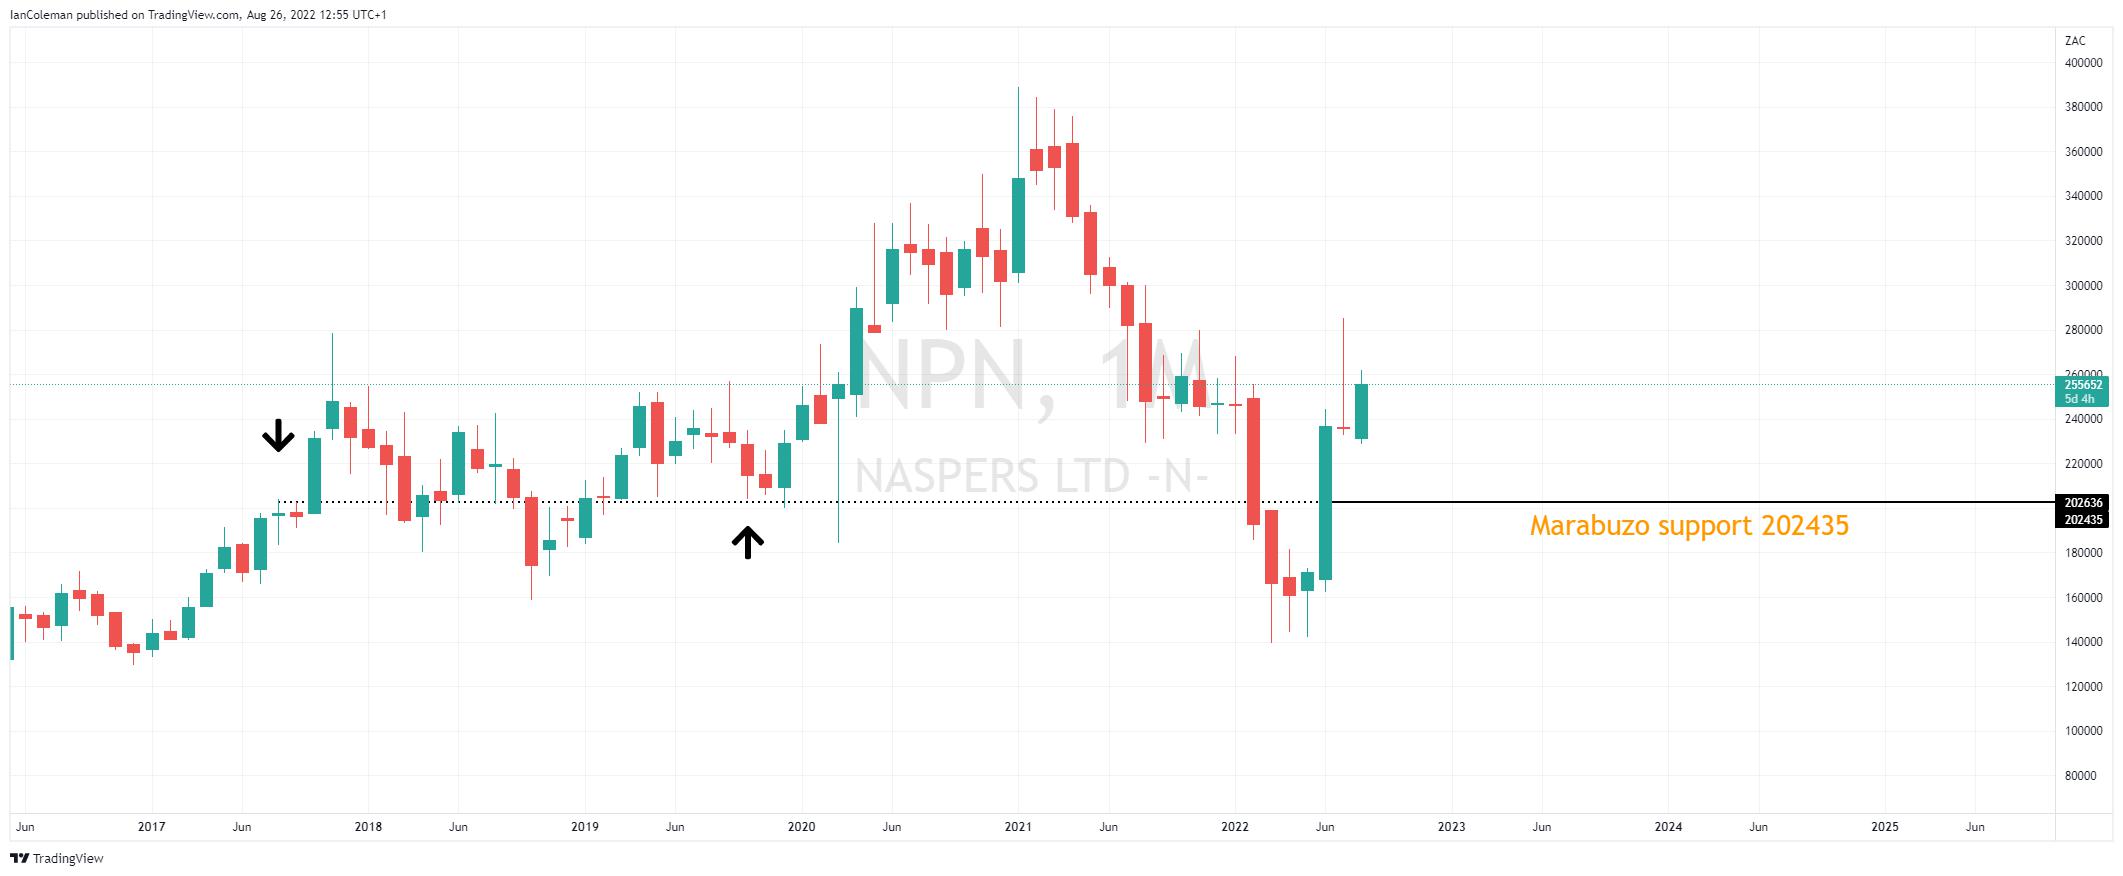
Figure 2 Trading View NPN Marabuzo support

For more information on technical analysis, click on the following link.


Related articles

How did Facebook stock perform in 2022?

How did Facebook stock perform in 2022?

Trading
What is cryptocurrency trading and how does it work?

What is cryptocurrency trading and how does it work?

Trading
Crypto

The material provided here has not been prepared in accordance with legal requirements designed to promote the independence of investment research and as such is considered to be a marketing communication. Whilst it is not subject to any prohibition on dealing ahead of the dissemination of investment research we will not seek to take any advantage before providing it to our clients.

Pepperstone doesn’t represent that the material provided here is accurate, current or complete, and therefore shouldn’t be relied upon as such. The information, whether from a third party or not, isn’t to be considered as a recommendation; or an offer to buy or sell; or the solicitation of an offer to buy or sell any security, financial product or instrument; or to participate in any particular trading strategy. It does not take into account readers’ financial situation or investment objectives. We advise any readers of this content to seek their own advice. Without the approval of Pepperstone, reproduction or redistribution of this information isn’t permitted.

Other sites

  • The Trade Off
  • Partners
  • Group
  • Careers

Ways to trade

  • Pricing
  • Trading accounts
  • Pro
  • Premium Clients
  • Active Trader program
  • Refer a friend
  • Trading hours

Platforms

  • Trading Platforms
  • Trading tools

Markets & Symbols

  • Forex
  • Shares
  • ETFs
  • Indices
  • Commodities
  • Currency indices
  • Cryptocurrencies
  • CFD Forwards

Analysis

  • Navigating Markets
  • The Daily Fix
  • Pepperstone Pulse
  • Meet the analysts

Learn to Trade

  • Trading Guides
  • Videos
  • Webinars
Pepperstone logo
support@pepperstone.com
1300 033 375
Level 16, Tower One, 727 Colins Street
Melbourne, VIC Australia 3008
  • Legal documents
  • Privacy policy
  • Website terms and conditions
  • Cookie policy
  • Whistleblower Policy

© 2025 Pepperstone Group Limited

Risk Warning: Trading CFDs and FX is risky. It isn't suitable for everyone and if you are a professional client, you could lose substantially more than your initial investment. You don't own or have rights in the underlying assets. Past performance is no indication of future performance and tax laws are subject to change. The information on this website is general in nature and doesn't take into account your personal objectives, financial circumstances, or needs. You should consider whether you’re part of our target market by reviewing our TMD, and read our PDS and other legal documents to ensure you fully understand the risks before you make any trading decisions. We encourage you to seek independent advice if necessary.

Pepperstone Group Limited is located at Level 16, Tower One, 727 Collins Street, Melbourne, VIC 3008, Australia and is licensed and regulated by the Australian Securities and Investments Commission.

The information on this site and the products and services offered are not intended for distribution to any person in any country or jurisdiction where such distribution or use would be contrary to local law or regulation.

© 2024 Pepperstone Group Limited | ACN 147 055 703 | AFSL No.414530