- English
- 中文版
Learn to trade
Some basic information about Capitec
Capitec Bank, short code CPI, is the third largest bank by market cap in South Africa. We will look to review the Capitec share price from a fundamental and technical standpoint.
Combining the quote from Leonardo da Vinci, the bank uses the strapline ‘When it comes to banking, simplicity is the ultimate sophistication.
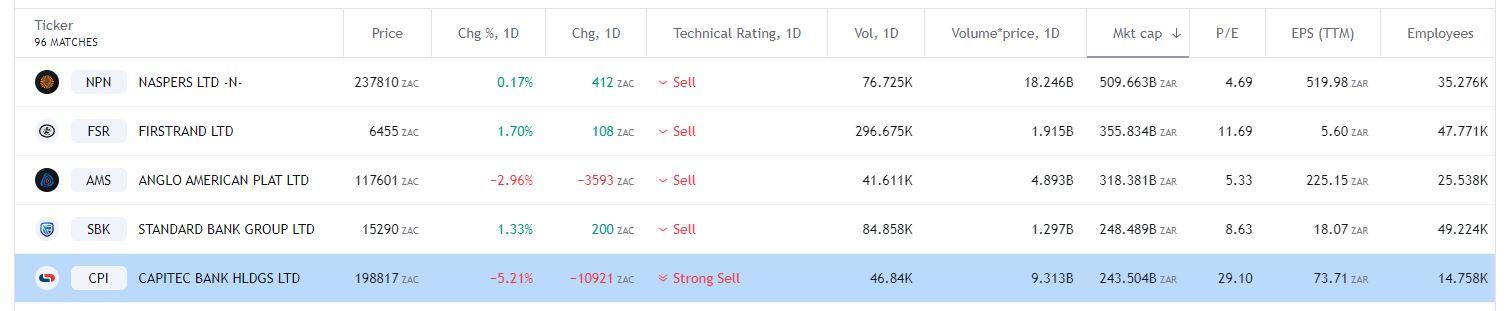
Figure 1 Trading View South Africa Market Cap 08/09/2022
The rise of Capitec share price
The bank share price has witnessed an extremely strong performance, increasing in value by 343% from the March 2020 low of 53986 to the high of 239273 in April 2022. This is despite falling short of earnings expectations in four of the last five reports*. The next earnings and revenue review is due on the 29thSeptember 2022.
It should be noted that the bank'sperformance is broadly in line with the South African Banking sector.
Capitec Share Price Monthly Chart
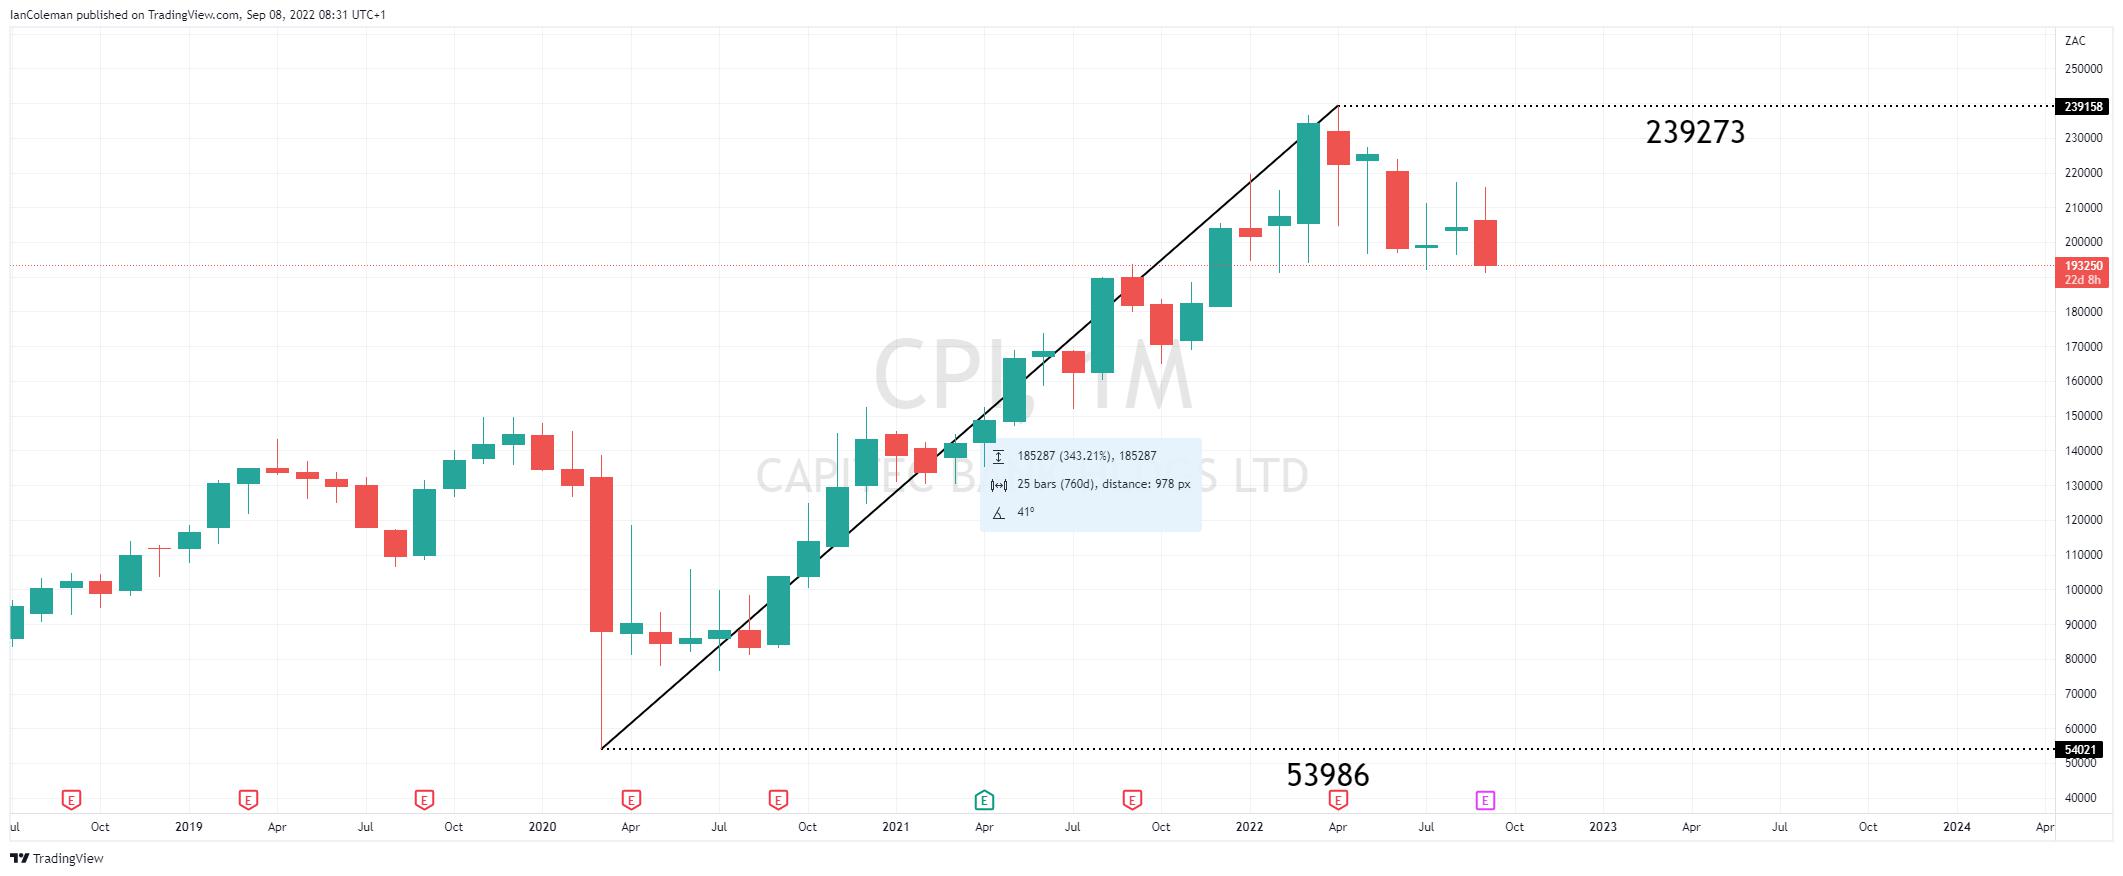
Figure 2 Trading View CPI shares and earnings
*Please note on the Trading View Chart the Red and Green E. This stands for earnings. Red falls short of expectations, green is higher than expectations.
A look from a technical perspective
There are technical warning signs that a top could be in place for the Capitec share price. Let us break down the charts.
Let us first discuss the rally from an Elliott Wave perspective. The Elliott Wave theory looks for a 5-wave move in one direction, followed by a corrective 3-wave move in the opposite direction.
In the first chart we can clearly see a 5-wave pattern stalling close to the 261.8% extension level of 222582 (from 53986 to 118431). This would suggest that a correction lower is underway.
Capitec Share Price Weekly Chart
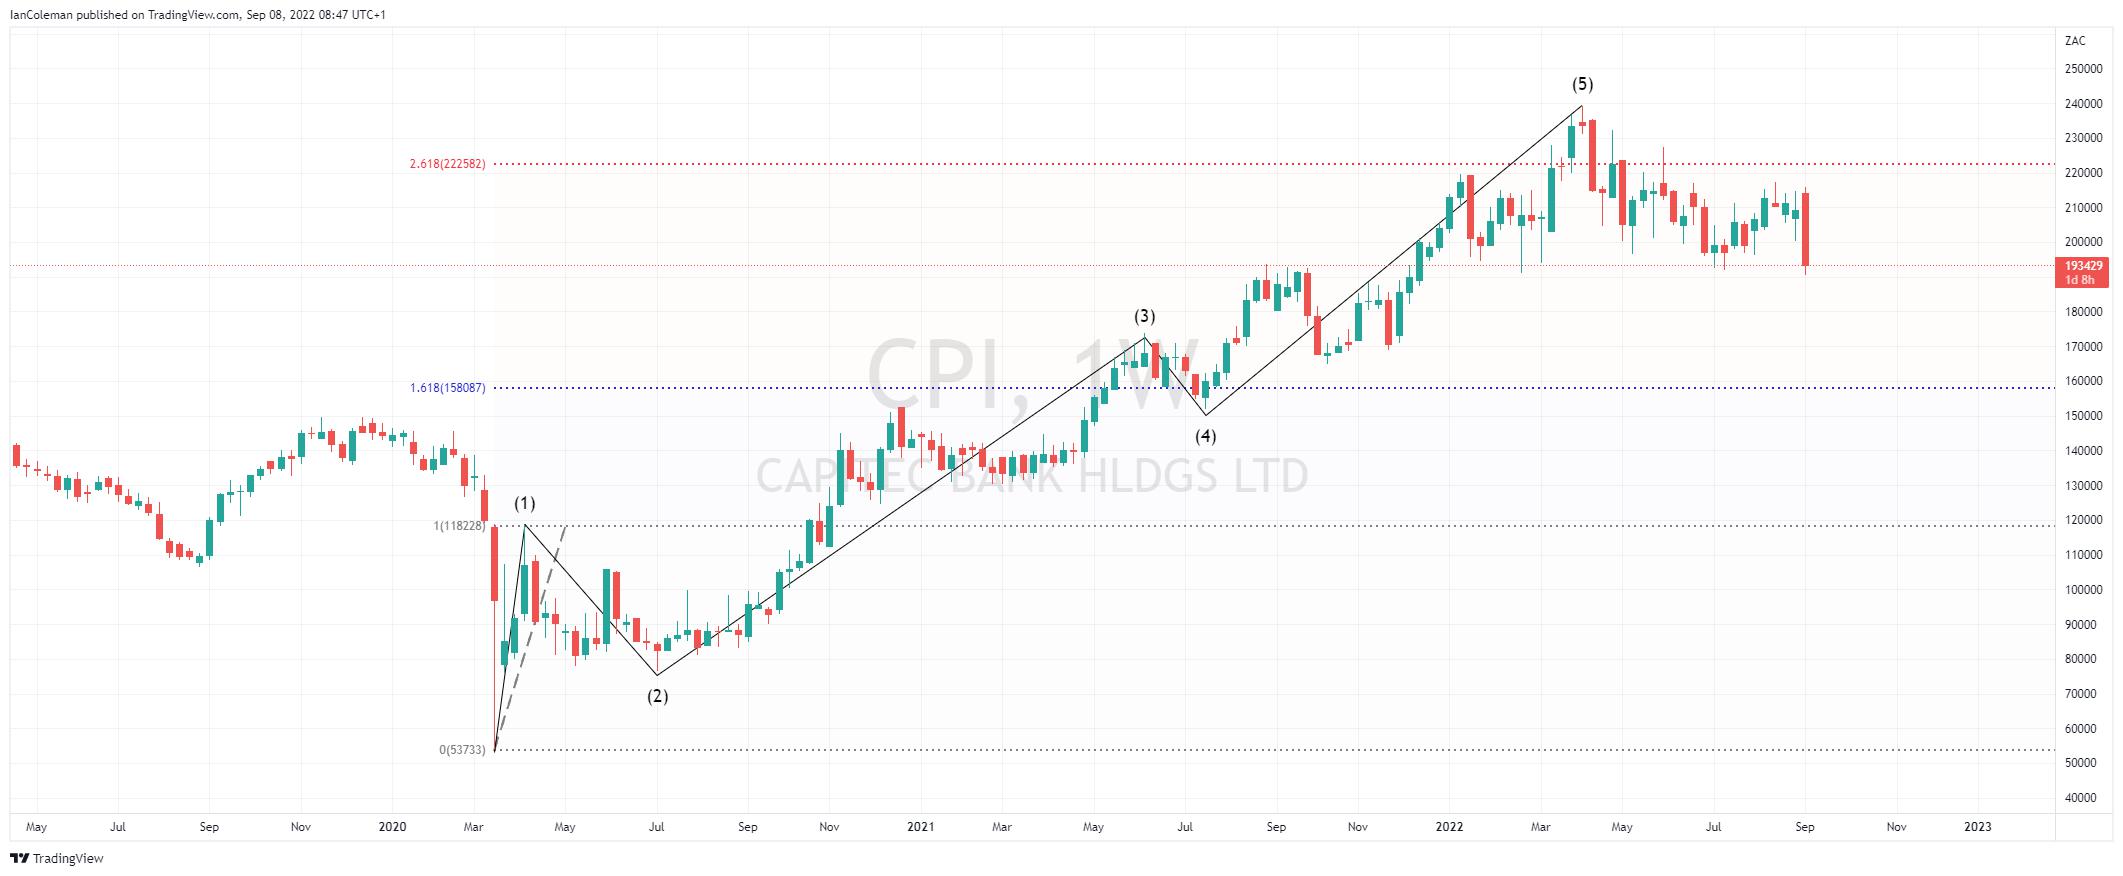
Figure 3 Trading View CPI share Elliott Wave
If we look closer to the chart, we can see a topping formation. This is a three-candle formation known as an Evening Doji Star.
This completed after the last report, with earnings falling short by -2.24%.
Capitec Share Price Weekly Chart
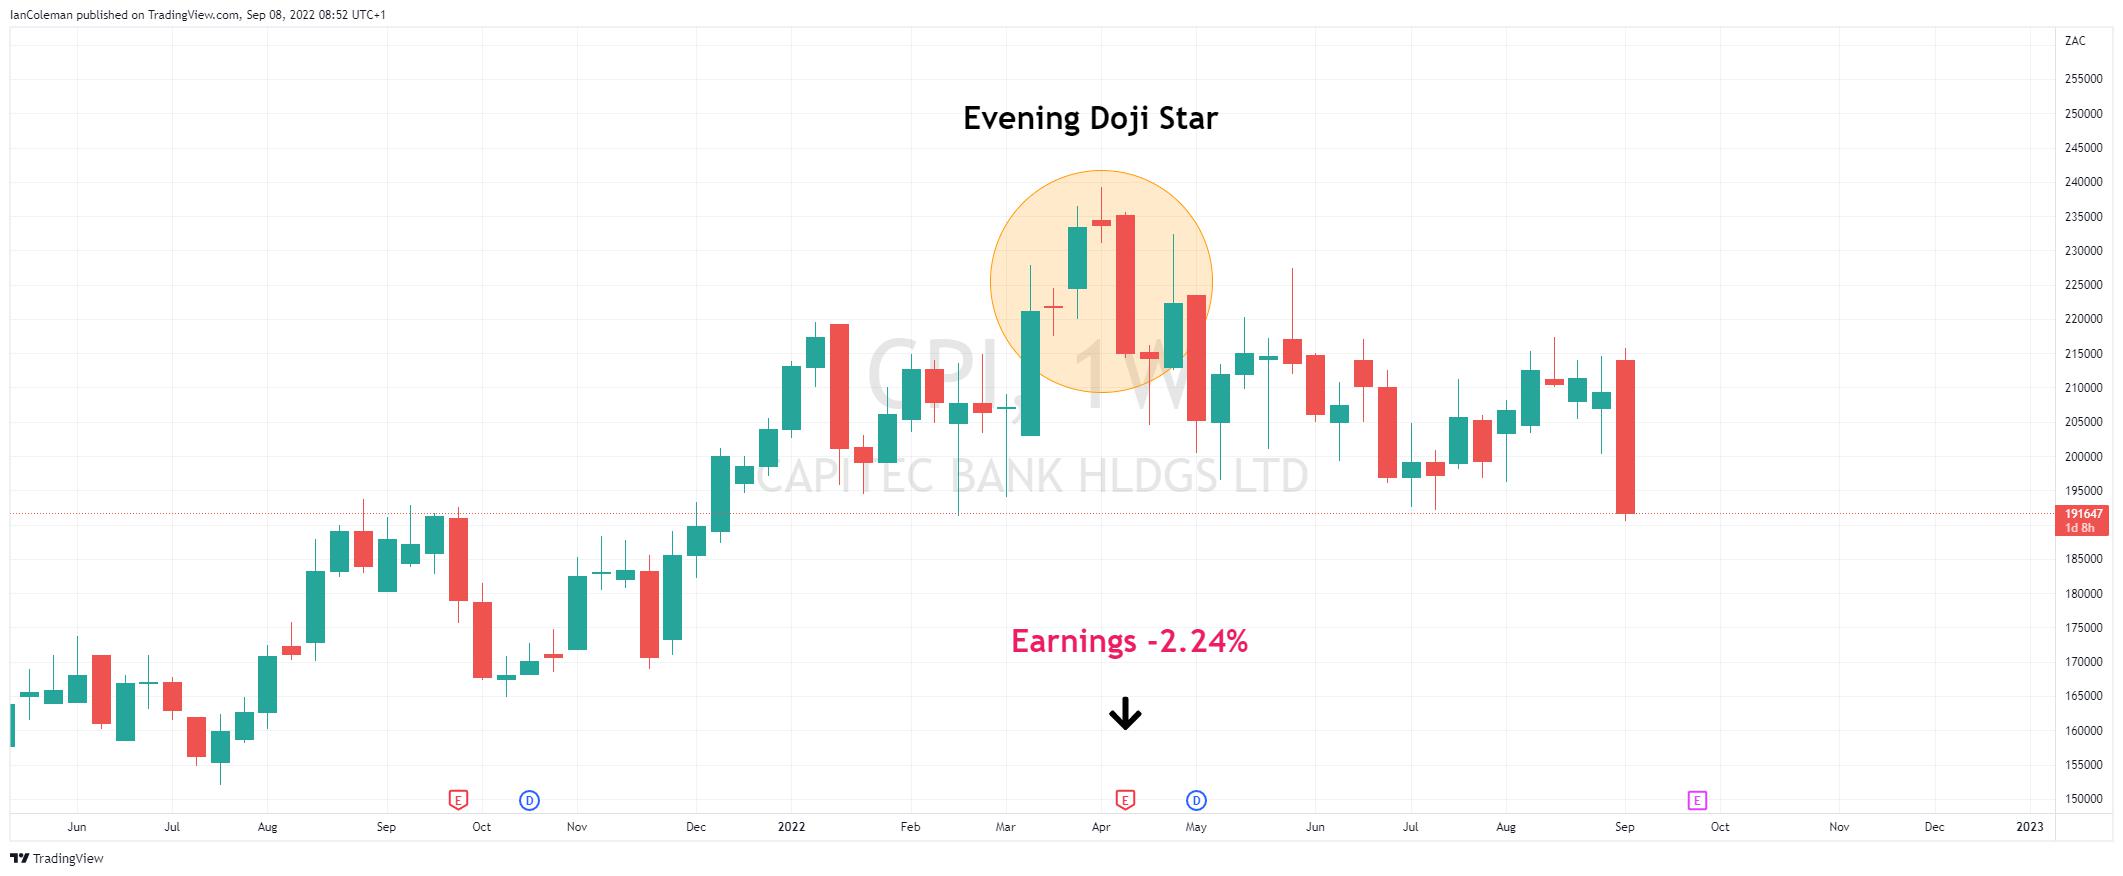
Figure 4 Trading View CPI Evening Doji Star
Price action looks to have formed a technical pattern known as a Bearish Head and Shoulders, breaking the neckline of the formation as we write.
The technical measured move target for the formation is located at 146400.
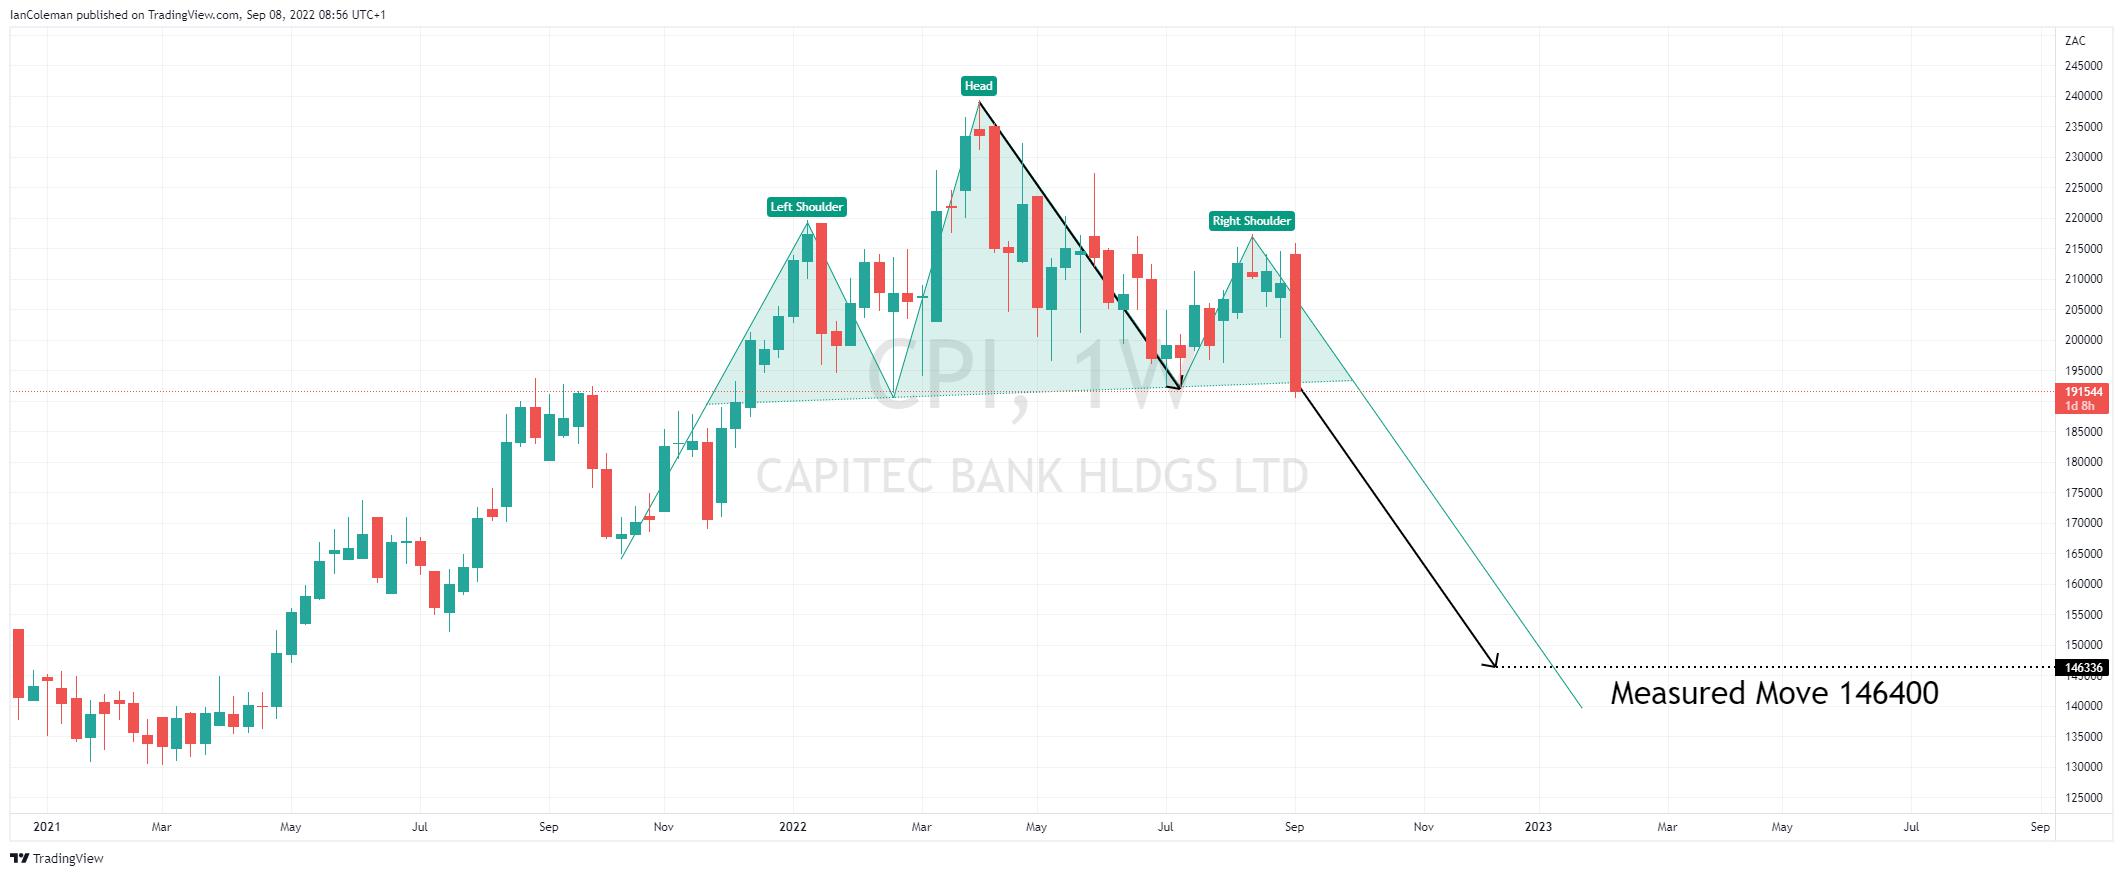
Figure 5 Trading View CPI shares Bearish Head and Shoulders
Related articles

The material provided here has not been prepared in accordance with legal requirements designed to promote the independence of investment research and as such is considered to be a marketing communication. Whilst it is not subject to any prohibition on dealing ahead of the dissemination of investment research we will not seek to take any advantage before providing it to our clients.
Pepperstone doesn’t represent that the material provided here is accurate, current or complete, and therefore shouldn’t be relied upon as such. The information, whether from a third party or not, isn’t to be considered as a recommendation; or an offer to buy or sell; or the solicitation of an offer to buy or sell any security, financial product or instrument; or to participate in any particular trading strategy. It does not take into account readers’ financial situation or investment objectives. We advise any readers of this content to seek their own advice. Without the approval of Pepperstone, reproduction or redistribution of this information isn’t permitted.