- English
- 中文版
Learn to trade
Let us dig deeper into ZIP ASX
Founded in 2013, Zip Co Limited is a financial technology company who specialise in digital retail finance and payments. ZIP ASX is a player in the BNPL marketplace.
Since the COVID-19 outbreak in January 2020, cash has taken a backseat with card payments the preferred choice for many retailers. Will this trend continue?
The rise and fall of ZIP ASX shares
Zip Co Limited shares witnessed a powerful rally from the 2020 low of 1.05 to the peak in February 2021 of 14.53, a rally of 1275%.
The rally has been mirrored by an equally exceptional decline with the current share price below the 2020 base.
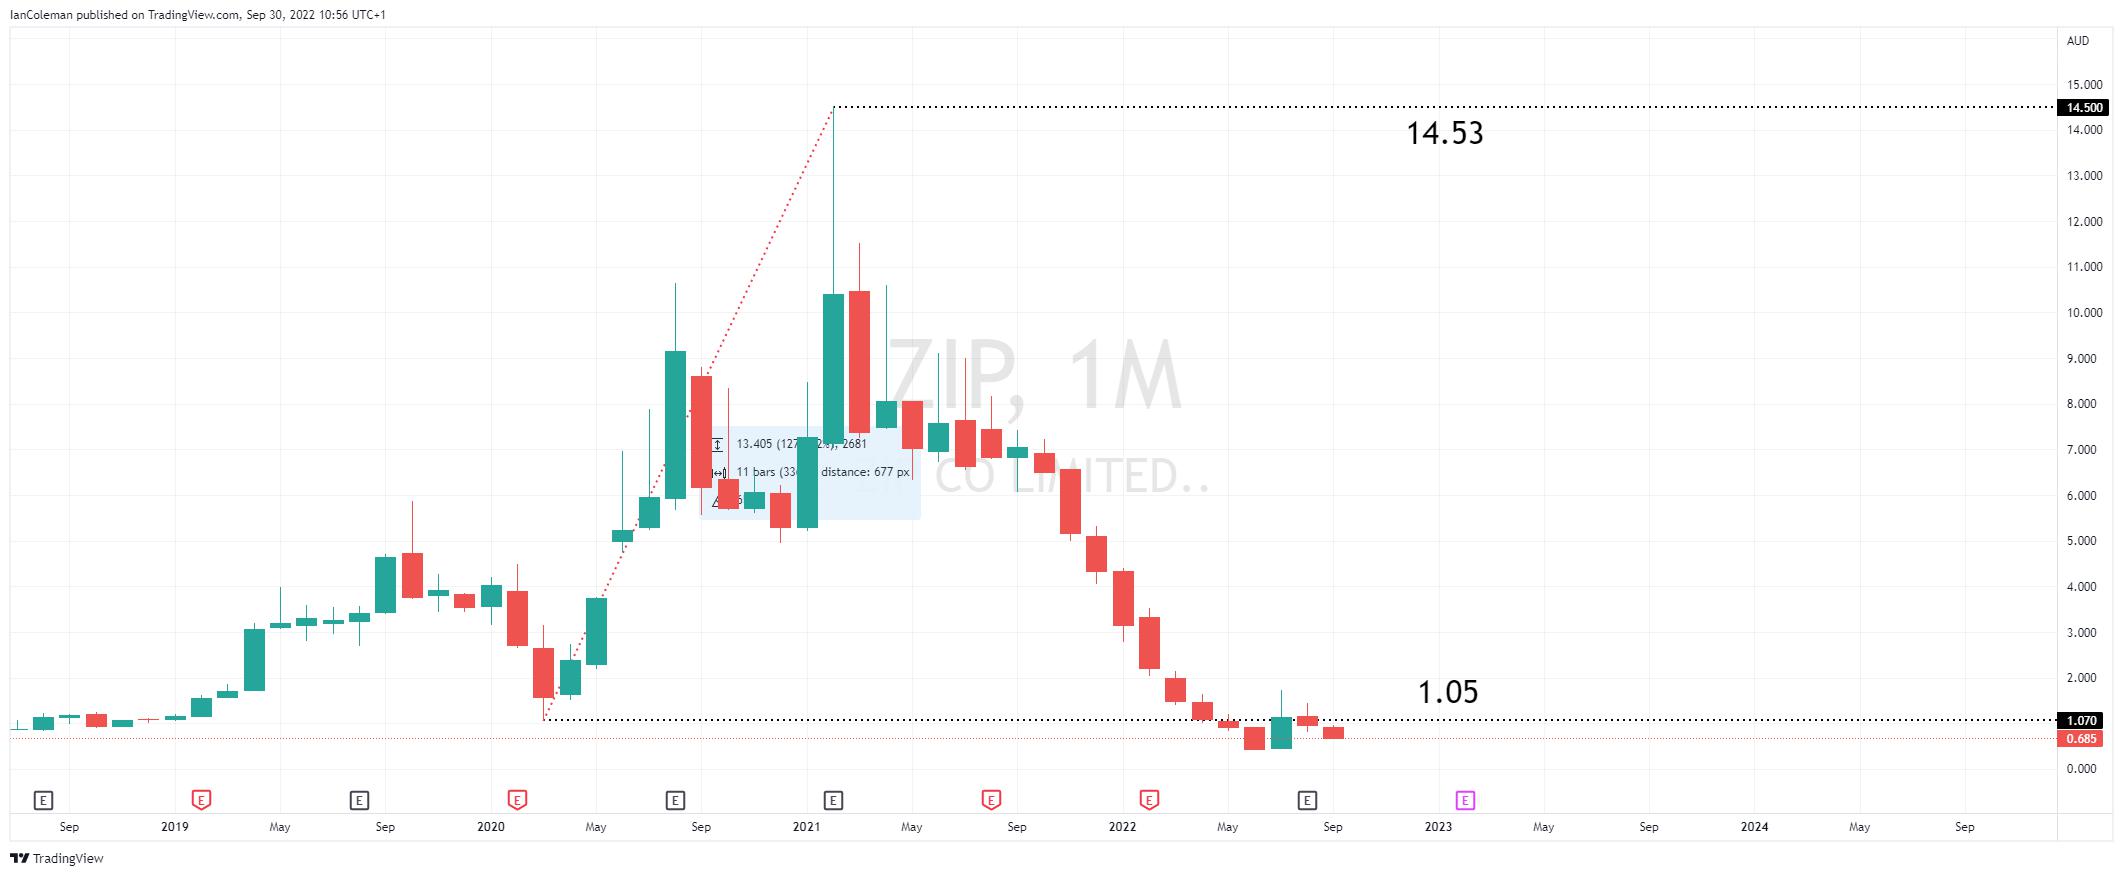
Figure 1 Trading View ZIP share price
A player in the BNPL marketplace
Zip is at the forefront of the Buy Now Pay Later arena. It allows holders to spread the cost of retail purchases over 4 interest free payments. For instance, we buy a pair of trainers at £80. We pay the first payment of £20 when we purchase the goods. The next 3 payments of £20 are paid over 6-weeks with no interest or fees to be paid.

Figure 2 ZIP Purchase Plan
How does ZIP make money?
Instead of making money from you, BNPL providers make money from taking a small cut from the partnered retailers.
What has driven ZIP lower?
During the COVID-1- pandemic, online shopping witnessed strong growth with consumers unable to visit stores. Although ZIP still posts healthy top-line figures, they are suffering from bad debts resulting in greater losses. This combination is weighing on the share price.
The recent sharp rise in global inflation is also having an impact on consumer spending power and their willingness to take on more debt.
A look from a technical perspective
ZIP ASX has only posted one positive monthly performance in the last 11. Although this sounds like an extremely good reason to stay away from the stock, it should be noted that July’s performance left a technical candle known as a Bullish Outside Bar. This candle pattern is often seen at the base of a trend and the start of a new upward bias. For more information on technical analysis click here.
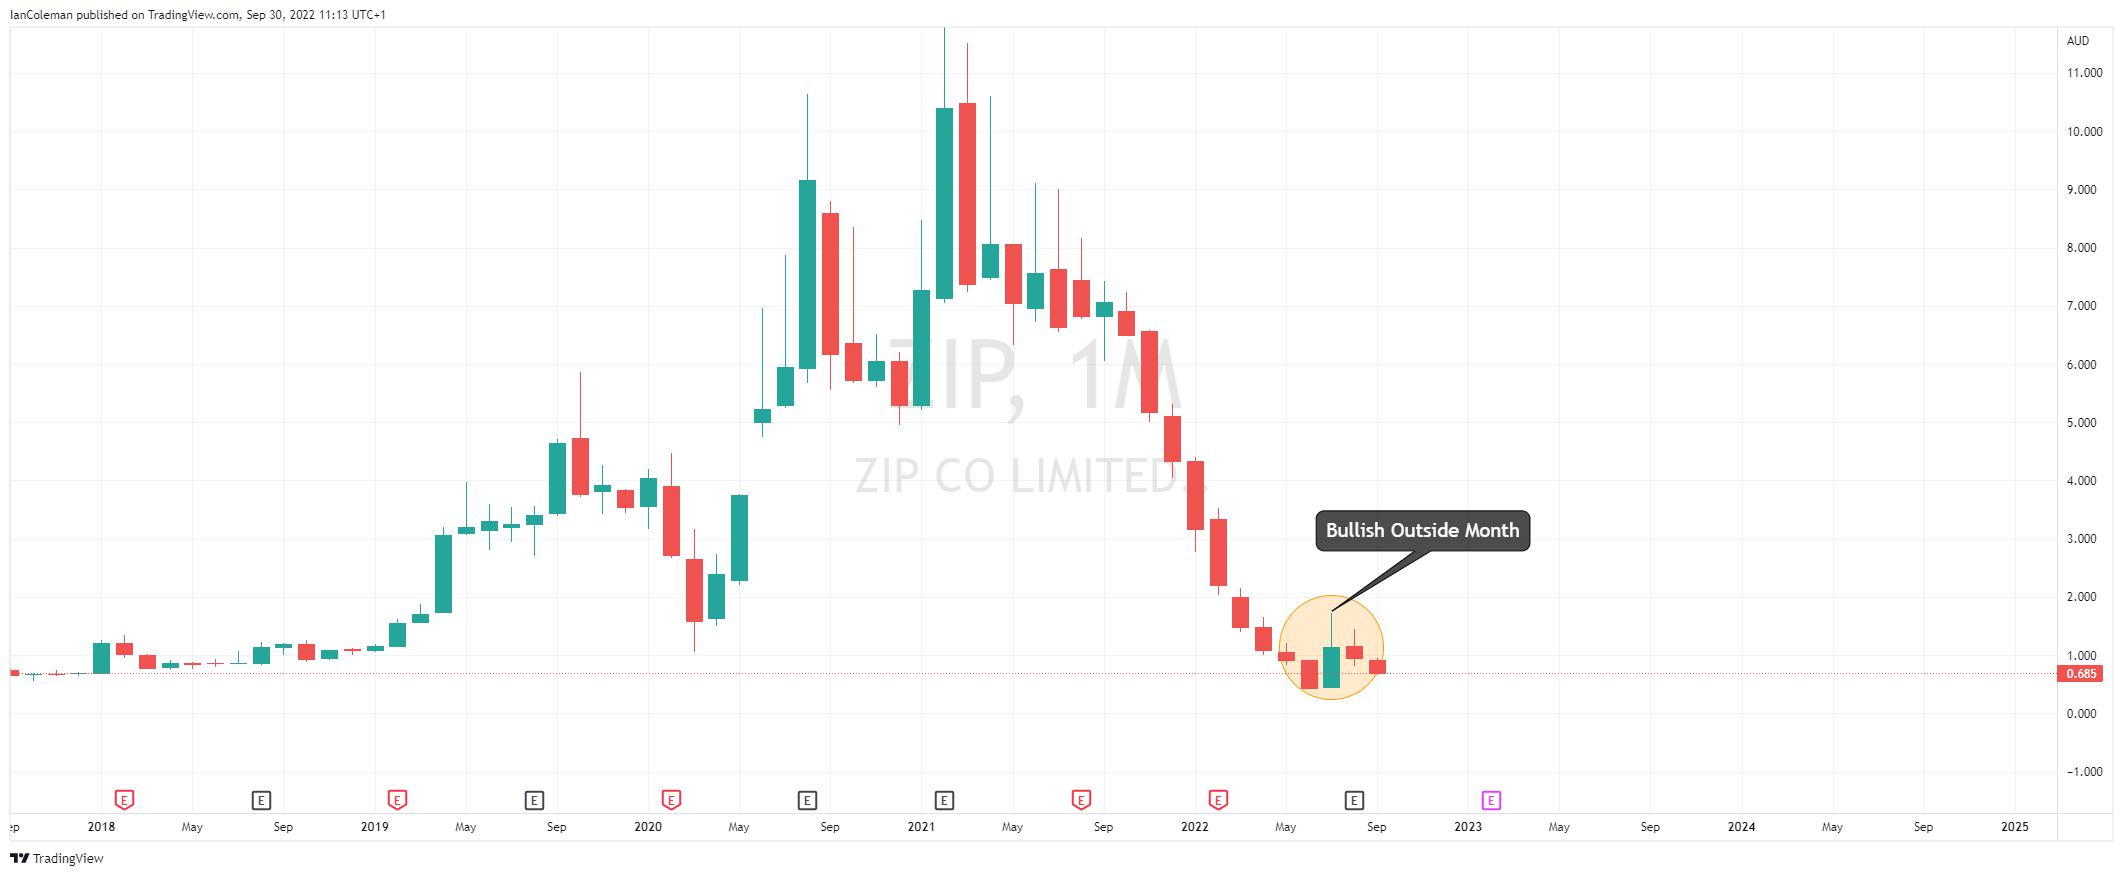
Figure 3 Trading View Bullish Outside Month
Looking into a shorter time frame of 8-hours, there is a possible technical pattern known as a bullish BAT formation, completing between 0.63 and 0.58. A break of the previous low 0.435 invalidates the pattern.
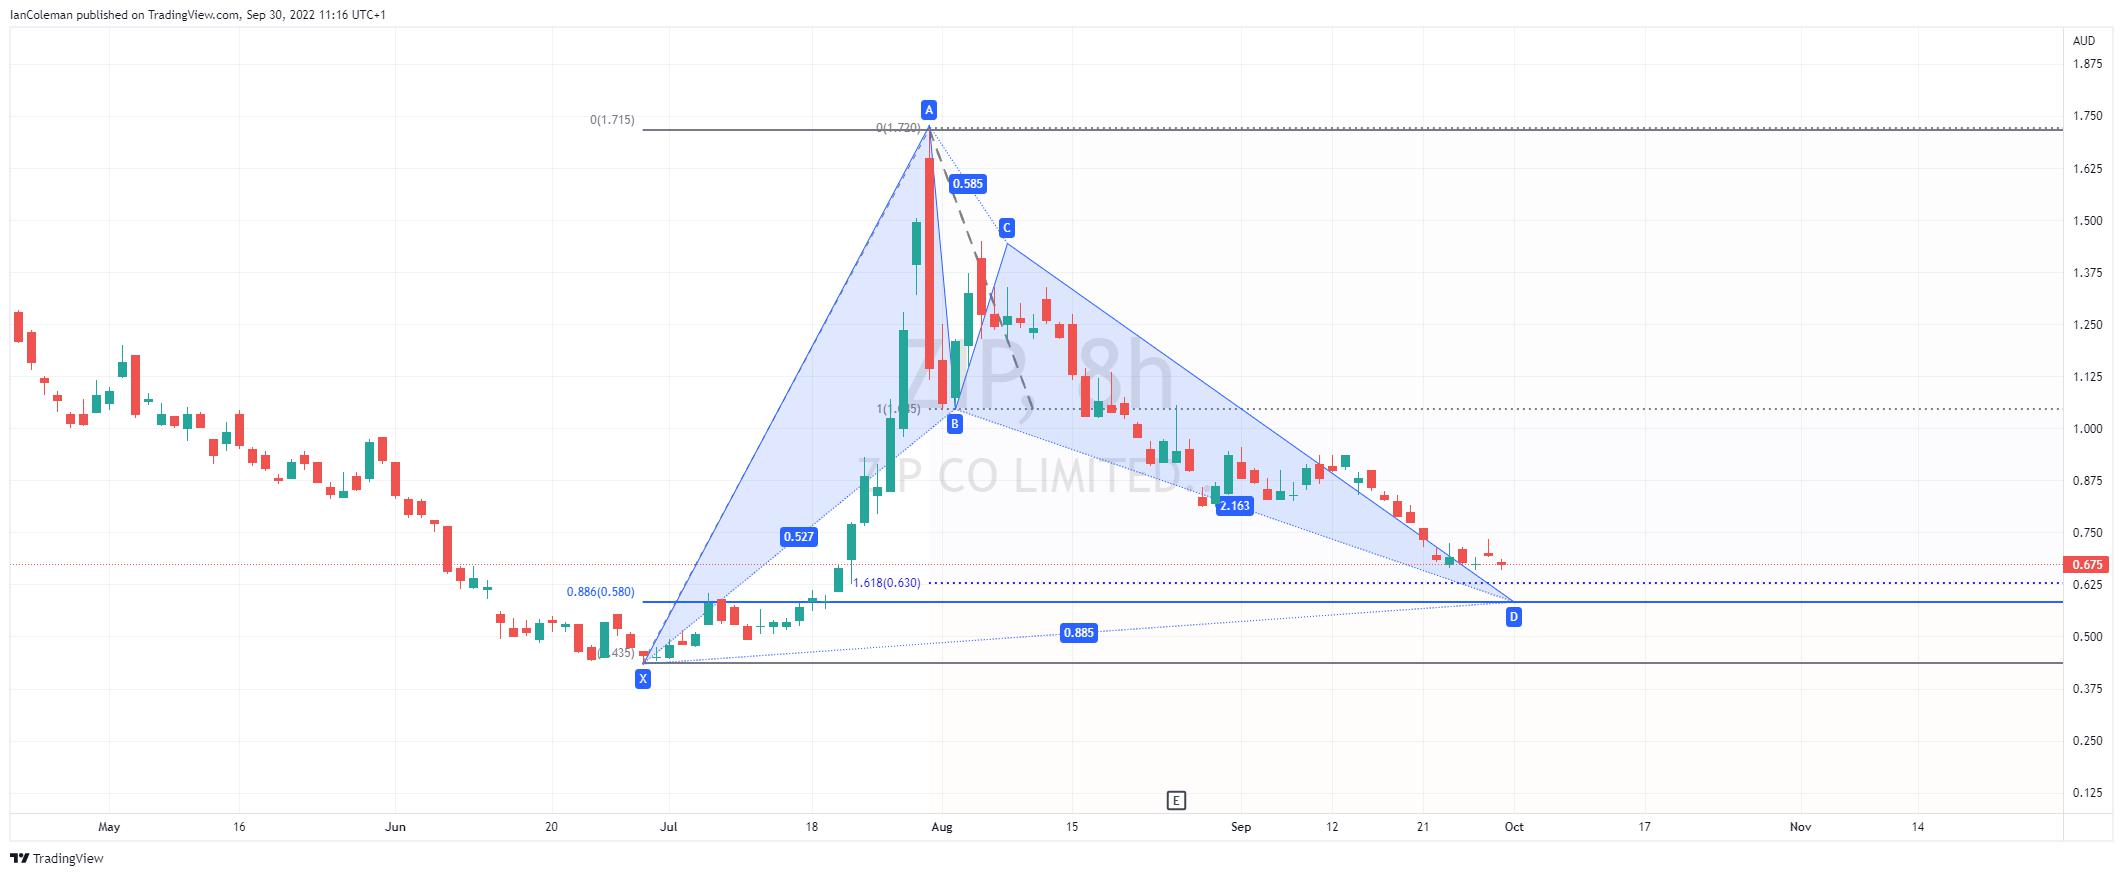
Figure 3 Trading View possible BAT formation
To learn more about trading shares at Pepperstone, click here.
Related articles


The material provided here has not been prepared in accordance with legal requirements designed to promote the independence of investment research and as such is considered to be a marketing communication. Whilst it is not subject to any prohibition on dealing ahead of the dissemination of investment research we will not seek to take any advantage before providing it to our clients.
Pepperstone doesn’t represent that the material provided here is accurate, current or complete, and therefore shouldn’t be relied upon as such. The information, whether from a third party or not, isn’t to be considered as a recommendation; or an offer to buy or sell; or the solicitation of an offer to buy or sell any security, financial product or instrument; or to participate in any particular trading strategy. It does not take into account readers’ financial situation or investment objectives. We advise any readers of this content to seek their own advice. Without the approval of Pepperstone, reproduction or redistribution of this information isn’t permitted.