- English
- 中文版
Some basic information about ANZ
ANZ stands for The Australia and New Zealand Banking Group Limited. The short code is ANZ. They are Australia’s second largest bank by assets and fourth largest by market cap. We are going to break down ANZ share CFD price from a fundamental and technical standpoint.
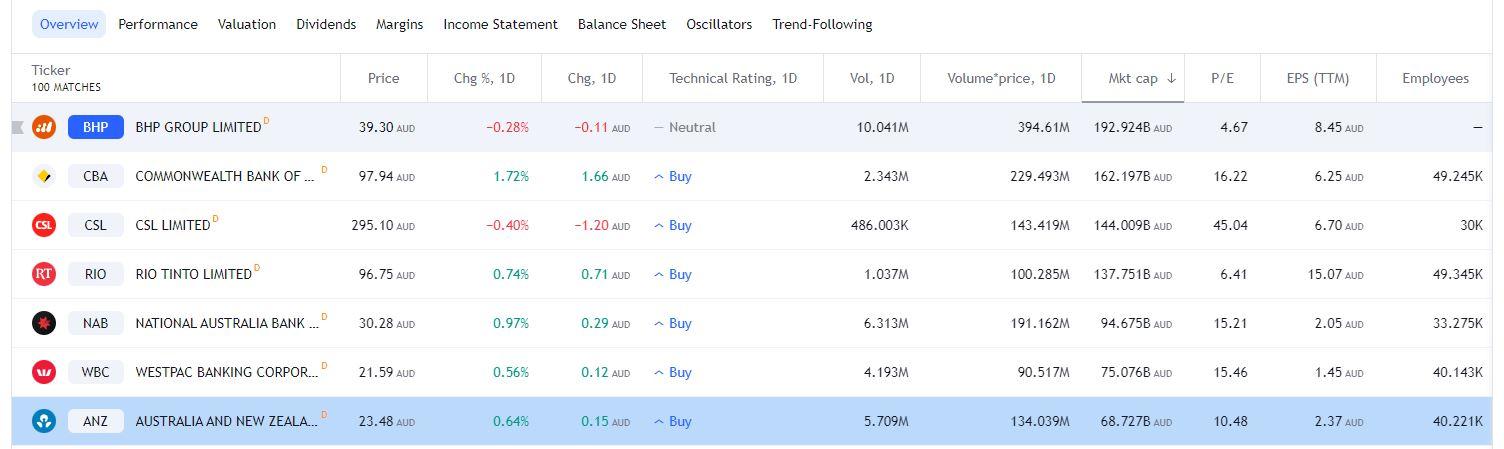
Figure 1 Trading View ANZ Market Cap
The 2020 rally in the ANZ share CFD price
The Australian Banking sector performed robustly in 2020, and ANZ was no exception to this rule. ANZ share CFDs witnessed a rally of +110% from the March 2020 low of 13.99 AUD to the high print of 29.41 AUD in June 2021.
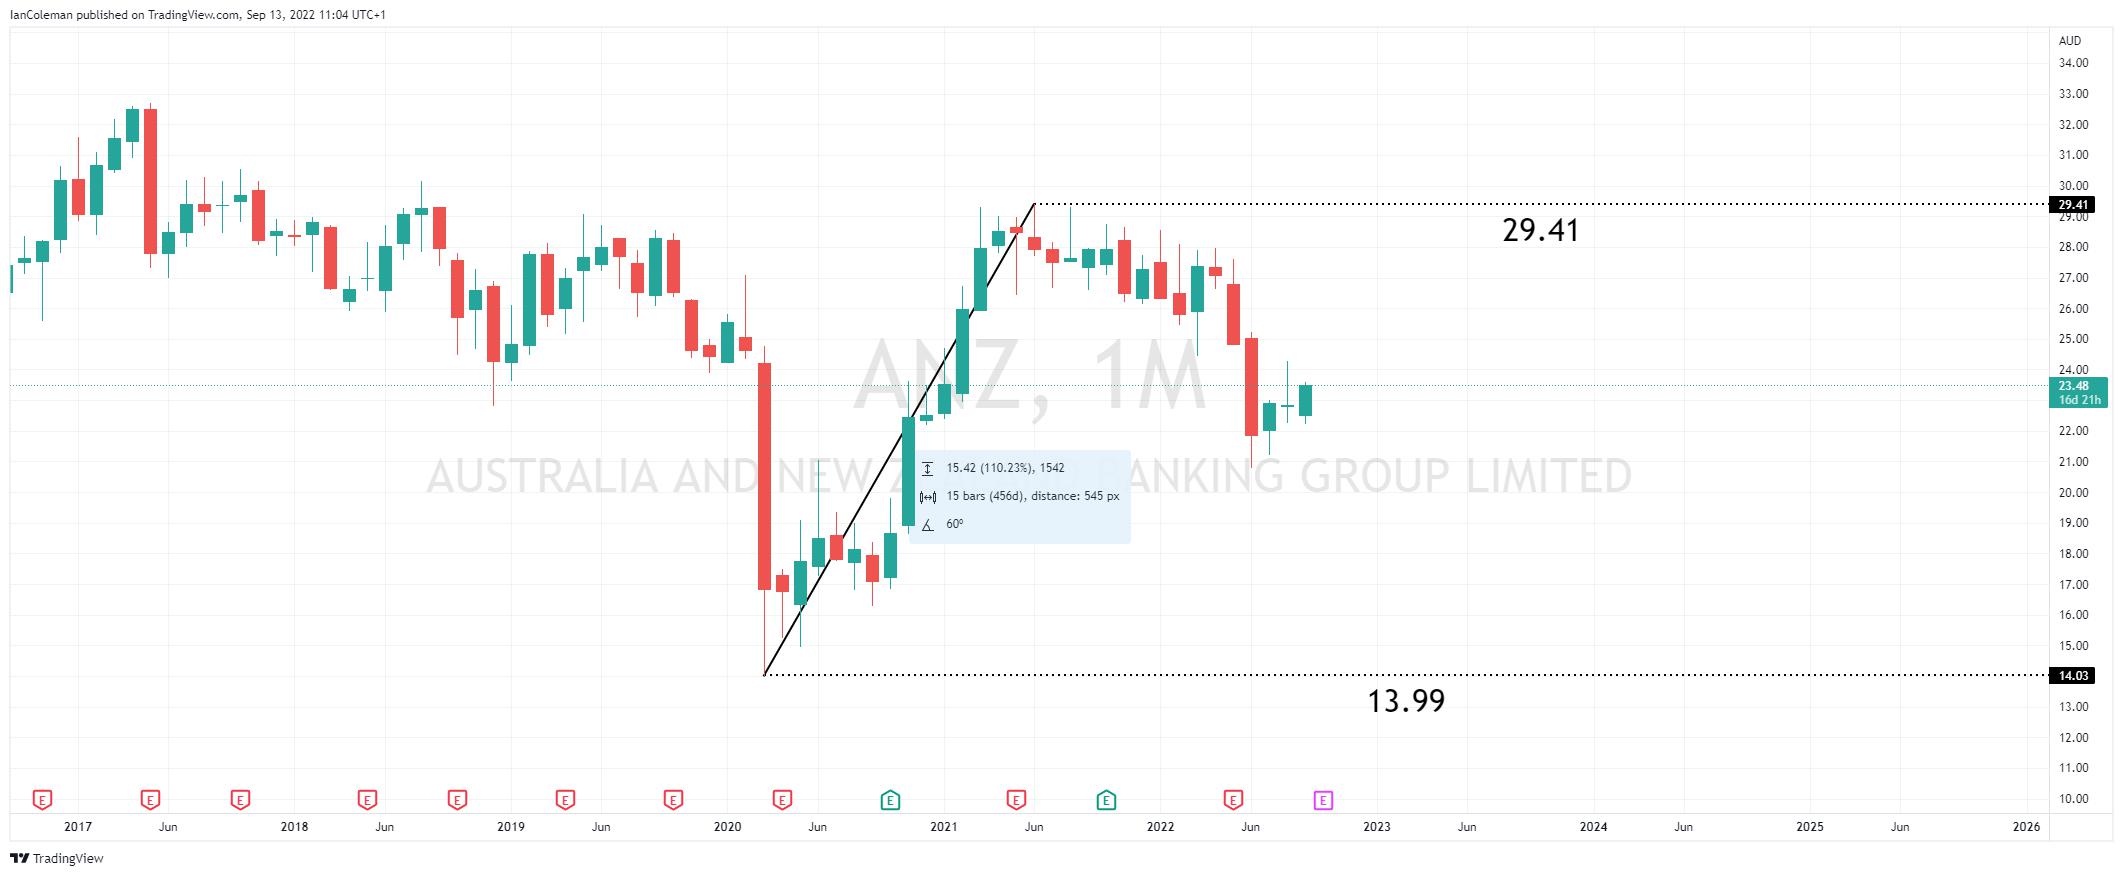
Figure 2 Trading View ANZ 2020 rally
It should be noted that ANZ has only beaten earnings expectations twice in the last 12 reports. The next report is due on the 22nd of October 2022.
The 2022 half year results were published on the 4th of May 2022, just before the last decline in the ANZ share CFD price.
ANZ announced a Statutory Profit after tax for the half year ended 31 March 2022 of $3,530 million, up 10% on the previous half. Cash Profit from continuing operations was $3,113 million, down 3% when compared with the prior half. ANZ’s Common Equity Tier 1 Ratio was strong at 11.5% and Cash Return on Equity was 10%. The proposed Interim Dividend is 72 cents per share CFD , fully franked.
A look from a technical perspective
Looking at the monthly chart from a technical perspective, we can note an Expanding Wedge pattern. This has an eventual bias to beak to the upside. Trend line resistance is currently located at 28.07. A breach there, and the measured move target is 39.96.
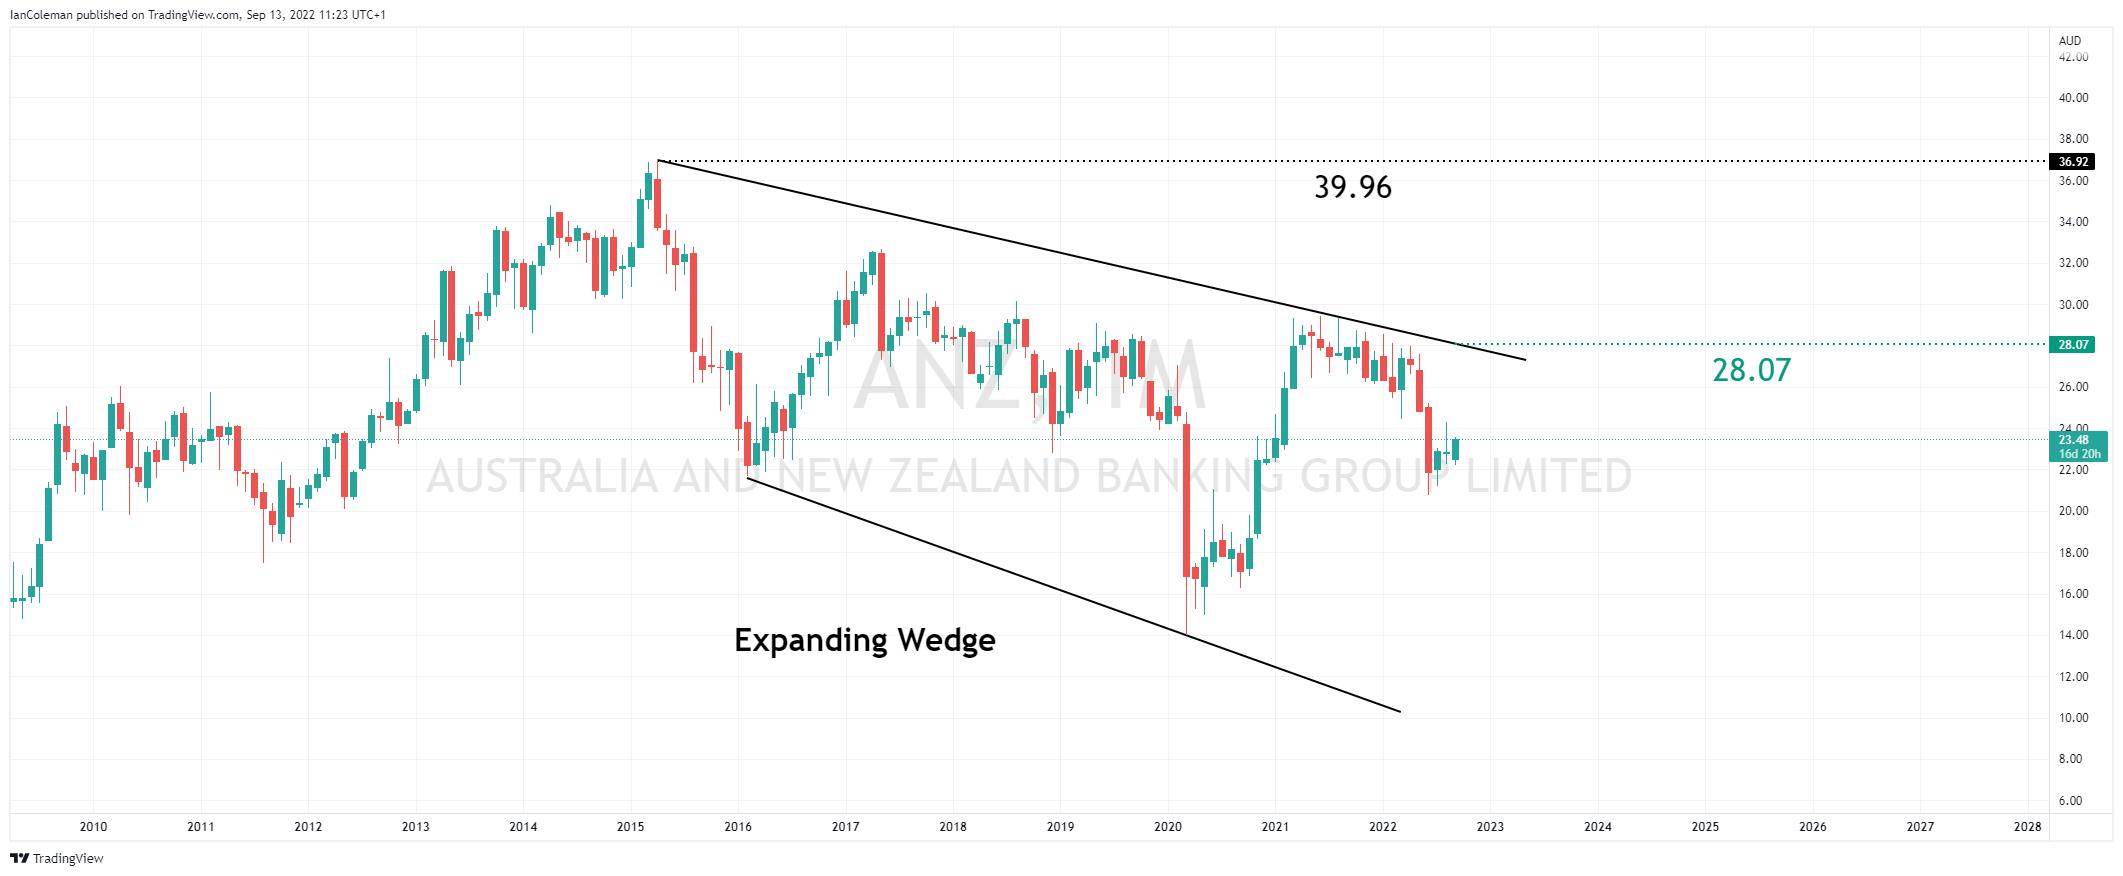
Figure 3 Trading View Monthly ANZ Expanding Wedge
We have seen a move to the upside from levels close to 21.05. This was a previous swing high from June 2020. What acted as resistance, now acts as support.
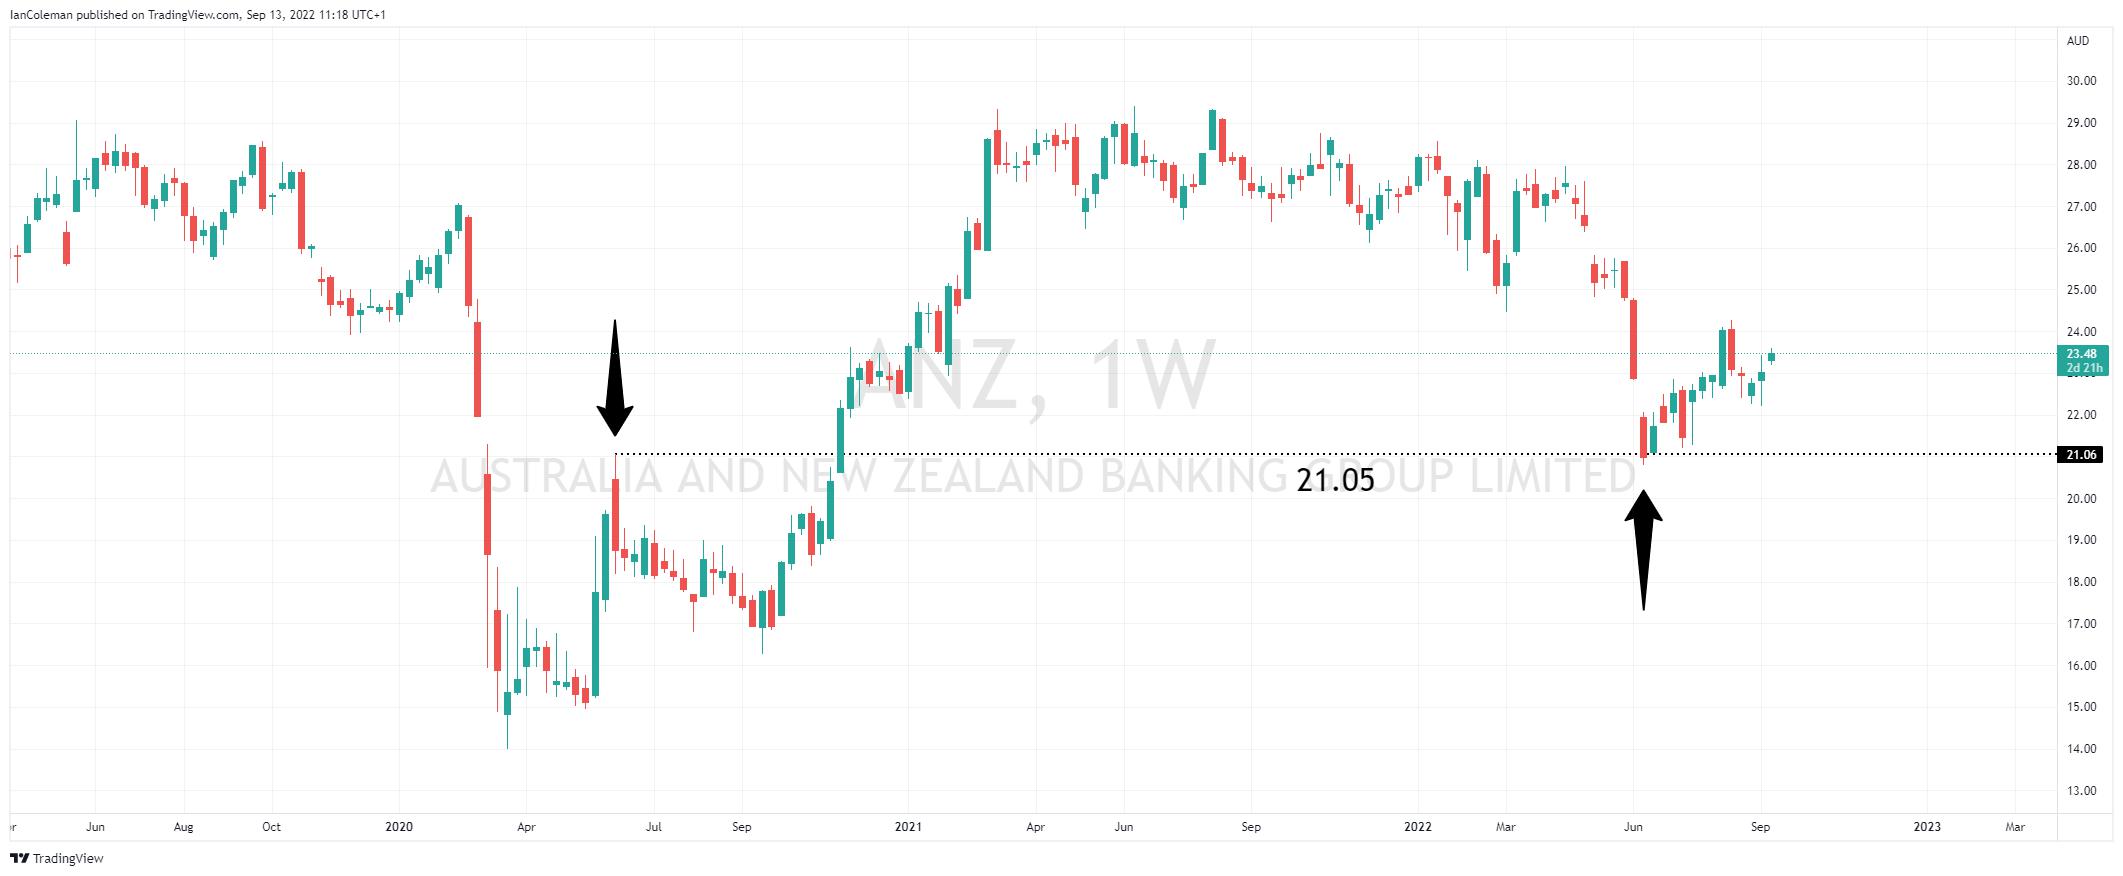
Figure 4 Trading View Weekly ANZ 21.05 being pivotal
A look from an Elliott Wave perspective, and the last move higher can be seen in 5-waves. That would suggest that the current move lower is corrective.
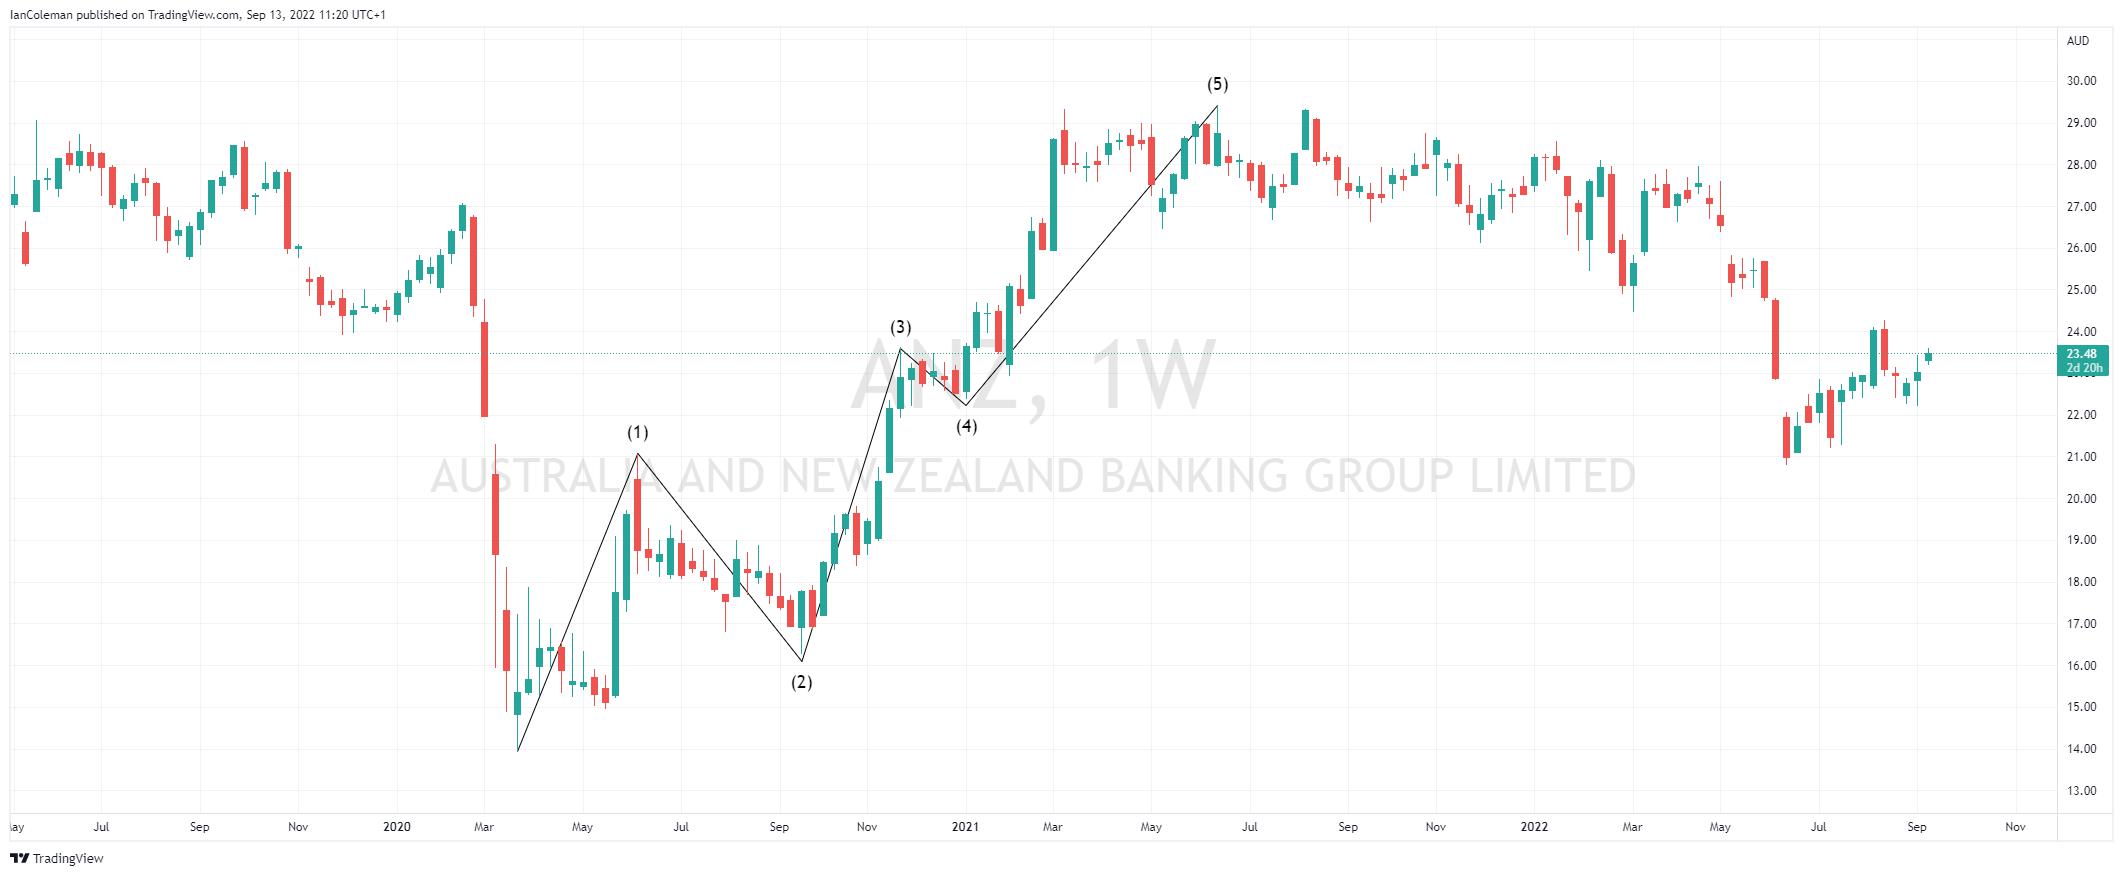
Figure 5 Trading View Weekly ANZ 5-wave pattern
Corrective formations are normally in a 3-wave pattern. There is the potential for a bullish Bat Cypher formation to complete between 15.71 and 15.55.
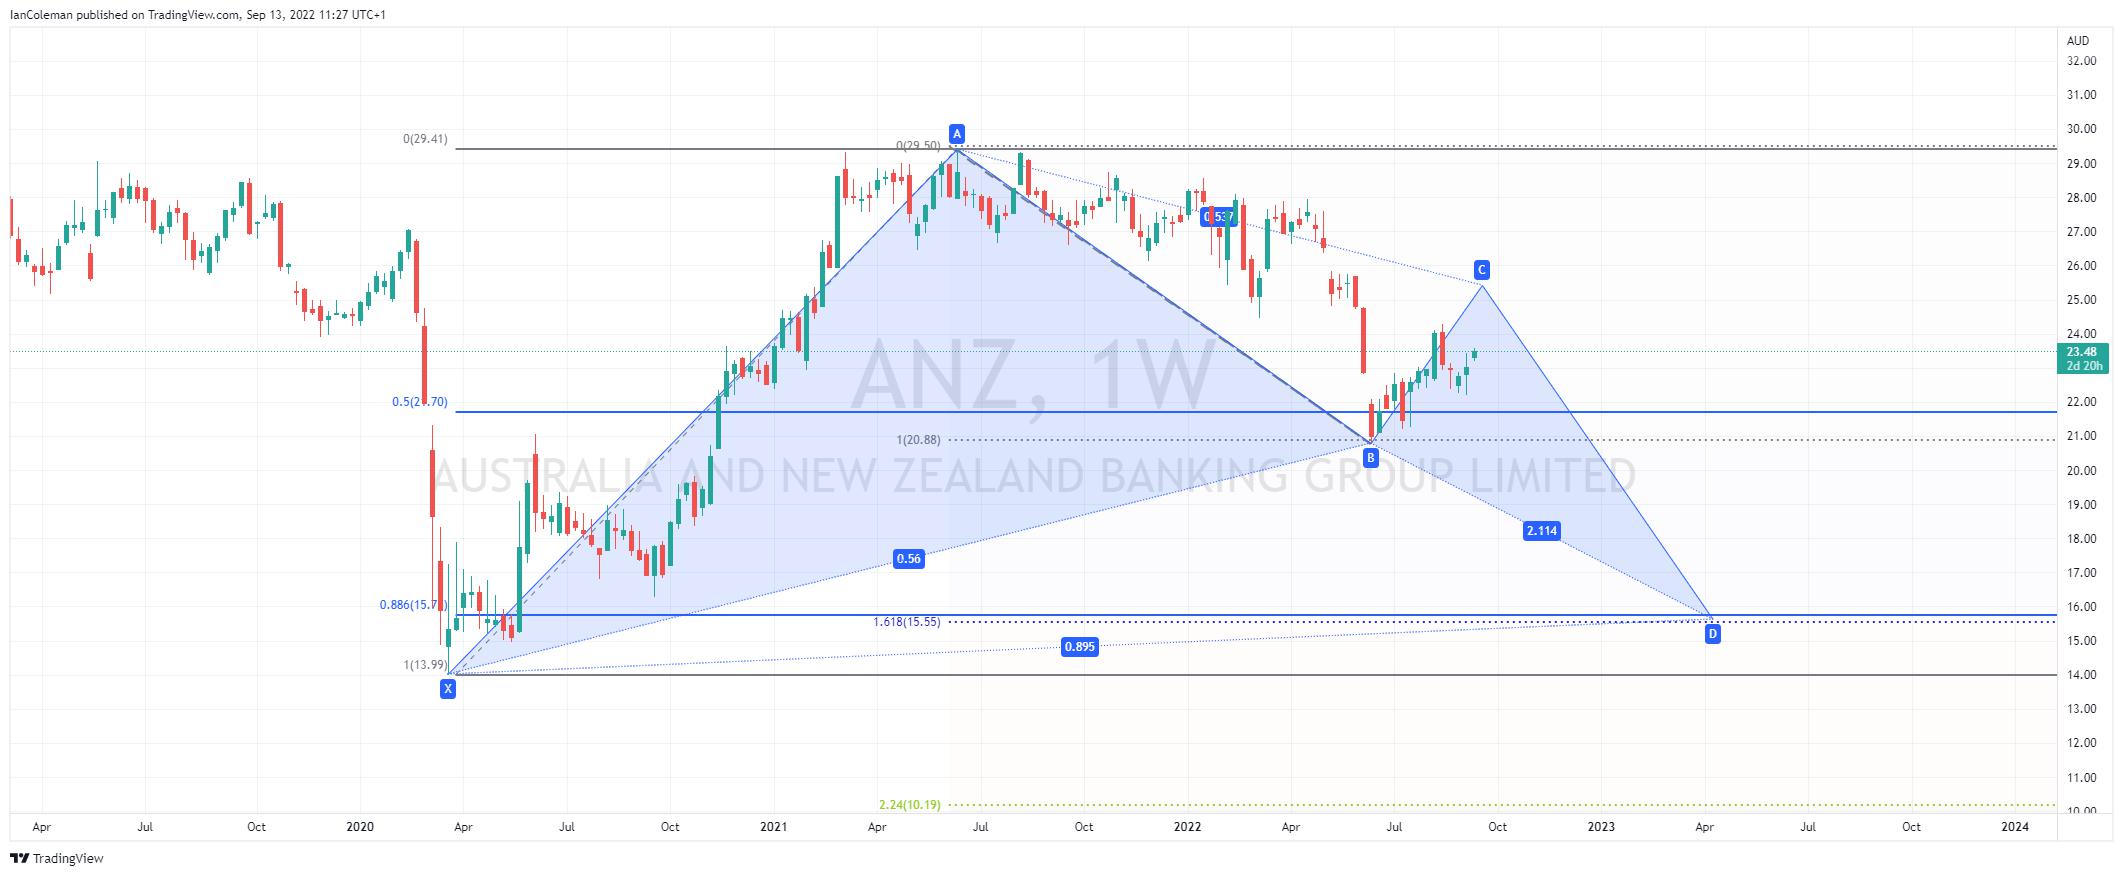
Figure 6 Trading View Weekly ANZ Possible Bat formation
Related articles


The material provided here has not been prepared in accordance with legal requirements designed to promote the independence of investment research and as such is considered to be a marketing communication. Whilst it is not subject to any prohibition on dealing ahead of the dissemination of investment research we will not seek to take any advantage before providing it to our clients.
Pepperstone doesn’t represent that the material provided here is accurate, current or complete, and therefore shouldn’t be relied upon as such. The information, whether from a third party or not, isn’t to be considered as a recommendation; or an offer to buy or sell; or the solicitation of an offer to buy or sell any security, financial product or instrument; or to participate in any particular trading strategy. It does not take into account readers’ financial situation or investment objectives. We advise any readers of this content to seek their own advice. Without the approval of Pepperstone, reproduction or redistribution of this information isn’t permitted.