- English
- 中文版
Some information about the index
Developed by CNNMoney, the Fear and Greed index highlights the two primary emotions that drive the markets. Fear tends to drive the stock market lower while too much greed drives the market higher.
Extreme fear can drive stocks below their intrinsic value. While extreme greed has the opposite effect.
For the past week we have moved into the extreme fear zone, with today’s reading being at 16 (28/09/2022).
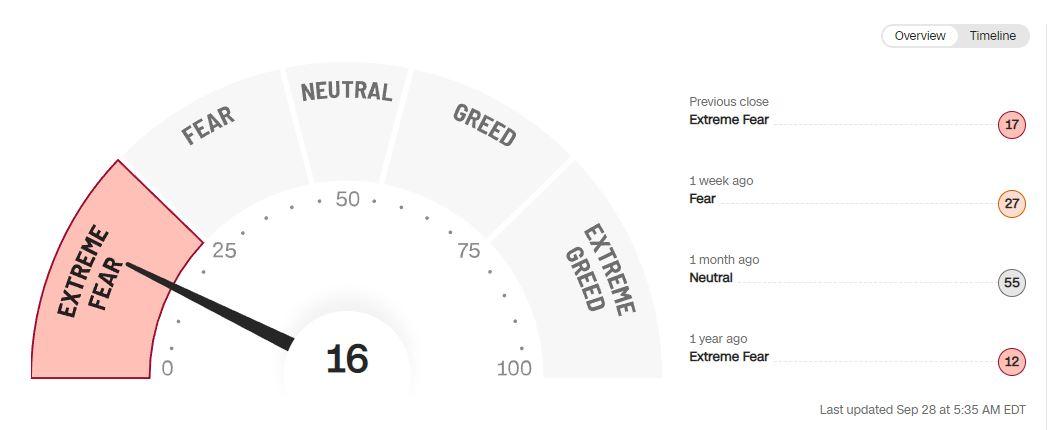
Figure 1 CNN Fear and Greed Overview
This is a strong shift in investor sentiment from the 68 ‘Greed’ reading seen on the 12th of August 2022.
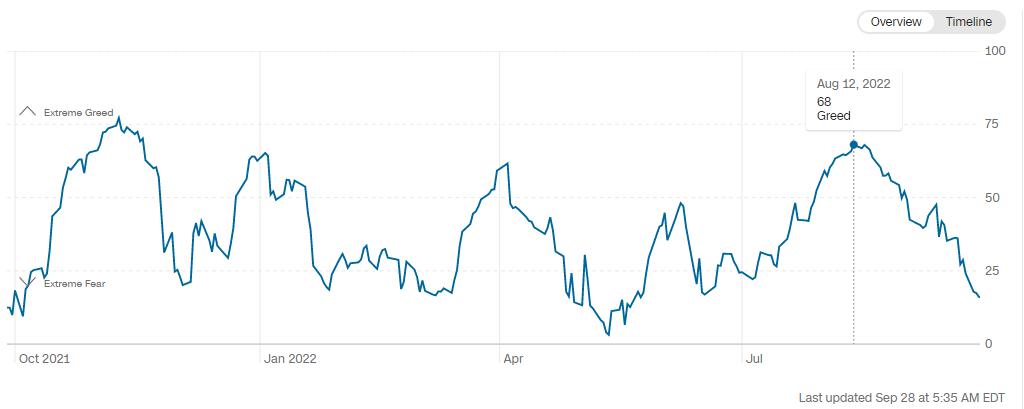
Figure 2 CNN Fear and Greed Timeline
The 7 sentiment indicators
What drives the index and why?
The Fear and Greed Index is made up of seven sentiment indicators. They are:
- Market Momentum
- Stock Price Strength
- Stock Price Breadth
- Put and Call Options
- Market Volatility
- Safe Haven Demand
- Junk Bond Demand
Market Momentum
A measure of the S&P 500 (US500) against the 125-day moving average. If the index is below the average, it is seen as a sign of fear. Above the average, a sign of greed.
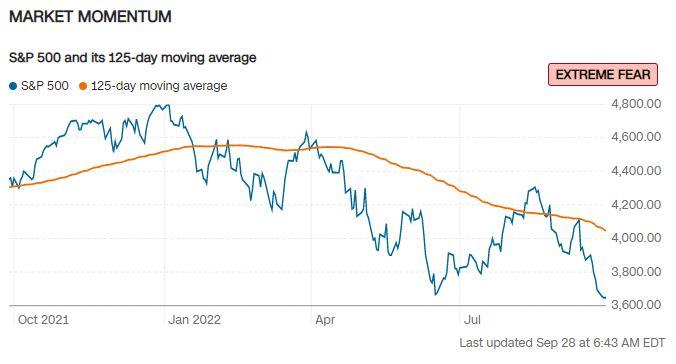
Figure 3 CNN Fear and Greed Market Momentum
Stock Price Strength
The number of stocks at 52-week highs against the number of stocks at 52-week lows. When there are more lows than highs, that is a bearish signal of Fear.
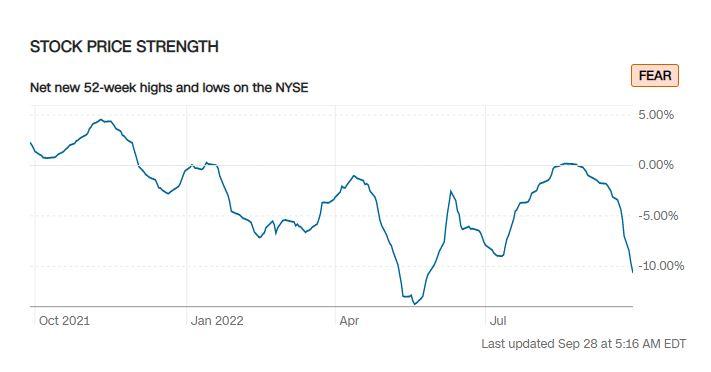
Figure 4 CNN Fear and Greed Stock Price Strength
Stock Price Breadth
The volume of stocks being bought against the volume of stocks being sold. A low reading is an indication of Fear.
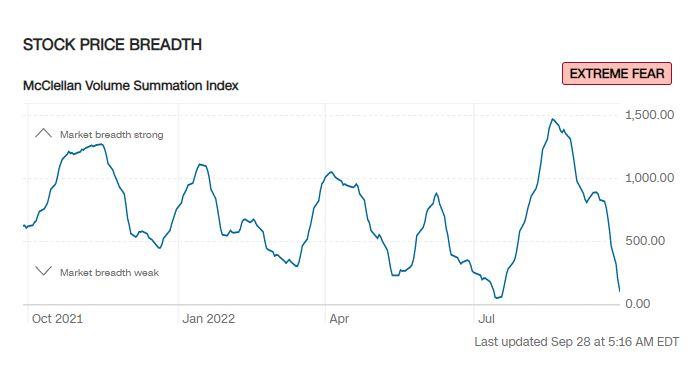
Figure 5 CNN Fear and Greed Stock Price Breadth
Put and Call Option
A PUT option is the right to buy a stock at an agreed price and time. A CALL option is the right to sell a stock at an agreed price and time. When PUT options outweigh Call options, this is regarded as indication investors are nervous. A reading over 1 is a signal of Fear.
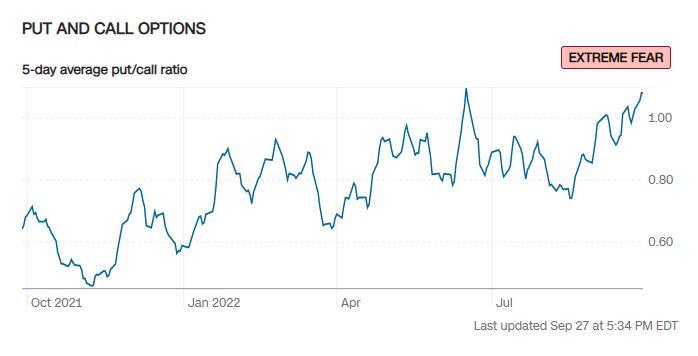
Figure 6 CNN Fear and Greed Call and Put options
Market Volatility
The best-known indication of market sentiment is the VIX (volatility index). The Fear and Greed index looks for increasing VIX and a signal of Fear. For more information on the VIX Index.
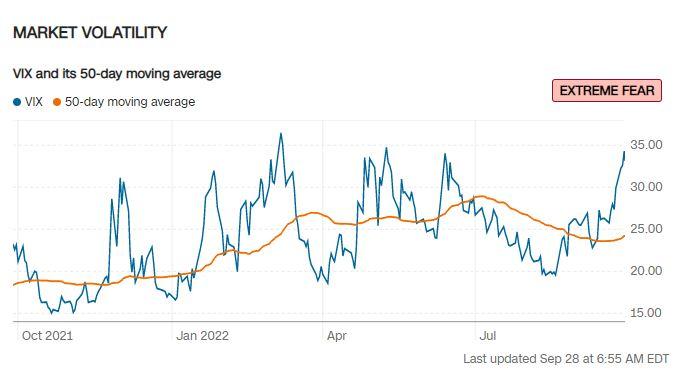
Figure 7 CNN Fear and Greed Market Volatility
Safe-Haven Demand
Stocks are a riskier asset class than Bonds. Bond buying is more relevant when investors are fearful. The index highlights increasing safe-haven demand as an indication of Fear.
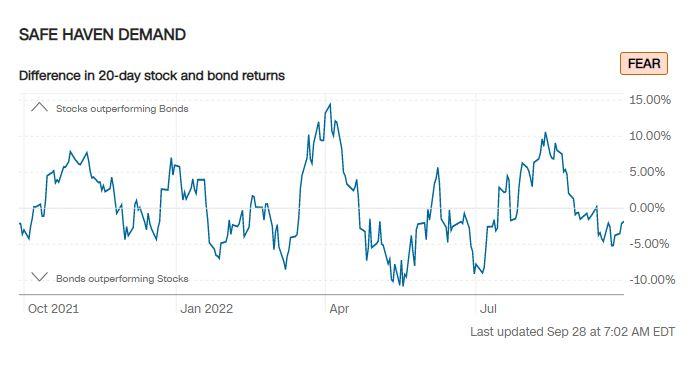
Figure 8 CNN Fear and Greed Safe Haven Demand
Junk Bond Demand
A smaller spread between junk bonds and government bonds is an indication that investors are taking on more risk. A widening spread highlights more caution and more fear.
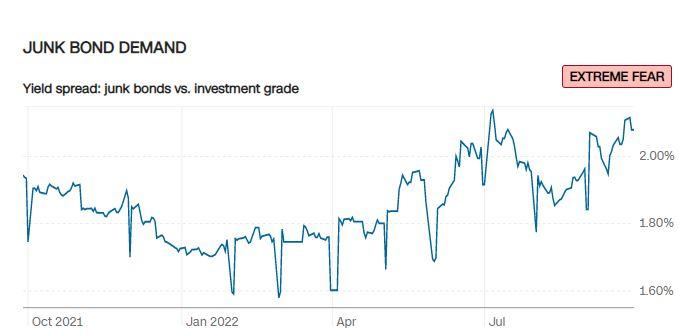
Figure 9 CNN Fear and Greed Junk Bond Demand
How can I use the Fear and Greed index to my advantage?
When markets move to extremes, this can be an indication that the emotion of the investing community is overdone. Some traders look to this as an opportunity to trade against the trend. Extreme Fear could be an indication that stocks are now undervalued. Extreme Greed and indication that stocks are overvalued.
“We simply attempt to be fearful when others are greedy and to be greedy only when others are fearful.” -Warren Buffet
For other great market quotes, click here.
Related articles

The material provided here has not been prepared in accordance with legal requirements designed to promote the independence of investment research and as such is considered to be a marketing communication. Whilst it is not subject to any prohibition on dealing ahead of the dissemination of investment research we will not seek to take any advantage before providing it to our clients.
Pepperstone doesn’t represent that the material provided here is accurate, current or complete, and therefore shouldn’t be relied upon as such. The information, whether from a third party or not, isn’t to be considered as a recommendation; or an offer to buy or sell; or the solicitation of an offer to buy or sell any security, financial product or instrument; or to participate in any particular trading strategy. It does not take into account readers’ financial situation or investment objectives. We advise any readers of this content to seek their own advice. Without the approval of Pepperstone, reproduction or redistribution of this information isn’t permitted.