- English
- 中文版
Analysis

Gold has been a reliable inflation hedge over the years, yet several clients are asking why gold isn't finding more love as a hedge now?
It’s a good question because when we can look at the moves in US inflation expectations, we see 10-year breakevens at 2.22% (blue line) - the highest since 2014 - and almost consistent with the Fed meeting its inflation mandate over the coming 10 years. To source this we look at the difference between US 10-year Treasury (white) and 10yr TIPS (Treasury Inflation Protected Security - yellow) or real yield.
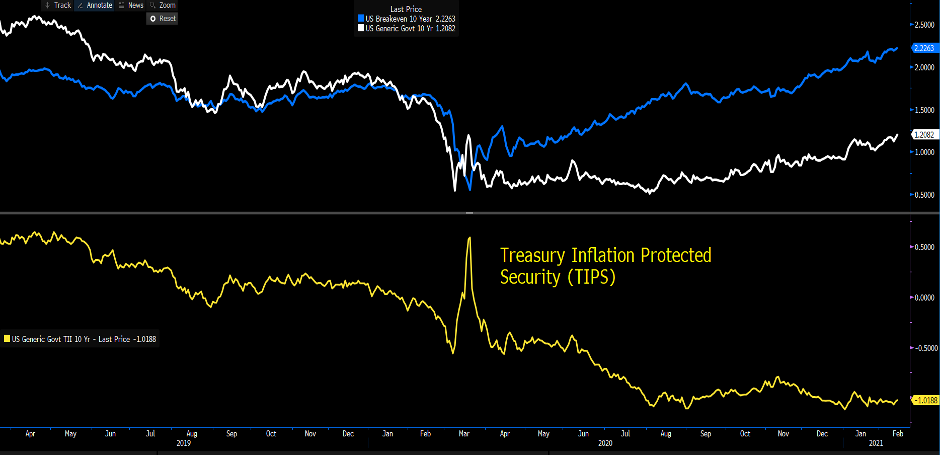
(Source: Bloomberg)
Still, despite this move higher traders have best expressed higher inflation expectations through short duration exposures in bond markets, with the 5s v 30s Treasury yield curve moving into 152bp (highest since 2015). While the short-end 2s vs 5s has moved from -14bp to currently stand at 38bp (highest since March 2018). It's crude, copper and cyclical share CFDs that have been the go-to hedge outside of the bond market, while some will say Crypto belongs on this list.
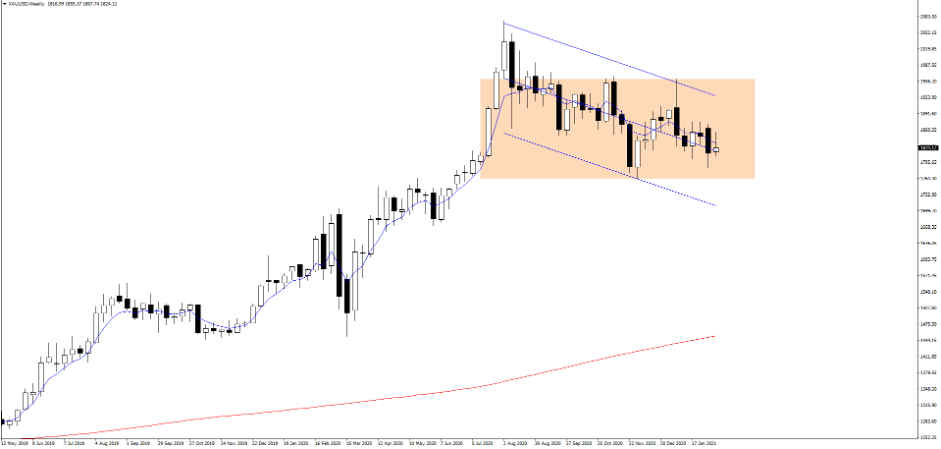
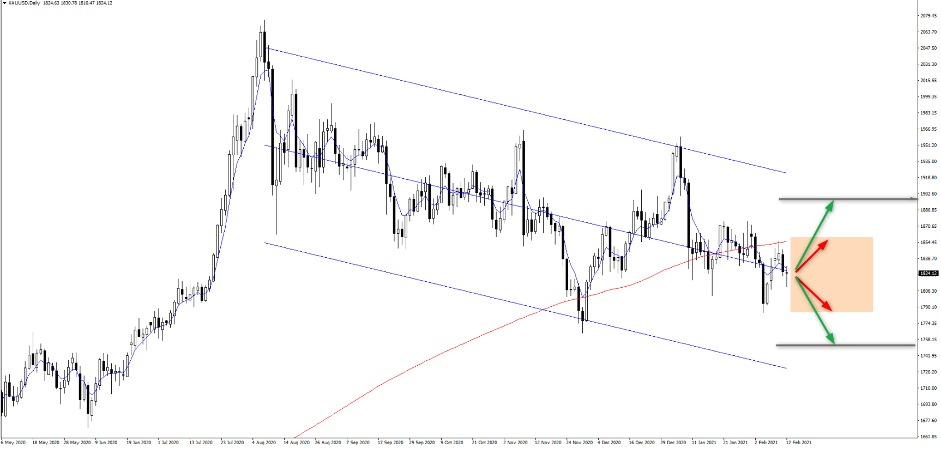
As we see from the daily chart, gold is working lower in the standard deviation channel (I’ve used 2 standard deviations from the line of best fit) and struggling to find any buying conviction at all. I guess this makes sense at this juncture, as the market senses inflation but it’s hardly at levels that scream the Fed have lost control – perhaps we need to see US 10-yr breakevens above 3% for that and that will take months to play out, if at all.
It’s this scenario which sets gold alight. That being we get an overheating US economy driven by a massive closing of the output gap, as the US Treasury unleash $2.8t is fiscal spending this year. While the Fed dismiss inflation as “transitory”, subsequently jawboning the market to suppress the moves in the back end of the Treasury curve. That's the nirvana situation for gold and crypto, as this is where real yields dive and rubber stamps gold as a store of value.
While I'm open-minded to this, I'm somewhat sceptical of this playing out though as the Fed will discuss tapering its bond-buying program later this year. Unless we see evidence of a re-run of 2013 (taper tantrum) which the Fed see as its biggest risk, then I feel they will leave long-end rates untouched.
So, conversely an overheating economy, with the Fed pulling back on QE and letting the back end rip may actually really damage the gold market. However that depends on the USD and real yields.
For now, though the XAUUSD weekly chart shows price defined in a 1961 to 1762 range and I am happy to trade within in this – however, when it breaks either side, then that should be respected.
An interesting dynamic is that gold has diverged from real rates by a material degree. I've flipped the gold line to show the once strong relationship, but since November the gold price has created a series of lower highs and lows and 10-year TIPS (real yields) and the USD have moved sideways and worked well together.
(White – 10yr TIPS/real Treasury rates, purple – USD index, orange – gold/inverted)
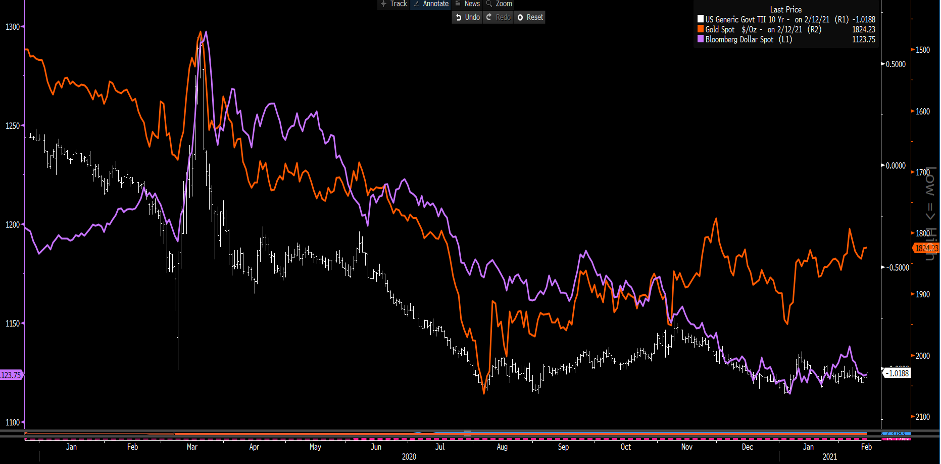
(Source: Bloomberg)
By way of positioning, there's been no real movement in the weekly CFTC report, with gold futures holdings from non-commercial accounts moving in a range of 218k to 279k contracts since September. That said, in the ETF space we’ve seen a near 40% outflow of the GLD ETF through this period. Investors clearly seeing the opportunity cost of being in a yield-less asset when other markets are responding far more cleanly to the economic improvement.
(Lower pane shows the cumulative flow)
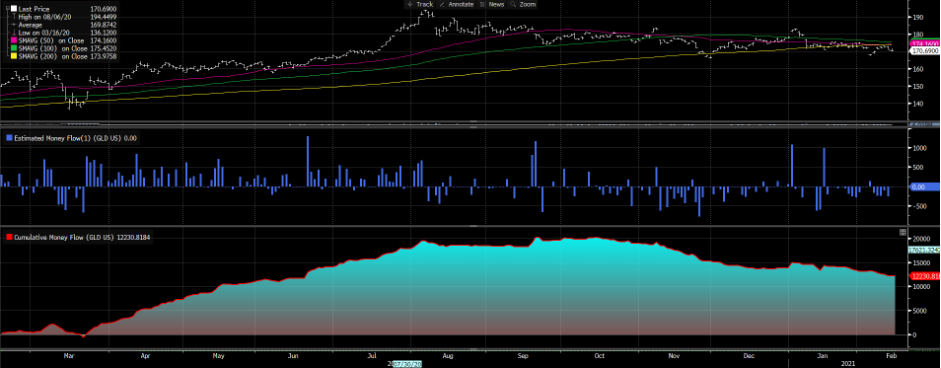
(Source: Bloomberg)
If we look in the options world at 25-delta 1-week (top pane) and 1-month (lower pane) ‘risks reversals’ we see call volatility almost at equal levels to put volatility. So, if 25-delta 1-month calls have an implied vol of 16.7188% and 25-delta 1-month puts have an implied vol of 16.2663%, we see a net of 0.4525% (as per lower pane).
This is one of my favourite sentiment indicators and it's incredibly neutral right now. When I see call vols moving higher on a relative basis, showing traders are buying upside structures I know the market is warming to upside in the underlying. This heightens my 1961 to 1762 range for the next month or two.
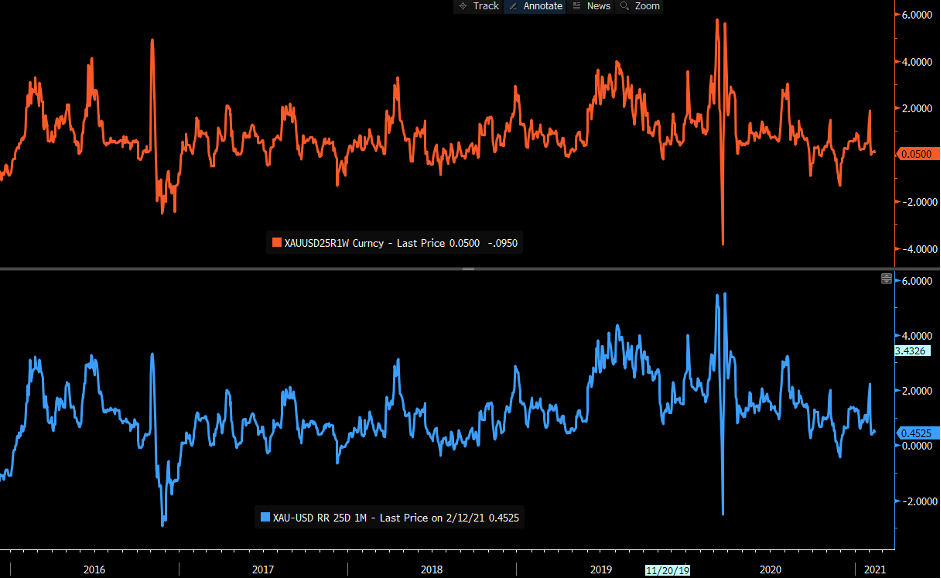
(Source: Bloomberg)
If I look at gold 1-week implied volatility I see this currently at 14.75% - this is the annualised number derived from 1-week gold options. As we see when we chart this it's well off the lows seen in December 2019 of 5% but hardly scream that traders see increased movement in the price. Above 20% and things get interesting. Again, another indicator I will be keenly watching.
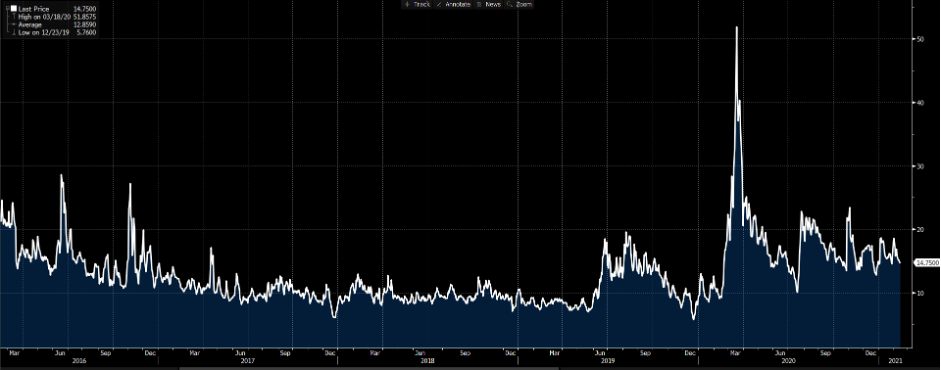
(Source: Bloomberg)
In fact, if we use this implied volatility we can source the implied move on the week (divide 14.75/7.1, with 7.1 being the square root of 50 trading weeks in a year), which implies a move of $38 or 380 pips higher or lower. By projecting this onto the chart we get an implied move on the week of 1862 to 1786 (with a 68.2% level of confidence or one standard deviation) and 1900 to 1748 (with a 95% level of confidence or two standard deviations). I have drawn them here and I can use these in the near-term to define areas of possible reversals.
So, some levels I'm using to define my short-term view, whilst understand the longer-term macro view too. It’s important with gold to hold an open mind. Ready to trade the opportunity? Trade Gold long or short now.
Related articles


Ready to trade?
It's quick and easy to get started. Apply in minutes with our simple application process.
The material provided here has not been prepared in accordance with legal requirements designed to promote the independence of investment research and as such is considered to be a marketing communication. Whilst it is not subject to any prohibition on dealing ahead of the dissemination of investment research we will not seek to take any advantage before providing it to our clients.
Pepperstone doesn’t represent that the material provided here is accurate, current or complete, and therefore shouldn’t be relied upon as such. The information, whether from a third party or not, isn’t to be considered as a recommendation; or an offer to buy or sell; or the solicitation of an offer to buy or sell any security, financial product or instrument; or to participate in any particular trading strategy. It does not take into account readers’ financial situation or investment objectives. We advise any readers of this content to seek their own advice. Without the approval of Pepperstone, reproduction or redistribution of this information isn’t permitted.