- English
- 中文版
Analysis
A traders’ week ahead playbook – the eyes of the market turn to Europe

The US500 gained 1.9% on Friday bringing the loss on the week to 1% - the index closed at its absolute session highs, with 93% of stocks closed higher – the bulls need the index to break 3950, which could set off a trend, and looking at the net short position in the CFTC report (see below), if Friday’s rally follows-through then we could see some systematic players cover shorts, propelling the market higher – don’t discount the impact that may have on options market makers too, and the need to buy back delta hedges (pushing the US500 index higher) is also there.
US earnings trickle in this week, with 14% of the US500’s market cap reporting – see the calendar for more details on that below, but I’d imagine Netflix and Tesla will get a workout from clients.
12,230 is the range high and the level to watch in the NAS100, a break here could have big implications – happy to flip to short bias on the NAS100 through 11,400.
EU equity markets have held in, but this week we have political issues in Italy, and a decision regarding Nord Stream 1 (NS1) from Russia has the potential to inject some huge volatility in EU equities. As we discussed in the article on the Nord Stream 1 decision the market almost sees this as binary and could see relief, or clear worry, depending on what the Russians do after the maintenance has finished on Thursday – it could be a headline fest to navigate.
The USD rallied against all G10 margin FX last week (except the SEK and CHF) with the USDX stopping shy of 109 – the USD is clearly at the epicentre of markets and economics at present and a falling USD would be welcome music for equity and commodity CFD bulls. It's hard to say the recession trade is fully priced but much now relies on the USD and a rising USD is impacting EM, but in DM Europe is especially sensitive now as the ECB’s balance sheet is increasing at a clip (due to the assets it holds being priced in EUR) and this is feeding into further EUR weakness.
This dynamic makes this week’s ECB meeting big viewing – the ECB could use a stronger EUR but hiking by 50bp is a tough option, especially if Russia does not turn on the flow in NS1. They also need to offer a credible plan for dealing with the blow-out in Italian and Greek bond yields but leaving policy too loose could be a major issue too – as far as central bank consideration the ECBs job is as tough as it gets.
EURUSD traded into 0.9952 but has since pushed back about parity level and clients are modestly net long here (59% of positions are long) – With NS1 and the ECB in play it’s no surprise EUR implied vol is high – movement is expected. Personally, I’d be far more convinced to turn less bearish if the 3-day EMA crossed above the 8-day EMA, but with a binary vol event on the horizon, if I saw the Russians turn on the taps sufficiently, we could see 1.0200 by Friday’s close. If the Russians delay the flow, then we could be trading sub-0.9800.
USDJPY may have seen its highs – I like this pair lower in the very short-term, and on the 4hr I see an EMA bearish crossover (3s & 8s) and the ROC (5) is lower. With the Fed blackout period in play (there are no more scheduled Fed speakers until the FOMC meeting) and limited tier 1 US data due this week, the US bond markets (a key driver of the USD) will focus on external factors (NS1 and the ECB) – I like USDJPY into 137.50 but have a limited conviction on that call.
Commodity CFD remain a core focus too, with wheat having its worst week in a decade falling 12.6%. SpotBrent traded into the levels it was just prior to the Ukraine invasion, now working within a falling wedge where an upside break could make for a more bullish tape. A break below $95.50 would clearly be positive though for risk assets, with US 1-yr inflation expectations having recently fallen from 6.37% in March to 3.60% - I do sit in the camp that last week's 9.1% June CPI print will mark the peak in inflation, although it will be a grind lower.
So, another big week ahead.
The week ahead event risk calendar and trader playbook – you can click through to the Twitter thread for increased clarity.
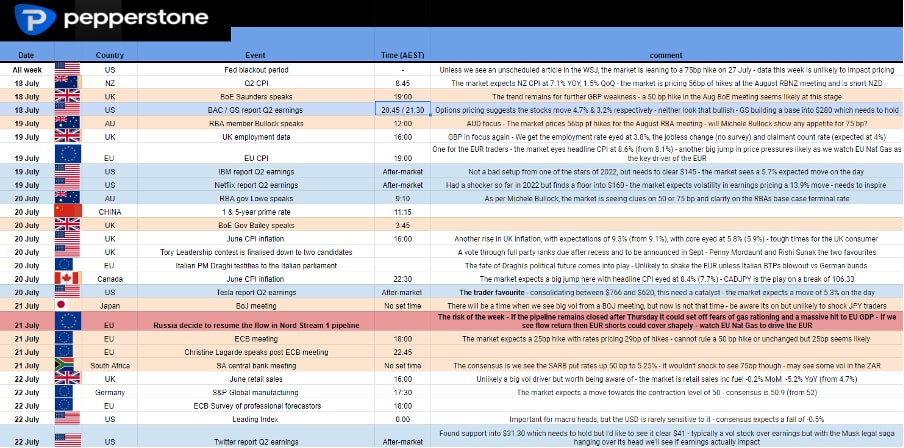
(Source: Pepperstone - Past performance is not indicative of future performance.)
Implied volatility Matrix – taking into consideration the event risk disclosed above we look at the implied moves, which are derived from options pricing. We can calculate the expected move on the week and project to get an expected trading range with a 68.2% and 95% level of confidence. Good for understanding the perceived risk on each asset and for mean reversion.Clearly, Europe gets the attention this week – rightly so, with Nord Stream 1 – see my take on why this is important.
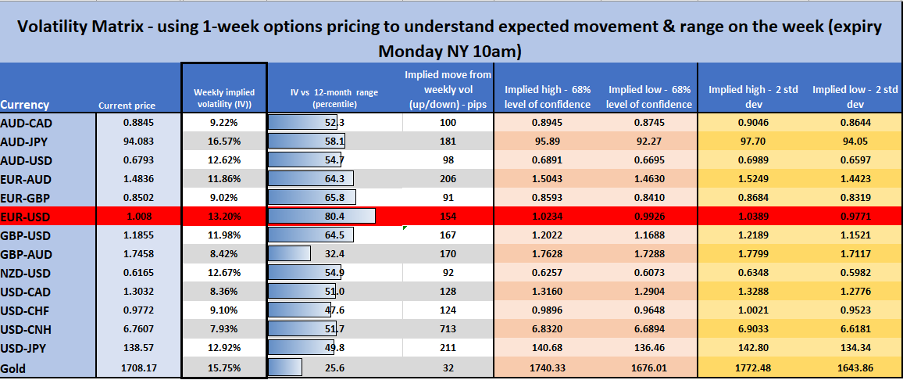
(Source: Pepperstone - Past performance is not indicative of future performance.)
Rates Review – we look at interest rate market pricing for the upcoming central bank meeting and then the step up (in basis points) to the following meetings. You can see the market prices 80bp of hikes for the next FOMC meeting and prices the fed funds rate at 3% in September. The market prices 56bp of hikes for the next RBA meeting on 2 August. We see ECB’s deposit rate expected at -0.29% this week, which implies a 25bp hike is fully priced.
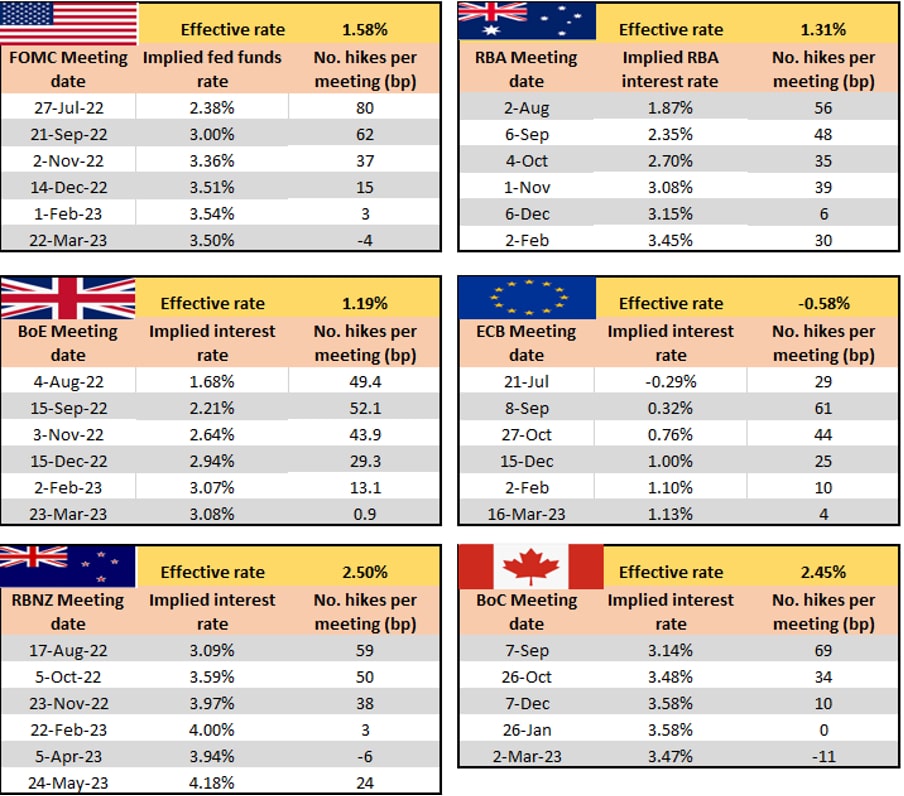
(Source: Pepperstone - Past performance is not indicative of future performance.)
Positioning – We assess the weekly Commitment of Trader report and TFF report – for those new to the report, here’s an explainer.
We see crude net longs have been pared right back to the lowest level in 5-years. EUR shorts have increased but are not yet at extremes – this may be different if you were to look out of futures position, but we can see leveraged traders increased net shorts on EUR, which won’t surprise – they’d be the first to cover if Nord Stream 1 resumes the flow this week.
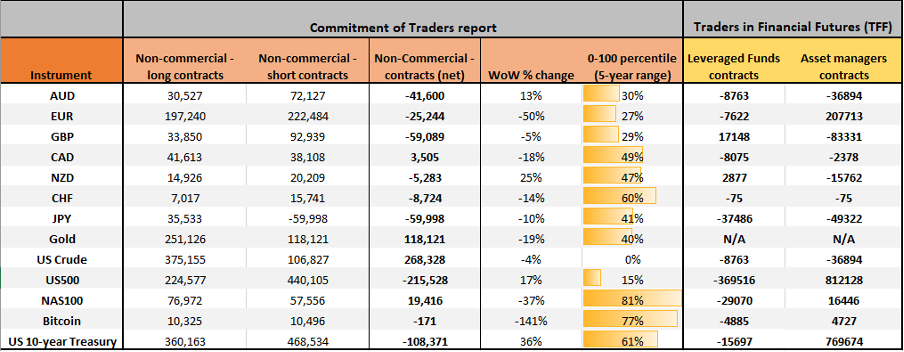
(Source: Pepperstone - Past performance is not indicative of future performance.)
Related articles


Ready to trade?
It's quick and easy to get started. Apply in minutes with our simple application process.
The material provided here has not been prepared in accordance with legal requirements designed to promote the independence of investment research and as such is considered to be a marketing communication. Whilst it is not subject to any prohibition on dealing ahead of the dissemination of investment research we will not seek to take any advantage before providing it to our clients.
Pepperstone doesn’t represent that the material provided here is accurate, current or complete, and therefore shouldn’t be relied upon as such. The information, whether from a third party or not, isn’t to be considered as a recommendation; or an offer to buy or sell; or the solicitation of an offer to buy or sell any security, financial product or instrument; or to participate in any particular trading strategy. It does not take into account readers’ financial situation or investment objectives. We advise any readers of this content to seek their own advice. Without the approval of Pepperstone, reproduction or redistribution of this information isn’t permitted.