Aside from a market that has priced in a mild recession and sentiment is shot, here are a few things catching my eye:
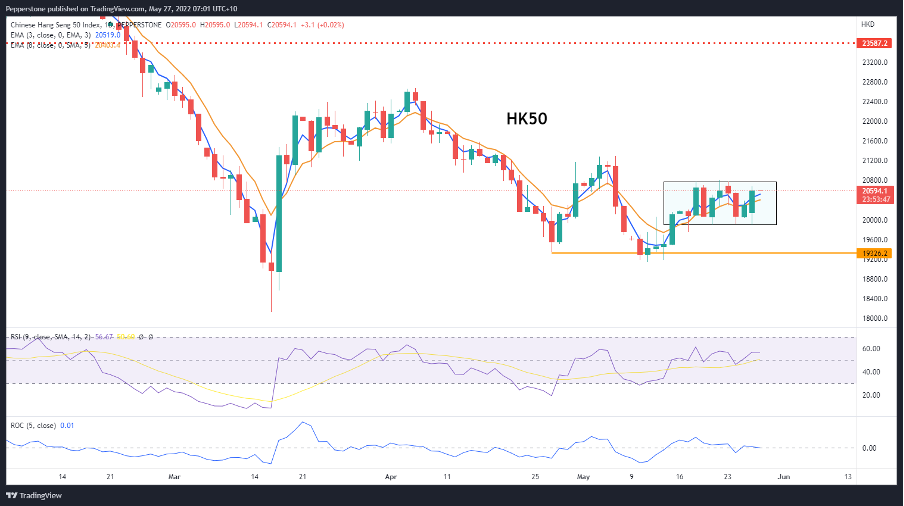
- China firing up – Alibaba and Baidu killing earnings expectations, some positive feel on China outlook- both share CFDs up 14%, watch the HK50 – can the cash market build on the goodwill? I like it higher in the short-term.
- US retailer earnings – Macy's, Dollar Tree are flying…arresting some fears from what we saw from Walmart and Target’s earnings call.
- Month-end flows – big moves lower this month in US equities, we now see rebalancing from pension funds to get weights back in line with client mandates – US investment banks saying they are seeing the biggest inflows into US equity funds since March 2020
- High yield credit working like a dream – spreads are coming in large – the corporate bond market is 4x the size of the equity market and EQUITY ALWAYS FOLLOWS CREDIT. We offer the HYG ETF, you can see this rallying hard.
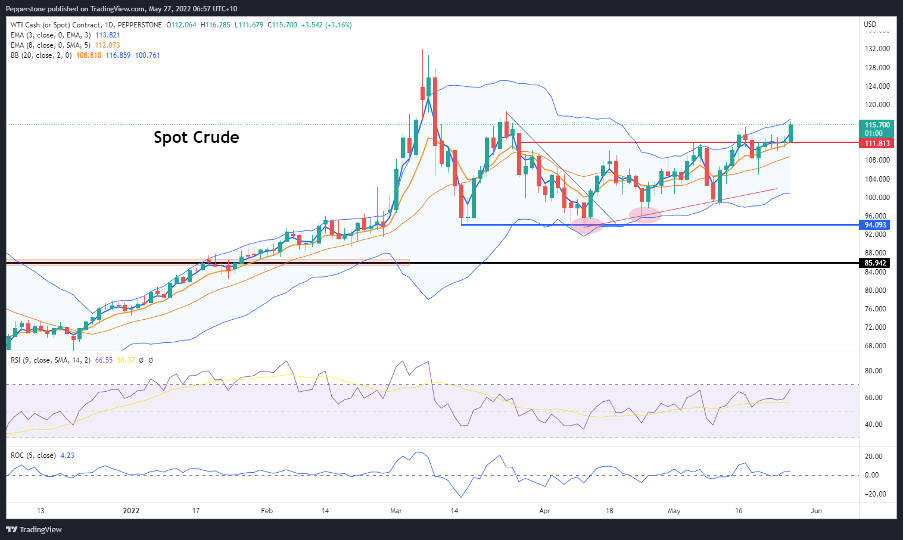
- Crude up big and breaking out – not sure how much of a positive this is as it raises inflation expectations but one for all the radars…feels like this could start to trend here..
- US 30-year mortgage rates are sliding – last week they were 5.25%, now they’re 5.1%
- Rate hikes have been priced out – again, not sure that is a true positive as we need the Fed to impact inflation and the fact the data flow has been soft is why hikes have been priced out – for context of 4 May the market was pricing a terminal fed funds (the highest point the Fed are expected to take the fed funds rate in this cycle) of 3.11%, now this is 2.51%
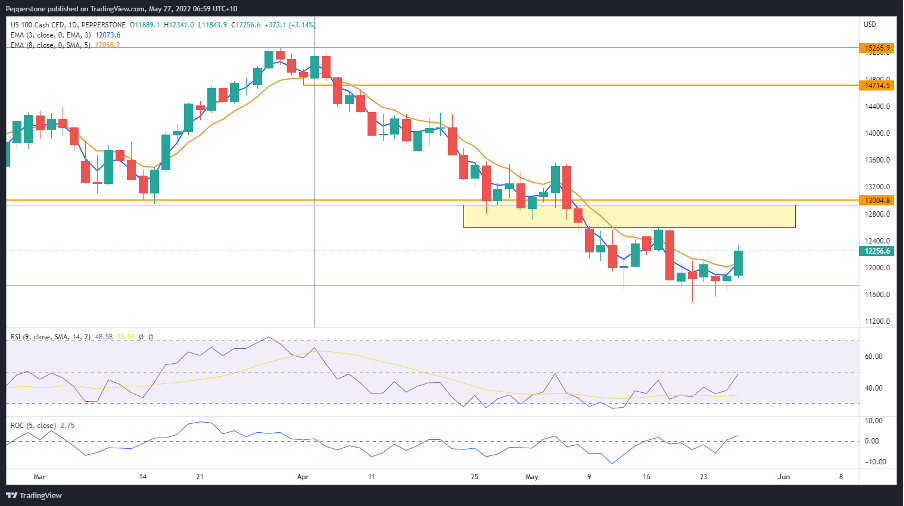
The month-end flow is the big factor and if you look at volumes in S&P 500 futures they are poor, all sounds like artificial flow – reeks of a bear market rally (BMR) – and as we know with BMR’s trade them, but don’t trust them!
SpotCrude daily chart

(Source: TradingView - Past performance is not indicative of future performance.)
NAS100 daily chart

(Source: TradingView - Past performance is not indicative of future performance.)
HK50 daily chart

(Source: TradingView - Past performance is not indicative of future performance.)
Related articles
Ready to trade?
It's quick and easy to get started. Apply in minutes with our simple application process.
The material provided here has not been prepared in accordance with legal requirements designed to promote the independence of investment research and as such is considered to be a marketing communication. Whilst it is not subject to any prohibition on dealing ahead of the dissemination of investment research we will not seek to take any advantage before providing it to our clients.
Pepperstone doesn’t represent that the material provided here is accurate, current or complete, and therefore shouldn’t be relied upon as such. The information, whether from a third party or not, isn’t to be considered as a recommendation; or an offer to buy or sell; or the solicitation of an offer to buy or sell any security, financial product or instrument; or to participate in any particular trading strategy. It does not take into account readers’ financial situation or investment objectives. We advise any readers of this content to seek their own advice. Without the approval of Pepperstone, reproduction or redistribution of this information isn’t permitted.


