- English
- 中文版
With a quiet session for markets with Thanksgiving impacting participation, it’s periods like these we can re-group, catch a breath and get the mind back in focus. It offers a chance to look at trends, set-ups, positioning and impending catalysts that feed into our probability assessment and cultivate the plan of attack for the week ahead.
With that in mind, here are a few highlights for the week ahead:
- US ISM manufacturing (Thursday at 2 am AEDT) – consensus 61.0 (from 60.8)
- US non-farm payrolls (Saturday 00:30 AEDT) – 500k jobs, participation rate 61.7%, U/R 4.5%
- Canada employment data (Saturday 00:30 AEDT) – no consensus.
- China manufacturing PMI (Tuesday 12:00 AEDT) – 49.8 (49.2)
- Aussie Q3 GDP (Wednesday 11:30 AEDT) - -2.6% QoQ, +3% YoY
- OPEC meeting (Thursday)
- Powell and Yellen testify before the Senate and House Panel
- Eurozone inflation estimate (Tuesday 21:00 AEDT) – 4.3% YoY (4.1%)
I thought it was a chance to put a few charts that are on my radar. As always, these charts just rationalise aggregate behaviours and flow, and allow us to get an understanding of how strategies may play out – these I define as momentum, trend-follower, mean reversion, tactical or relative value (long/short). Then we break down into timeframe – scalp, day trade, swing, position-trader. It’s fine to run multiple concurrently but as long as each one is defined within set perimeters.
US500 – a range of 4720 to 4630 seems to have been established – Happy to play that in the short-term, and the market should reveal itself next week - but if we’re going to see a seasonal rally then a close through 4720 would be important and I’d be a buyer of strength on this development. Looking into the markets we see breadth has really pulled back but yet the index has held in remarkably well. We're seeing some modest out-romance from defensive areas of the market, but there are few red flags at this stage. Should equities start to trend in a direction it could have big implications for FX markets.
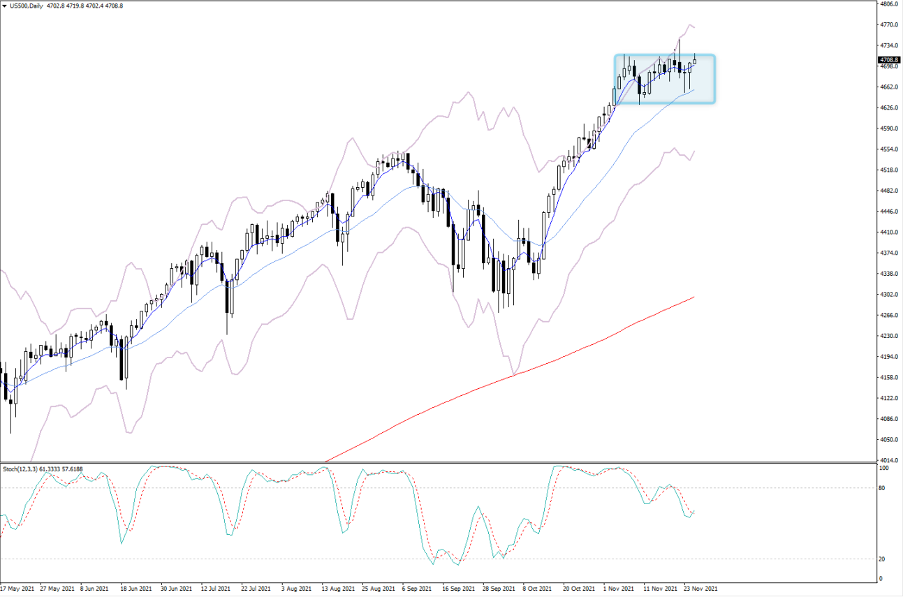
(Source: MetaTrader - Past performance is not indicative of future performance.)
USDCHF – Typically USDCHF is a reversal of the moves seen in EURUSD, with the 20-day rolling correlation (by value) at -0.99. We’ve seen price break and close through the 0.9332 resistance. The pair holds the 5-day EMA and is trending nicely from the rising trend from the Jan lows. The 30 Sep spike high (0.9368) may act as a headwind but a break here and the 1 April highs of 0.9472 come into play.
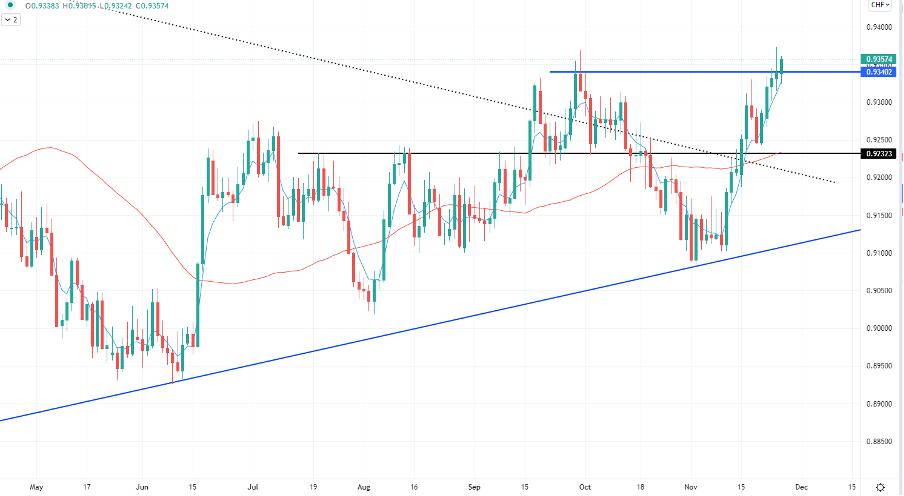
(Source: TradingView - Past performance is not indicative of future performance.)
CADJPY – Price has made a clean break of channel resistance or a bull flag if you will. The technical target if this starts to really move is closer to 100 – obviously if it was to get there the duration is weeks not days, and that may be a view to trade in and out of. I’d like a bit more of a move higher through 91.62 to feel this is really going to trend, and it wouldn’t surprise to see sellers here, so a level perhaps for a quick scalp. I like the hold of the 50-day MA, and it is one I could start looking at longs in small size. The obvious risk to CAD longs is a rising VIX index and drawdown in the S&P500 and crude, with crude eyeing next weeks OPEC meeting.
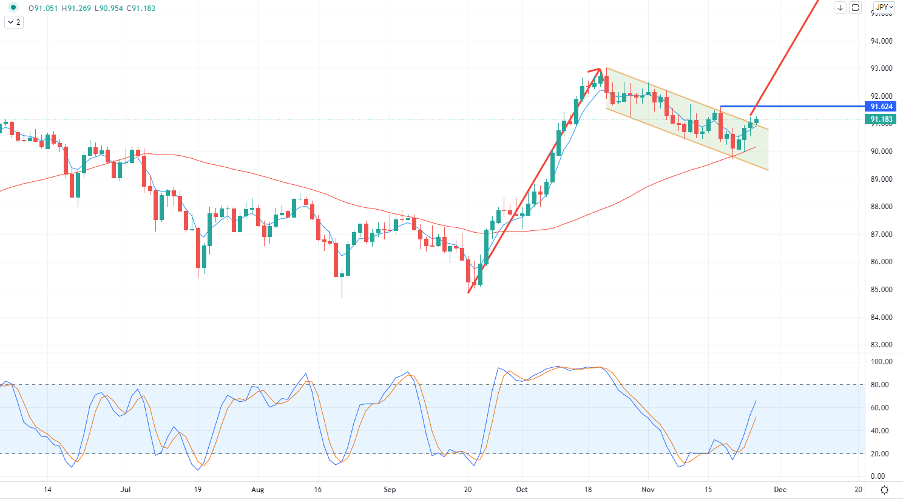
(Source: TradingView - Past performance is not indicative of future performance.)
USDMXN – The MXN is interesting on a number of fronts – firstly, the new central bank governor, Victoria Rodriquez, is largely untested in a monetary policy role and few deeply understand her views on policy. Many have questioned the central bank’s independence given her appointment and the MXN has found sellers as a result. Secondly, there is a debate within the Mexican central bank for a more gradual hiking cycle or whether to go hard on the hikes, in turn, risking unsettling markets.
Technically, USDMXN has broken horizontal resistance – the weekly gives good oversight. If volatility does pick up and we see risk aversion into December, USDMXN should benefit from this. This is one that could really start to move, as is the case in USDZAR.
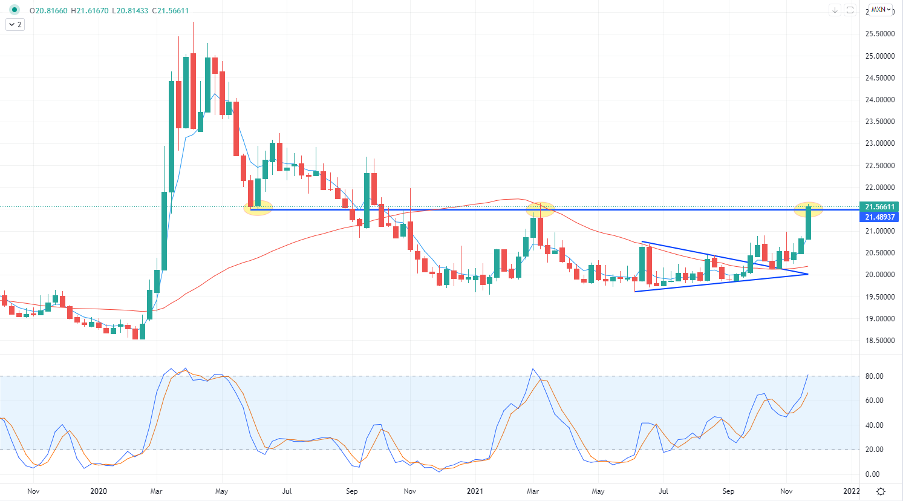
(Source: TradingView - Past performance is not indicative of future performance.)
Cross asset volatility – here I’ve mapped out (from top to bottom) reads of implied volatility in interest rates, US bonds, S&P500 and G7 currencies. We’ve seen the highest level of vol in rates and bonds really since the pandemic, which has spilt over into FX markets, with the USD largely in play here as it goes on a one-way march. I guess it’s unsurprising to see the VIX is struggling to hold above 20% given S&P500 1-month realised vol is 6% and eyeing the lowest levels of the year – the difference between what is implied and what it has been realising is nearly 8ppt.
Still, it’s great to see a bit of vol in FX markets, and that’s largely a result of vol in US Treasuries, notably in 2- & 5-year Treasuries.
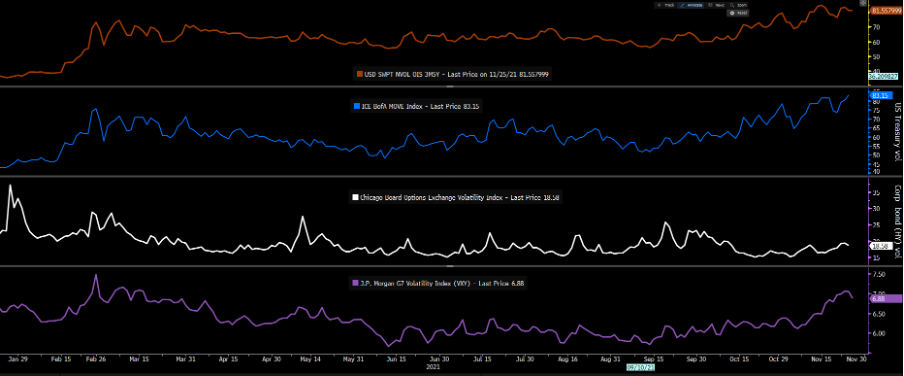
(Source: Bloomberg - Past performance is not indicative of future performance.)
Related articles
Ready to trade?
It's quick and easy to get started. Apply in minutes with our simple application process.
The material provided here has not been prepared in accordance with legal requirements designed to promote the independence of investment research and as such is considered to be a marketing communication. Whilst it is not subject to any prohibition on dealing ahead of the dissemination of investment research we will not seek to take any advantage before providing it to our clients.
Pepperstone doesn’t represent that the material provided here is accurate, current or complete, and therefore shouldn’t be relied upon as such. The information, whether from a third party or not, isn’t to be considered as a recommendation; or an offer to buy or sell; or the solicitation of an offer to buy or sell any security, financial product or instrument; or to participate in any particular trading strategy. It does not take into account readers’ financial situation or investment objectives. We advise any readers of this content to seek their own advice. Without the approval of Pepperstone, reproduction or redistribution of this information isn’t permitted.


