- English
- 中文版
The Daily Fix: Some of the most interesting charts in the world

S&P 500 daily % ranges. We closed the S&P 500 cash session -1.6%, with the index tracking a 2.7% range (or 70-points). The bulls will like the recent reduction in the daily trading range and today was the narrowest since 26 February. That said, they won’t like the increased volume seen on a down day.
One interesting angle is that despite the narrower range, it hasn’t resonated as it should in the VIX index (30-day implied volatility of the S&P 500), which has remained above 50%, closing at 53.5% and lower by 3.5 vols on the day. We can equate that the VIX index at 53% implies a daily move of 3.6% (higher or lower) and a potential range of 7.2%.
Workings – (70/2 = 35)…((35/2626 prior S&P 500 close) *15.9) = 20.6%
We use 15.9 as it is the square root of time – SQRT/252 trading days in a year.
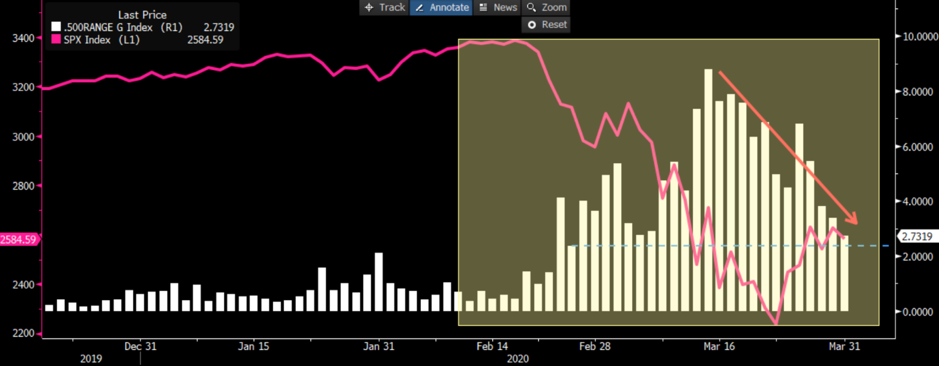
"Source: Bloomberg"
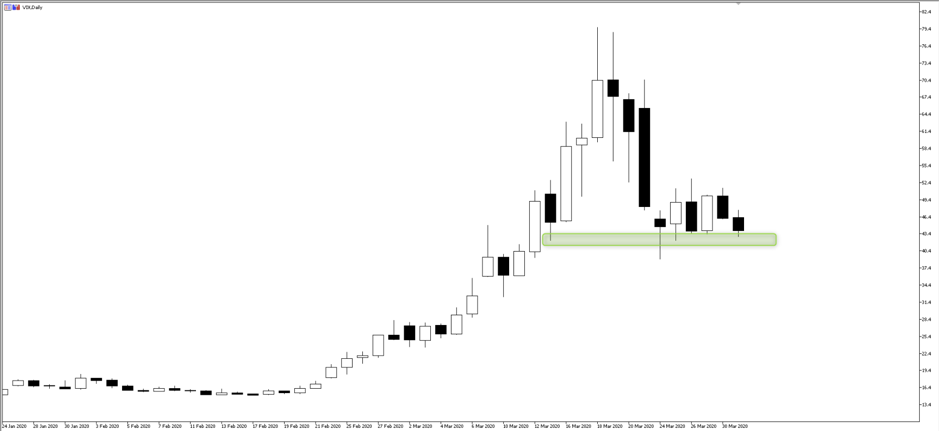
So, a 2.7% daily range equates to VIX index closer to 20%. We ask, is the options market correct in its expectations of a renewed pick up in range expansion?
We can trade this through the VIX futures – our price follows the front-month, as you can’t get direct exposure to the VIX cash index. There is a fair value weighting between the cash VVIX and futures. A move through 50 in VIX cash, would resonate in the VIX futures and would state a move through the support zone where traders have been vol buyers. A reduction in vol would be huge for risk markets, especially if we get back into 20%.
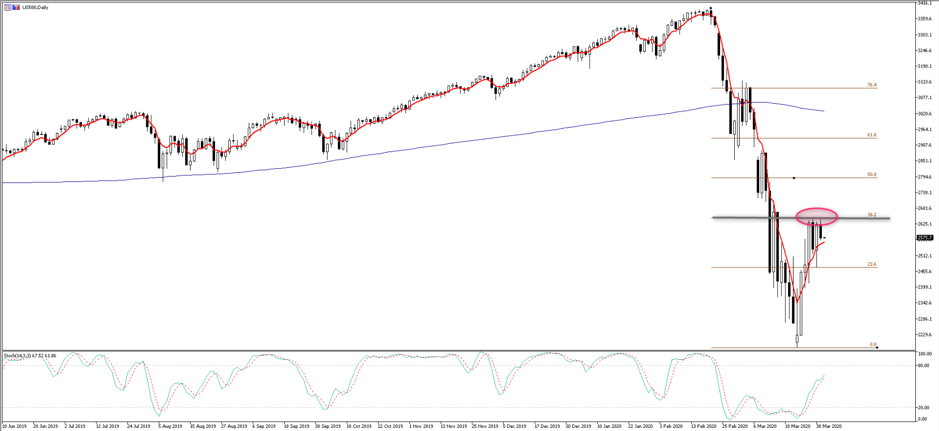
US500 (S&P 500) – The S&P 500 closed -1.6%, with futures down a further 1.2% in Asia. The set-up has resonated with traders, where once again the cash and futures index have rejected the 38.2 fibo of the Feb-March sell-off. An upside break could still play out, where I would focus on taking long exposures on a closing break through the 38.2 fibo level of 2644. This would likely be a trigger for a reduction in equity volatility.
That said, a close through the 5-day EMA looks more likely though, with 2469 being my key line in the sand and one where I will turn far more bearish again - Expect the vol buyers to be vindicated on a break here and talk of a re-test of the 23 March lows to pick up.
USDJPY – The Fed has opened swap lines to a range of global central banks, with the BoJ and ECB taking the lion share of $370b now transacted since launching the USD swap facility. Overnight, we saw a new facility being introduced, offering foreign central banks the ability to swap their holdings of US Treasuries for USDs at a cost of 35bp. It seems this new facility will not be used that actively, but it shows a commitment to keep USD funding down, and we see USDJPY cross-currency basis swaps now at -5bp having been as wide as -153bp on 19 March. A clear USD negative.
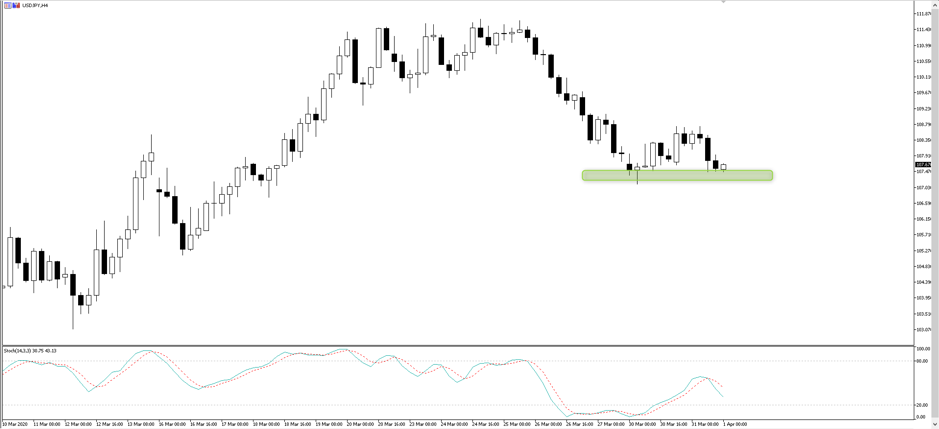
The best way to play this it seems is via USDJPY - On the four-hour chart, we see strong support into 107.38 – if this gives way, I will look at short positions here as a momentum play.
The material provided here has not been prepared in accordance with legal requirements designed to promote the independence of investment research and as such is considered to be a marketing communication. Whilst it is not subject to any prohibition on dealing ahead of the dissemination of investment research we will not seek to take any advantage before providing it to our clients.
Pepperstone doesn’t represent that the material provided here is accurate, current or complete, and therefore shouldn’t be relied upon as such. The information, whether from a third party or not, isn’t to be considered as a recommendation; or an offer to buy or sell; or the solicitation of an offer to buy or sell any security, financial product or instrument; or to participate in any particular trading strategy. It does not take into account readers’ financial situation or investment objectives. We advise any readers of this content to seek their own advice. Without the approval of Pepperstone, reproduction or redistribution of this information isn’t permitted.