- English
- 中文版
The Daily Fix: A risk on nirvana impacting global equity markets

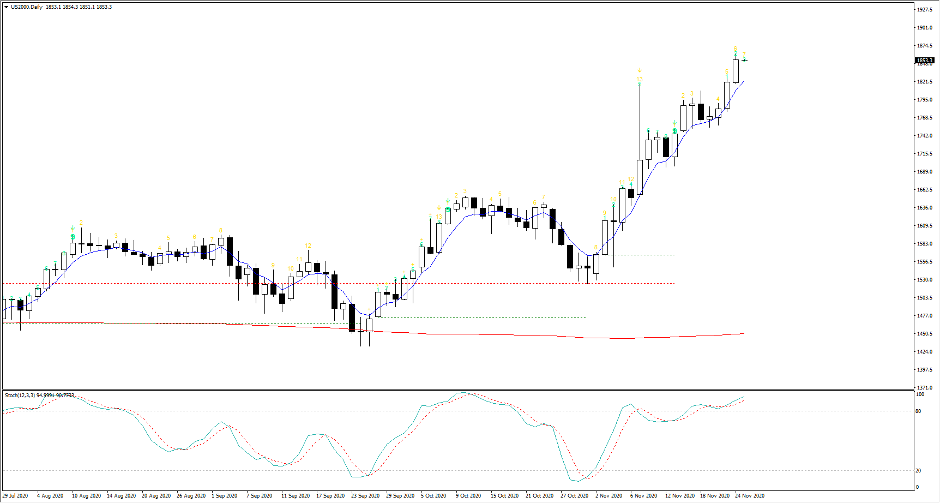
It's like a risk positive nirvana has descended over the capital markets and traders have very little to trouble themselves with other than going with the flow. The headlines centre on the Dow hitting 30k, although it’s the Russell 2000 (US2000) that's the market to watch in my opinion.
The rotation into value sectors of the market is real with the energy sector up 47% from October lows and financials breaking out to the best levels since February (XLF ETF CFD). Small caps are crushing large caps and long US2000/short NAS100 (as a pairs trade) is a momentum dream. S&P 500 cyclical sector share CFDs are destroying defensive sectors and the S&P 500 industrial utility ratio. A classic warning signal that has pushed up to the highest levels since October 2018.
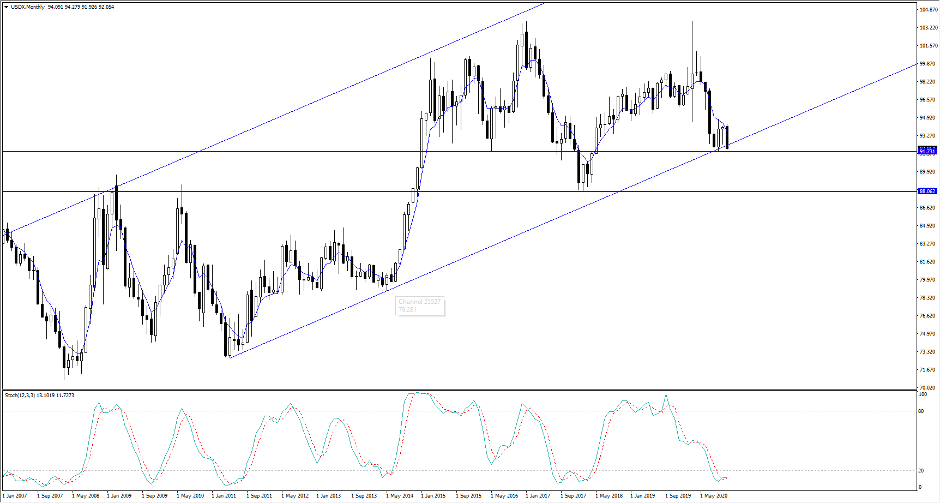
Breadth is solid, correlations between share CFDs are falling hard, bond yield curves are steepening, the USD is lower and Emerging Markets (EM) are flying. The new dynamic is that crude has broken out and that's clearly aiding sentiment, with inflation expectations (i.e. ‘breakevens’) rising faster than nominal US Treasuries which has lowered real yields. The fact gold and silver have been offered despite this backdrop is a function of traders looking at the opportunity cost of holding gold, when energy, financials and crypto CFD are flying.
A consistent barrage of positive news flow about vaccines, a failure for high frequency and real-time data to be dramatically impacted by the COVID restrictions and a positive vibe towards Janet Yellen’s appointment as UST Secretary are all contributing towards the flow. A smooth transition of power towards the Biden administration is also a catalyst. Naturally, we can add factors like FOMO, technical buying and dealer’s delta hedging as short-dated single-share CFD call options move into the money and the writers of these options are forced to hedge through buying the underlying. It’s all there.
I guess the concern I've here is that the sheer love for risk assets is huge and market participants are so incredibly confident of the 2021 recovery theme that they're bringing future performance to the present.
If we look at the market internals the S&P 500 is 15% above its 200-day MA, the biggest premium since 2009. 39% of S&P 500 companies closed at a 4-week high, which is not too much of a worry (my warning sign when this percentage is above 60%), but we see 83% and 90% of constituents are above their 20 and 200-day MA, which is lofty. We also see 22% of share CFDs close with an RSI above 70, while 11% of the index closed above the upper Bollinger band. The internals are suggesting that the elastic band is primed and ready for modest mean reversion.
Some look at the CNN Fear and Greed which sits towards the more extreme readings. You can see the variables that make up this index and one would think this would be closer to 95% if the VIX index was firmly sub-20%.
Either way, it’s hard to see what derails this juggernaut and while the list of considerations that can cause higher volatility and drawdown in risk is known and not affecting in any capacity. Equities are overbought and over-loved, and we can see that from the internals but what causes a reversal remains unclear.
Related articles


Ready to trade?
It's quick and easy to get started. Apply in minutes with our simple application process.
The material provided here has not been prepared in accordance with legal requirements designed to promote the independence of investment research and as such is considered to be a marketing communication. Whilst it is not subject to any prohibition on dealing ahead of the dissemination of investment research we will not seek to take any advantage before providing it to our clients.
Pepperstone doesn’t represent that the material provided here is accurate, current or complete, and therefore shouldn’t be relied upon as such. The information, whether from a third party or not, isn’t to be considered as a recommendation; or an offer to buy or sell; or the solicitation of an offer to buy or sell any security, financial product or instrument; or to participate in any particular trading strategy. It does not take into account readers’ financial situation or investment objectives. We advise any readers of this content to seek their own advice. Without the approval of Pepperstone, reproduction or redistribution of this information isn’t permitted.