View all Commodity guides

Razor Gold vs standard gold trading: which suits your strategy?

How to trade gold
Learn to trade gold and explore the fundamental reasons why investors buy and sell gold.
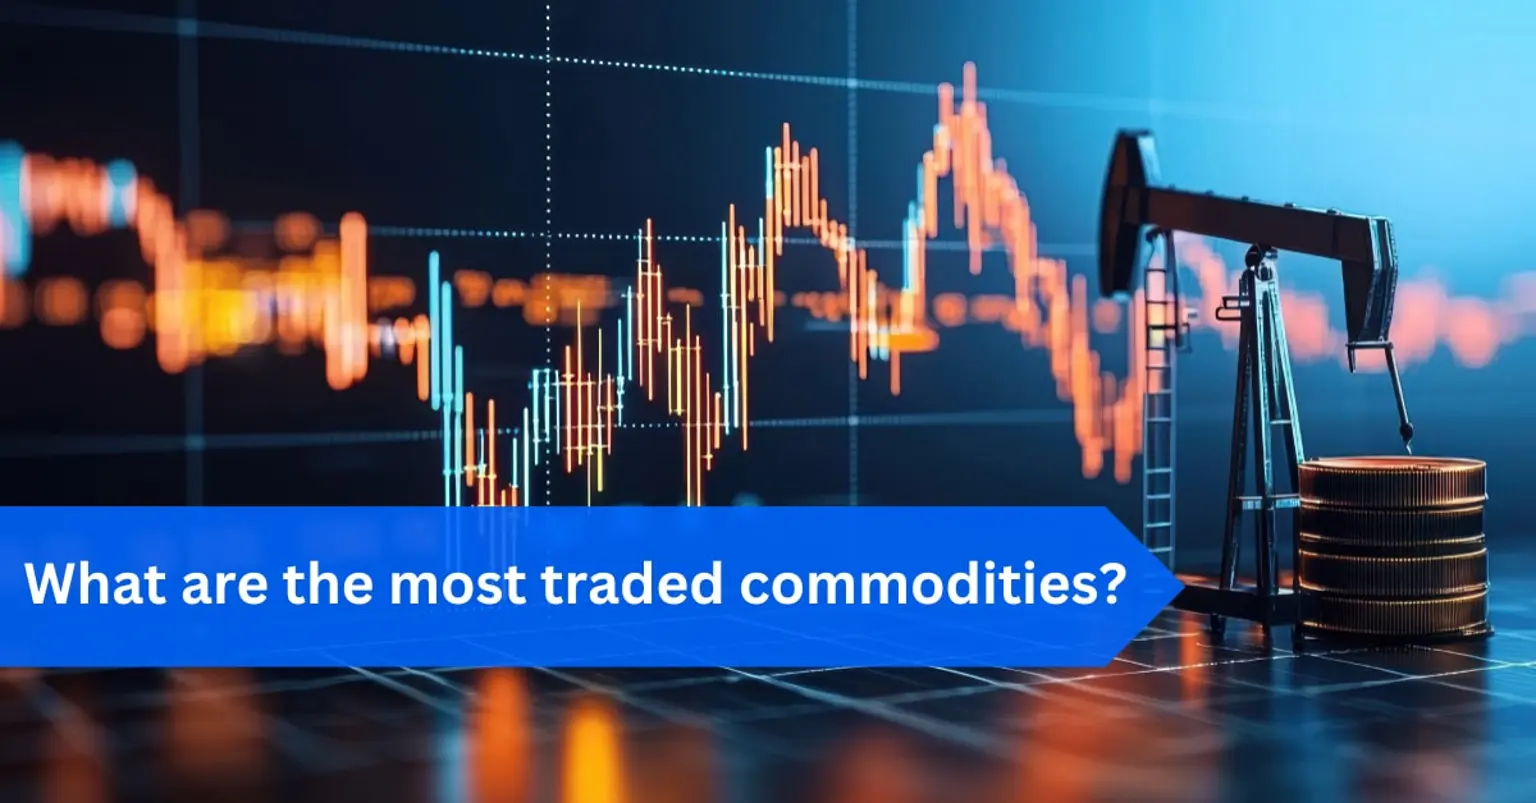
The most traded commodity CFD in 2024
In 2024, commodity CFD like crude oil, natural gas, gold, and agricultural products have dominated trading activity.
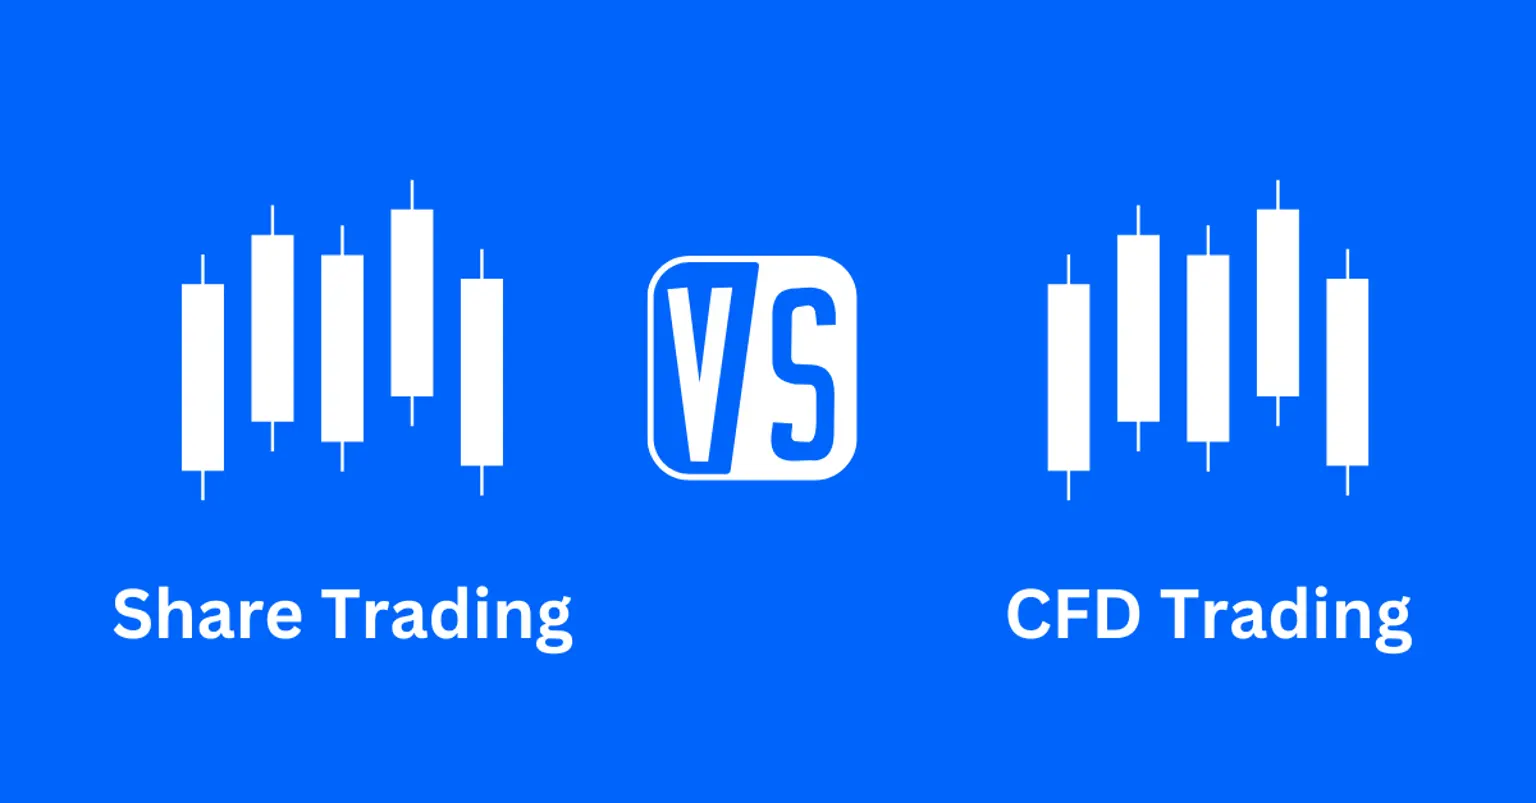
share CFD trading vs CFD trading: What’s the difference?
Discover the key differences between share CFDs trading and CFD trading
How to choose the best CFD broker
This guide breaks down what you need to look for in a CFD broker
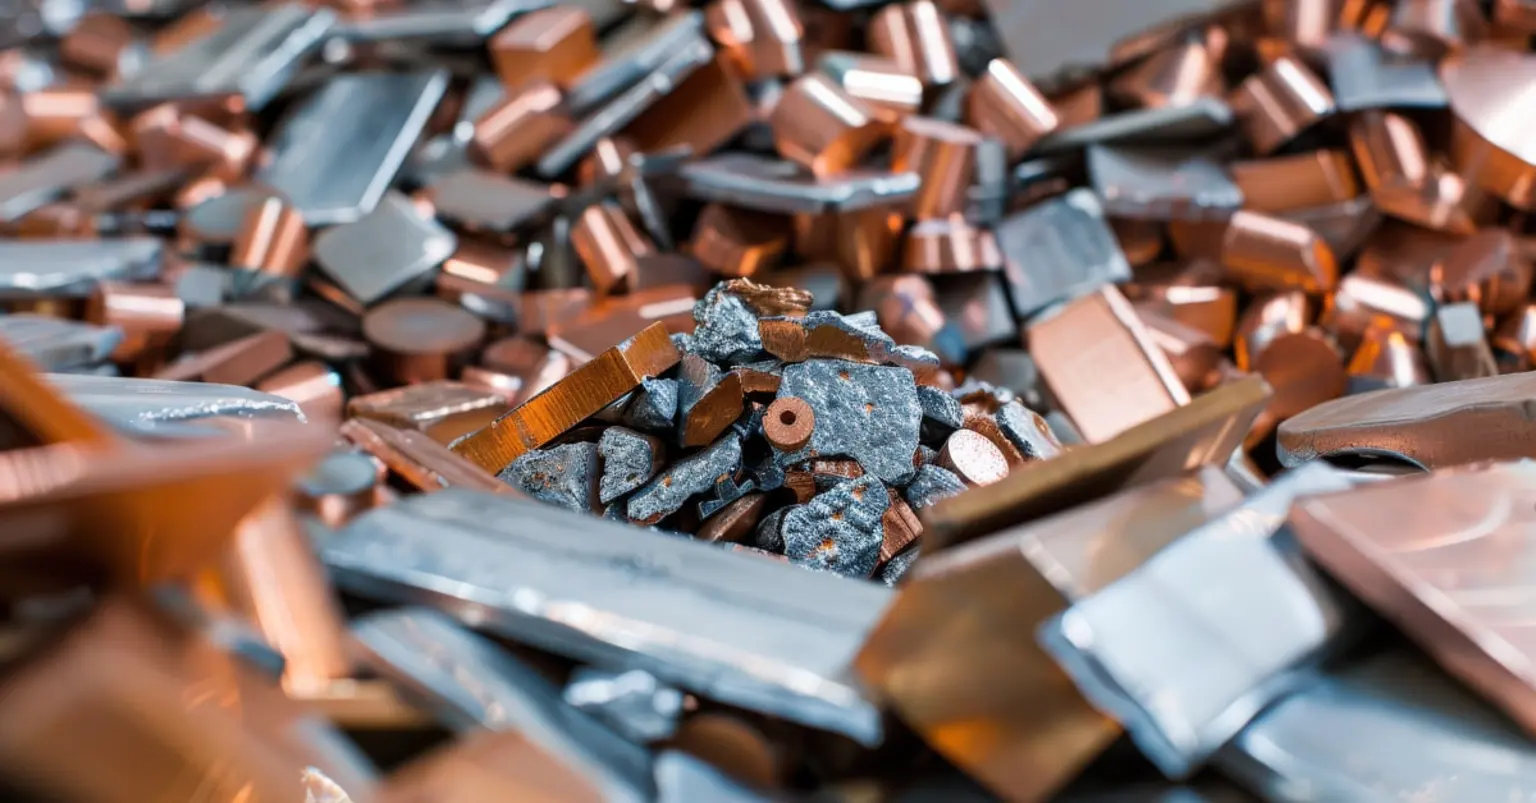
What are base metals and how do you trade them?
With lower entry costs compared to precious metals, base metal markets are accessible.

Understanding margin in CFD trading
Successful CFD margin trading relies on a solid risk and trade exposure management strategy.
How to start trading silver
As both a precious and industrial commodity, silver can offer distinct opportunities while managing risk exposure.

What is CFD trading and how does it work?
CFDs offer a flexible way to speculate on financial markets or hedge an existing portfolio.
The team behind the insights
From market strategies to financial writing, our team creates the content that helps you grow.

Caroline Tidman
Head of Content

Dilin Wu
Research Strategist

Evan Rouse
Financial Writer