- English
- 中文版

I've argued that the biggest risk to equity appreciation is either evidence that US economics are rolling over, or that we see inflation starting to get out of hand. Right now neither looks that concerning. If we’re looking at other major forces which turn this trend lower in equity, I'd also add that a pullback could come from a Democrat win in November. Although, that in itself won’t hit risk given its largely in the price. However we'll explore the statement of an “end of shareholder capitalism”, and what exactly that looks like.
It doesn’t feel like it comes from the Fed, even though they may at some stage, hint that parts of the market ‘are frothy’. But will the market really believe they are going to take away the punch bowl when so much retail capital has moved into Apple, Tesla, Amazon and the like? It seems unlikely given the Fed seems to be targeting a higher share CFD market to drive the wealth effect.
The bond market is key, but the Fed won't let selling get out of hand.
If we see selling in the bond market (higher yields), which is really the biggest worry for equity markets, then it simply increases the scope for the Fed to adopt yield caps. This subsequently means unlimited bond-buying, again good for equities.
We also need to consider that a fiscal stimulus package of around $1.5t is likely in September, which will significantly boost personal income and support economics, albeit temporarily. While the optimist in me also sees risks of a vaccine getting FDA approvals in the months to come, this coulc lift sentiment, especially if we see increased re-openings into the November election.
Market breadth should be a major consideration for traders
Amid all of these fundamental forces and incredibly high valuations, one factor that is screaming out is the poor market breadth. This was seen front and centre on Thursday when the S&P 500 rallied 0.3%, however, only 30% of the index closed higher - a statistic reminiscent of the Dot-Com bubble of 1999-2000.
In fact, we can also see that while the S&P 500 is up 3.5% YTD, 30% of the share CFDs in the index are still in a technical bear market. This is defined by being down 20%, while 21% of share CFDs are lower by more than 30%. It’s certainly not as rosy as it looks if we lift up the bonnet.
Poor market breadth is not a new consideration though, and we have long talked about a handful of mega-cap companies driving broad index appreciation, with the indices CFD being pushed up on incredibly limited participation. However, the extent of the divergence is there for all to see now, and there are few charts though that portray this better than the one below.
Market cap dynamics
- Yellow - The aggregate market cap of Tesla, Google, Facebook, Apple, Microsoft and Amazon
- Blue - the remaining 495 S&P 500 constituents
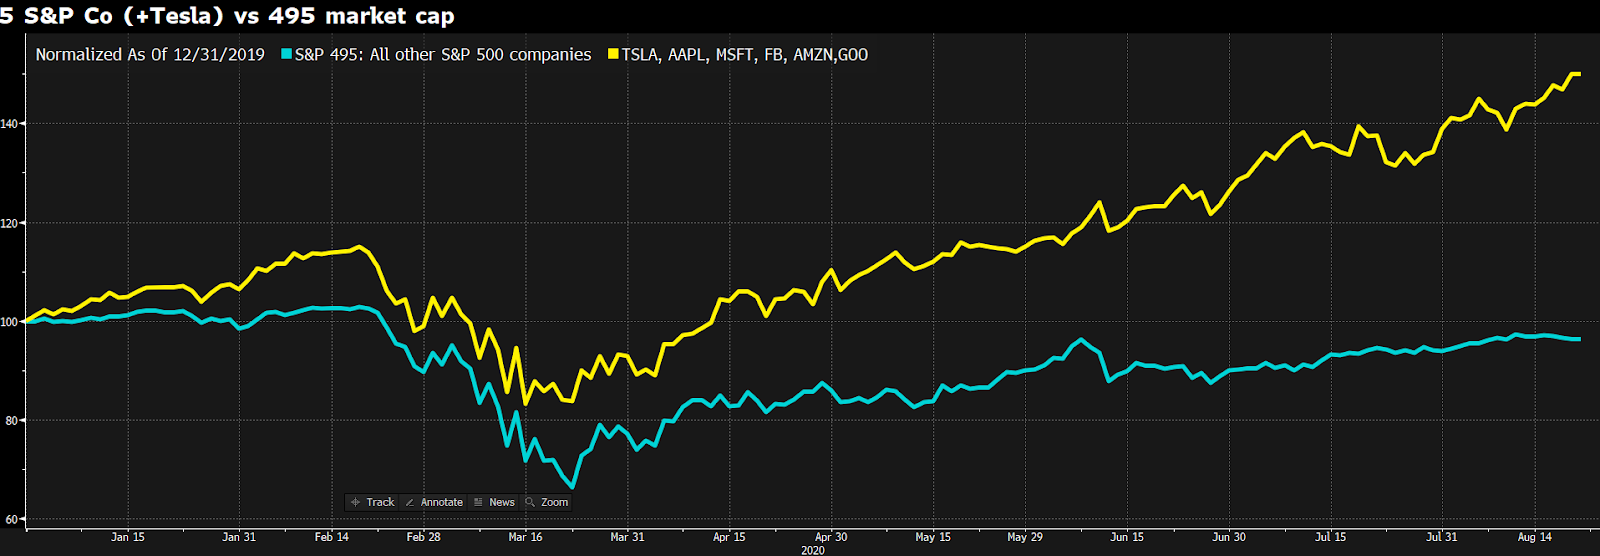
(Source: Bloomberg)
Here we see the combined market capitalisation of the ‘Big 5’ S&P 500 companies – Amazon, Apple, Facebook, Google, and Microsoft – and Tesla, which isn’t currently in the S&P 500 but will be included soon, moving aggressively higher. However, if we look at the change in market cap relative to the other 495 companies in the S&P 500 YTD, the divergence has been incredible. In fact, the market capitalisation of the rest of the S&P 500 has fallen over this period, while these six share CFDs have exploded.
There are many ways we can look at market breadth or participation, but one that I like to look at is the NYSE advance-decline line. Many will look at the number of companies above their 20-, 50-, or 200-day moving average, or perhaps that reside at 4- or 52-week high, but this is one chart that I feel best represents breadth.
As we see, there is clear divergence creeping in with the NYSE advance-decline line starting to rollover while the index makes new highs. This needs monitoring, as the two variables have held an incredibly strong relationship for years. Could this be a leading indicator for the equity market?

(Source: Bloomberg)
Another chart that is getting attention is the S&P 500 weighted by market cap and the S&P 500 weighted equally across each index constituent. As you can see this could be breaking out to new all-time highs.

(Source: Bloomberg)
Trading market breadth
Considering deteriorating market breadth as part of the trading decision is tough and requires patience. We need to understand what an actionable signal is, and what is noise. What can be stretched can get more so, but one thing is clear: if we lose the leadership from these tech names then it'll have huge implications for the US and global equity markets, spilling over into the USD, gold and other markets.
The gravy train may continue but the breadth story has the smell of 1999 and historically this concentration of leadership does not end well. Something doesn’t sit right, but timing as always in trading is key.
Ready to trade?
It's quick and easy to get started. Apply in minutes with our simple application process.
The material provided here has not been prepared in accordance with legal requirements designed to promote the independence of investment research and as such is considered to be a marketing communication. Whilst it is not subject to any prohibition on dealing ahead of the dissemination of investment research we will not seek to take any advantage before providing it to our clients.
Pepperstone doesn’t represent that the material provided here is accurate, current or complete, and therefore shouldn’t be relied upon as such. The information, whether from a third party or not, isn’t to be considered as a recommendation; or an offer to buy or sell; or the solicitation of an offer to buy or sell any security, financial product or instrument; or to participate in any particular trading strategy. It does not take into account readers’ financial situation or investment objectives. We advise any readers of this content to seek their own advice. Without the approval of Pepperstone, reproduction or redistribution of this information isn’t permitted.