- English
- 中文版
Interest rates markets betting on a Fed pivot – rate cuts incoming?

We heard talk yesterday that the FDIC may roll out an explicit blanket guarantee on all bank deposits, but this hasn’t gained any real momentum. There are too many questions as to the costs, how they would get around the morale hazard dilemma, and concerns this may incentivize risk-taking from banks.
The short sellers continue to own this space and the potential buyers see few reasons to step in front of this juggernaut at this juncture, despite the best efforts of various banks to showcase that deposits have been sticky. Interestingly, we’ve seen weekly data around the take up of the Fed’s emergency credit facilities, where we’ve seen a big fall in the take up of these loans, with just $5.3b tapped in the Fed’s discount window – its clear much of the recent borrowing had been sourced by First Republic Bank – so given the limited take up from other banks one could construe this as a positive for the banks.
Rates Review – market pricing for upcoming FOMC meeting and the step up (in basis points) per meeting
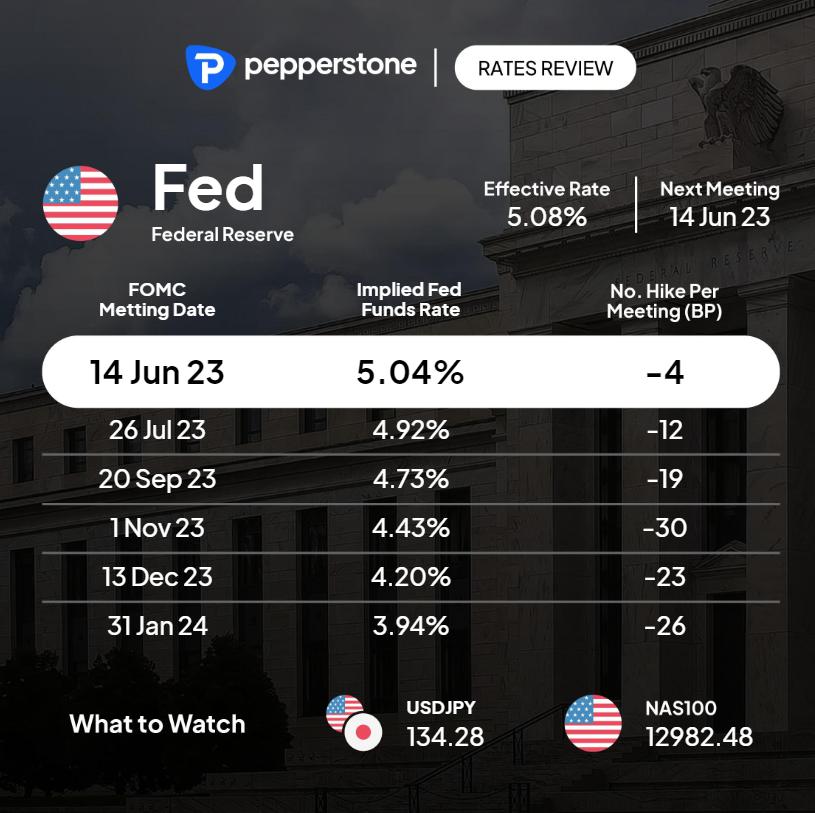
What we continue to see is moves in bank equity equating to increased interest rate cut expectations – if we look at market pricing and expectations of future Fed policy, we see 4bp of cuts priced for the June FOMC meeting and 13bp of cuts for July; essentially a 50/50 proposition of a cut. Going forward we see the market pricing 115bp of cuts by January and 230bp of cuts between 2H23 and December 2024.
One has to question the triggers for such a dramatic pivot from the Fed, but clearly, it would need to come in the June FOMC for this scenario of the July being a ‘live’ FOMC meeting – as always it pays to hold an open mind but these expectations do feel aggressive – US payrolls (today at 22:30 AEDT) would likely to come in weak with lower wage pressures, while next US CPI print would need to come in lower than 5.4% on the core measure. That would set a stage for a more dovish Fed, but only modestly.
To really justify this easing that’s priced, we need to see further anecdotal evidence of far tighter lending standards and that the well-speculated credit crunch starting to bite – the Fed’s quarterly Senior Loan Survey (released 8 May) will be insightful here given its focus on bank lending standards, where we’ve historically seen this survey correlate well with drawdown in the S&P500. Bank equity would need to further decline, amid renewed signs of deposit outflows.
There would be some using interest rates to hedge the impending debt ceiling drama. On one hand, we’ve seen headlines that President Biden and Congress may look at a short-term extension – perhaps through to September or October, offering more time to negotiate an agreement. On the other, the US Treasury cash levels are falling rapidly and now sit at $188b, a 40% decline in 5 days – the X-date (the date when Treasury may have to cut back on essential payments) in early June looms large.
The debt ceiling is clearly influencing demand to hold short-term US debt – In US trade, we saw Treasury sell $50b of 4-week bills at a yield of 5.84% and $45b of 8-week bills at 5.4% - both the highest yields on record - demand from investors was poor. We’ve some buying of equity volatility (the VIX has pushed above 20%) but outside of short-term US Treasury bills, there isn’t too much stress and traders are currently not prepared to trade the debt ceiling. I have no doubt that will change, but it feels just a bit early to start piling into debt ceiling hedges/trades (AUDJPY shorts for example) at this stage.
Gold – daily chart
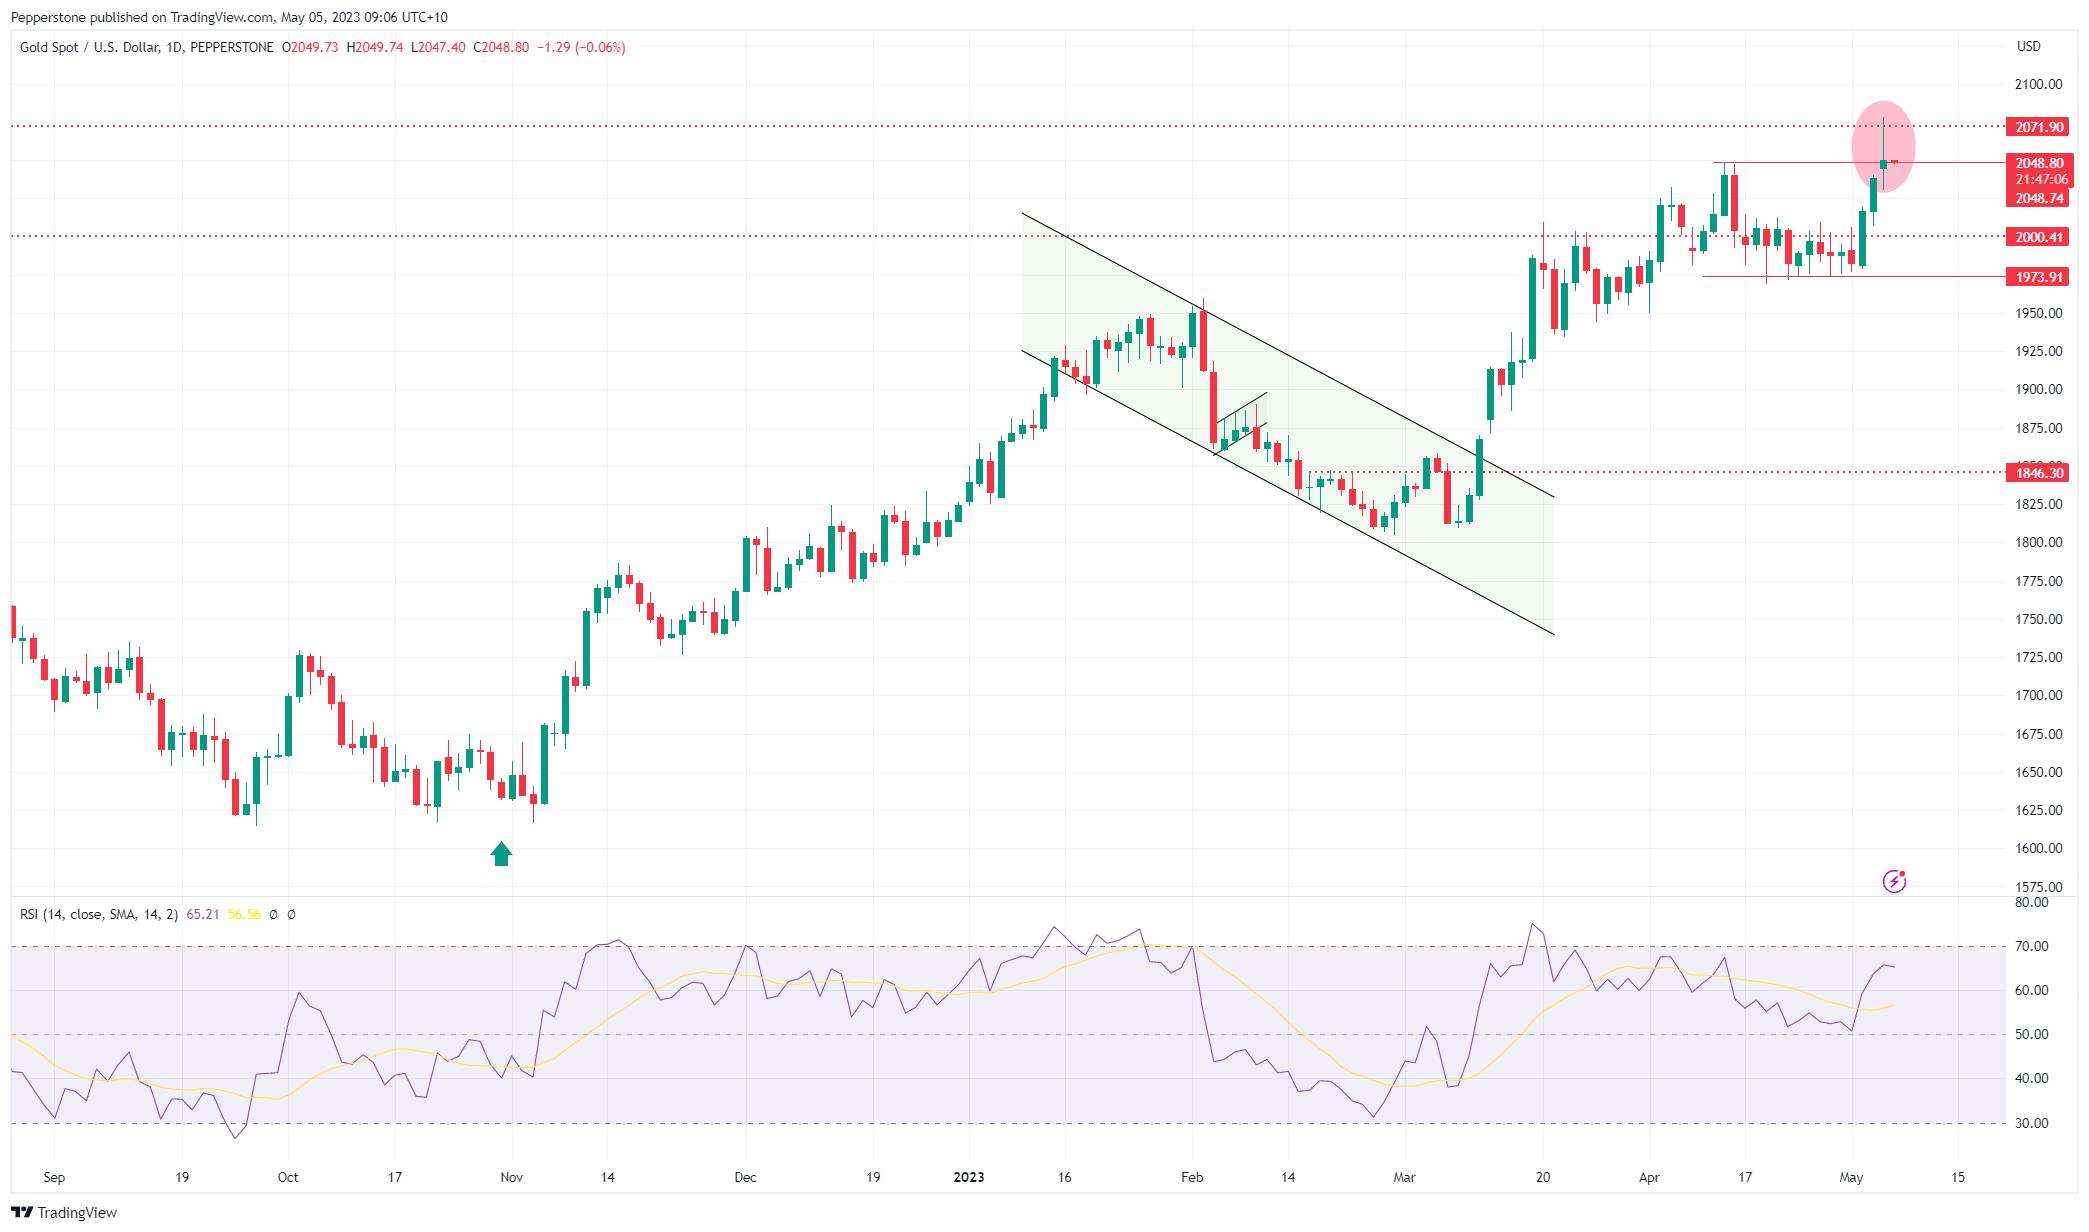
What is clear is the increased rate cut expectations are keeping would-be USD buyers at bay and providing a clear tailwind for gold. After yesterday's liquidity run during the US/Asia crossover, which took gold to new all-time highs, we’ve seen price trade a $2030 to $2059 range, where we see the daily close holding the former breakout high of $2048, which is a positive. When I look at gold futures positioning, options skew, or classic oscillator readings (such as the RSI) I don’t see true euphoria towards gold, and it is not over-loved even at these levels.
That said, to see a further move above $2100, gold buyers would need real signs the vision of deterioration priced into rates is on the money and for that I am yet to be convinced – for me, gold is not a hedge against inflation but the symptoms and aftermath of high inflation – that is slower growth, potential recession, and in this case, political brinkmanship in Congress.
Related articles

The material provided here has not been prepared in accordance with legal requirements designed to promote the independence of investment research and as such is considered to be a marketing communication. Whilst it is not subject to any prohibition on dealing ahead of the dissemination of investment research we will not seek to take any advantage before providing it to our clients.
Pepperstone doesn’t represent that the material provided here is accurate, current or complete, and therefore shouldn’t be relied upon as such. The information, whether from a third party or not, isn’t to be considered as a recommendation; or an offer to buy or sell; or the solicitation of an offer to buy or sell any security, financial product or instrument; or to participate in any particular trading strategy. It does not take into account readers’ financial situation or investment objectives. We advise any readers of this content to seek their own advice. Without the approval of Pepperstone, reproduction or redistribution of this information isn’t permitted.