- English
- 中文版

Gold longs would be disappointed the $2000 failed to hold though and subsequently, we see indecision on the daily chart, denoted by the pronounced ‘doji’ candle – this short-term indecision needs to rectify itself – so, either the bulls or bears need to become the dominant force.
XAUUSD daily
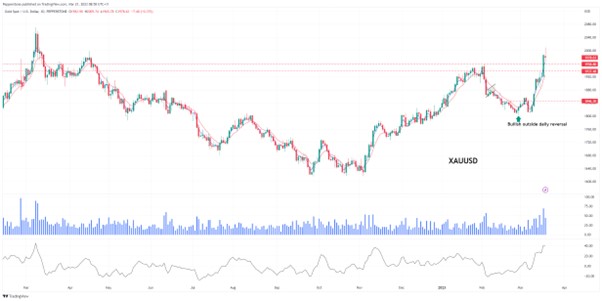
Gold longs will also want to see the breakout of the former Feb high of $1959 hold, and this could provide the platform for another momentum move higher. Naturally, this would then set us up for a daily/weekly close above $2000, which would clearly increase the prospect of a test of the highs seen in March 2022 of $2070.52.
Some have suggested holding off from taking new long positions given the elevated nature of various oscillators, such as the RSI – while it tells a similar message (on risk v reward), a better guide is the net difference between the 3- and 8-day EMA, which has blown out to $40 – the highest level since March 2022. The prospect of price consolidation has therefore increased as some of the heat comes out of the move near-term.
As a leveraged trader, when the bulls re-exert themselves, I would be a buyer into strength, where a daily close above $1987 would be a bullish signal.
I would be far more hesitant to take longs if price closed the session below the 5-day EMA.
The fundamental case for gold
While the technical picture looks a tad stretched (but still bullish), the fundamental picture suggests some degree of caution is warranted.
Positioning - CTA’s (systematic trend-following funds) have increased their position in gold futures to become ‘max long’. This flow has been a clear tailwind for the gold price, whereby these influential players now have limited capacity to add to an already extensive position. Pepperstone client’s current skew in positioning shows 56% of open positions in XAUUSD are held short.
There have also been big flows into gold ETFs, where we saw c. 18m tonnes of inflows last week – in fact, Tuesday marked the biggest one-day inflow since mid-2022. Bullish, but is there more to come?
The influence of the bond market – last week marked one of the most incredible volatile moves in US and EU bonds we’ve ever seen – I suspect funds were only to keen to hedge out some of the risks through long gold positions.
The fact the US (and many other countries) has sticky, and still very high inflation, yet falling interest rate hike expectations has seen traders front-run an expected move lower in US real rates. Importantly, this relationship holds true, and we see US 5yr real Treasury yields falling from 1.89% to 1.39%, with gold rallying from $1807 to current levels.
Recall, gold has no yield, so when the expected ‘real’ (i.e. bond yields adjusted for expected inflation) return falls, it makes gold relatively more attractive and vice versa.
Gold benefits from expected rate cuts
Here we see the difference between the May 2023 and December 2023 US swaps contract (the markets expectations of future rate hikes/cuts from the Fed) are currently pricing in 93bp of cuts through that period – last week we saw that at 120bp of cuts pried between May and December and gold followed closely.
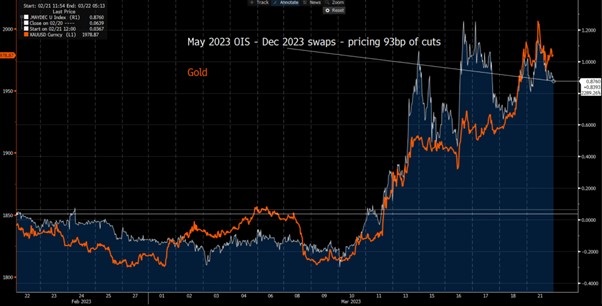
Fundamentally, one could make the case for consolidation in gold - where if this relationship holds, we’d need to see over 100bp of cuts priced to compel a rally back above $2000. A turn lower in sentiment towards US banks or a genuinely dovish turn from the Fed this week would push that pricing along.
Conversely, if rate cuts do get priced out of the market here – perhaps as a better feel to banks or the general macro environment - then one could argue this could weigh on gold.
QE5? Last week we saw gold buyers emerge after the Fed’s balance sheet increased by $300b – this was driven by the take up of credit from US banks as the Fed’s rolled out various liquidity facilities to help the US banking system. After much debate, the world has viewed this correctly not as QE, but as a credit line that will need to be repaid by the banks – either way, the Fed’s balance sheet expansion has supported gold.
This week’s Fed balance sheet data could be influential again and the degree of demand for Fed liquidity could influence gold traders.
Currency effect – on a bullish note, we can see gold has been rallying in all currencies, even the strongest, which in the past month has been the JPY. In fact, we just recorded new all-time high prints in XAUJPY (Gold priced in JPY), XAUAUD and XAUGBP. The fact we’re seeing the USD under pressure has been a tailwind for gold price – a breakout in EURUSD above 1.0635 gets the USD pumping to the downside which should support gold.
Near-term drivers – we continue to watch the price action in US and EU banks and while things are calmer today there are still plenty of 2-way risks here. We get the FOMC meeting (Thurs 5 am AEDT) and this holds big implications for interest rates pricing, the USD and by extension gold – I see modest upside risk for the USD (gold downside) but much will come down to the FOMC statement and the increased level of concern.
Related articles

The material provided here has not been prepared in accordance with legal requirements designed to promote the independence of investment research and as such is considered to be a marketing communication. Whilst it is not subject to any prohibition on dealing ahead of the dissemination of investment research we will not seek to take any advantage before providing it to our clients.
Pepperstone doesn’t represent that the material provided here is accurate, current or complete, and therefore shouldn’t be relied upon as such. The information, whether from a third party or not, isn’t to be considered as a recommendation; or an offer to buy or sell; or the solicitation of an offer to buy or sell any security, financial product or instrument; or to participate in any particular trading strategy. It does not take into account readers’ financial situation or investment objectives. We advise any readers of this content to seek their own advice. Without the approval of Pepperstone, reproduction or redistribution of this information isn’t permitted.