- English
- 中文版
Analysis

Our clients are 48% long / 52% short on XAUUSD and generally they are long of USDs across the board, with 53% of all open positions in EURUSD held short, 63% short in USDJPY. There is a slight skew that Jay Powell’s speech at Jackson Hole (tonight 00:00 AEST) will be, on balance, on the hawkish side of the ledger. There is also a look ahead at next week’s US non-farm payrolls too and seeing the risks for a strong jobs read, with the consensus now for 769k jobs, and the unemployment rate expected to tick down 20bp to 5.2%.
(Upper pane – daily money flow, lower pane – cumulative flow)
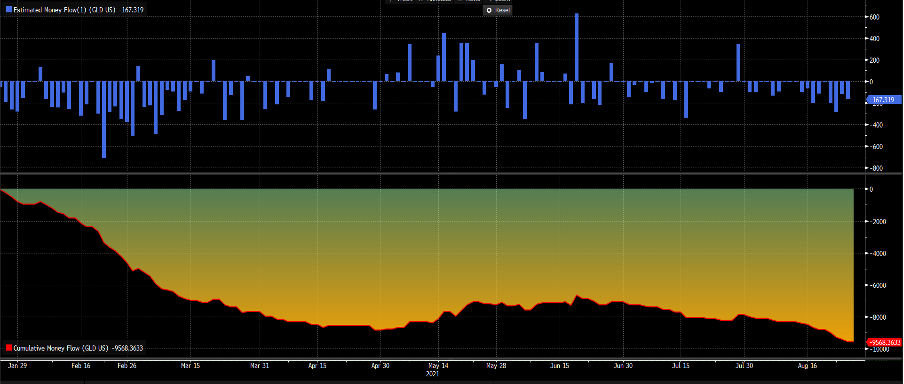
(Source: Bloomberg)
We can see in the estimated money flow (blue histogram) from the GLD ETF, where the bias has been for outflows – I think that speaks volumes about sentiment. The GDX ETF (gold miners ETF) is heavy and sits at the bottom of its 12-month range.
As I spoke at some length in yesterday’s ‘Good as Gold’ video the relationship with US inflation-adjusted Treasuries or ‘real’ rates has firmly broken down. US 10-year real rates have pushed from -121bp to -100bp, which has traditionally been a huge headwind for gold, but there is no statistical relationship between the two variables at this point – in fact, the rolling 10-day correlation sits at +0.44. It is very rare that you see a positive relationship, as we see from the distribution.
(Rolling 10-day correlation between US real rates and XAUUSD)
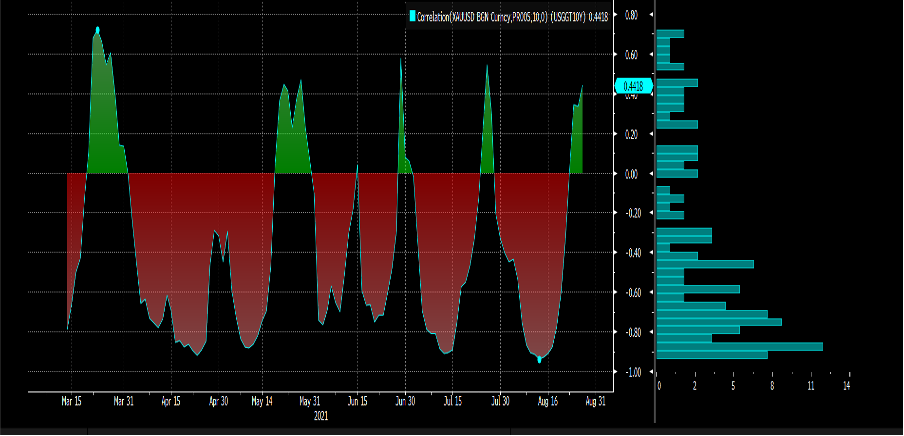
(Source: Bloomberg)
XAUUSD 1-week implied volatility sits at 13.2%, but this has literally not moved since late March and there is no real demand for volatility. Stability has been the order of the day as traders look ahead and ask what will drive. The skew of 1-week put to call volatility is modestly towards a bigger downside move (1-week risk reversals are -0.6), which seems in line with our own net client position, but it’s not giving any high conviction bias.
(Upper – 1-week implied volatility, lower – 1-week put/call skew)
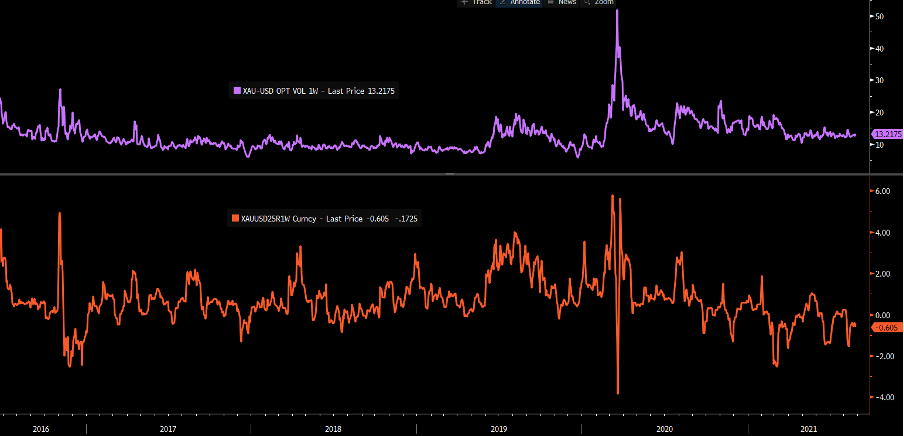
(Source: Bloomberg)
My own view is that the gold market is front running the notion that real rates are going higher (less negative) and are simply not prepared to buy gold, as they are forward-looking here. The idea is that inflation expectations are fairly valued here, with 10-yr breakeven inflation at 2.36% - so if nominal 10yr Treasuries sell-off (yields higher) into the November FOMC then real rates will head towards -50bp. I would argue that the gold market is starting to see that view, which likely result in a strong USD too, notably vs the low yielding/funding currencies.
The technical set-up marries this view perfectly, and I argue that this is a range traders’ market, for now. The 5-day EMA is moving sideways, perhaps with a slight upwards elevation. However, the 20-day MA is moving perfectly sideways, and the 14-day RSI is mid-range at 50. This is also right in the heart of the 30-day high to low range. Clearly, the bulls or the bears need to show some authority and until they do I trade the range.
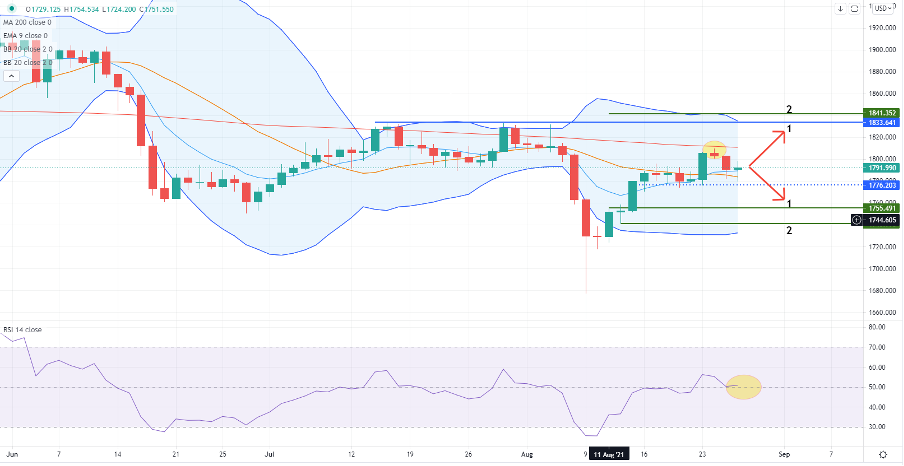
(Source: Tradingview)
Initial downside support sits at 1776, where a break here obviously skews the move lower and maybe we see 1755 in play – based on options pricing, the market gives this a 25% chance of touching this level over the coming week. The market puts a 10% probability of price breaking 1740 through this period, so this seems a stretch but if it does come into play then I can have a far high conviction of mean reversion longs here.
Some have mentioned the lower Bollinger band (20-day MA/2 std deviations) as the area for mean reversion longs, but this is currently 1733 and we’d need to see something that truly shocks to get us down here in the near term – I suspect these bands are going to narrow.
On the upside, 1809 (the 25 August high) is the key level and a break here suggests the July highs of 1833 come into play. This marries with the upper BB – so I would be looking for shorts near-term into here.
In the long run, I too share the view that the risk is for higher US real rates, which is perhaps what the gold market is now portraying. Until then, this is one for the range traders and I would be looking for trades into 1833 and 1755. The risk is we don’t see a test of either any time soon – but for now, this is my playbook at least on the higher timeframes. Drilling down into 5–30-minute charts changes things, of course.
Related articles


Ready to trade?
It's quick and easy to get started. Apply in minutes with our simple application process.
The material provided here has not been prepared in accordance with legal requirements designed to promote the independence of investment research and as such is considered to be a marketing communication. Whilst it is not subject to any prohibition on dealing ahead of the dissemination of investment research we will not seek to take any advantage before providing it to our clients.
Pepperstone doesn’t represent that the material provided here is accurate, current or complete, and therefore shouldn’t be relied upon as such. The information, whether from a third party or not, isn’t to be considered as a recommendation; or an offer to buy or sell; or the solicitation of an offer to buy or sell any security, financial product or instrument; or to participate in any particular trading strategy. It does not take into account readers’ financial situation or investment objectives. We advise any readers of this content to seek their own advice. Without the approval of Pepperstone, reproduction or redistribution of this information isn’t permitted.