- English
- 中文版
Analysis
.jpg?height=93&quality=100)
GBPAUD is an interesting magin FX cross, both sensitive to risk with AUD probably taking the slight edge over GBP in this department. Today’s solid flash PMIs out from the UK show the economy continues to leave omicron in the rear view mirror. Prime Minister Johnson is also set to imminently reveal the removal of all legal covid restrictions for England, however, some wrangling is going on between the treasury and the health department. In terms of data we get a really important print for Australian in terms of Q4 wages this week. The reason for its significance is due to the RBA’s guidance on inflation sustainability being tied to growth in wages. Inflation is above the 2-3% target band, however, the RBA deem it premature to see this as entrenched given weak wage growth (currently running at 2.2% YoY). If the RBA hold back their policy normalization cycle this should allow a widening in rate differentials between GBP and AUD. However, given the lower expectations for the AUD, this does pose a risk for a sharp reversal and spread compression. We saw the euro strengthen with the hawkish pivot by the ECB. AUD positioning is also very net short which poses a short squeeze risk.
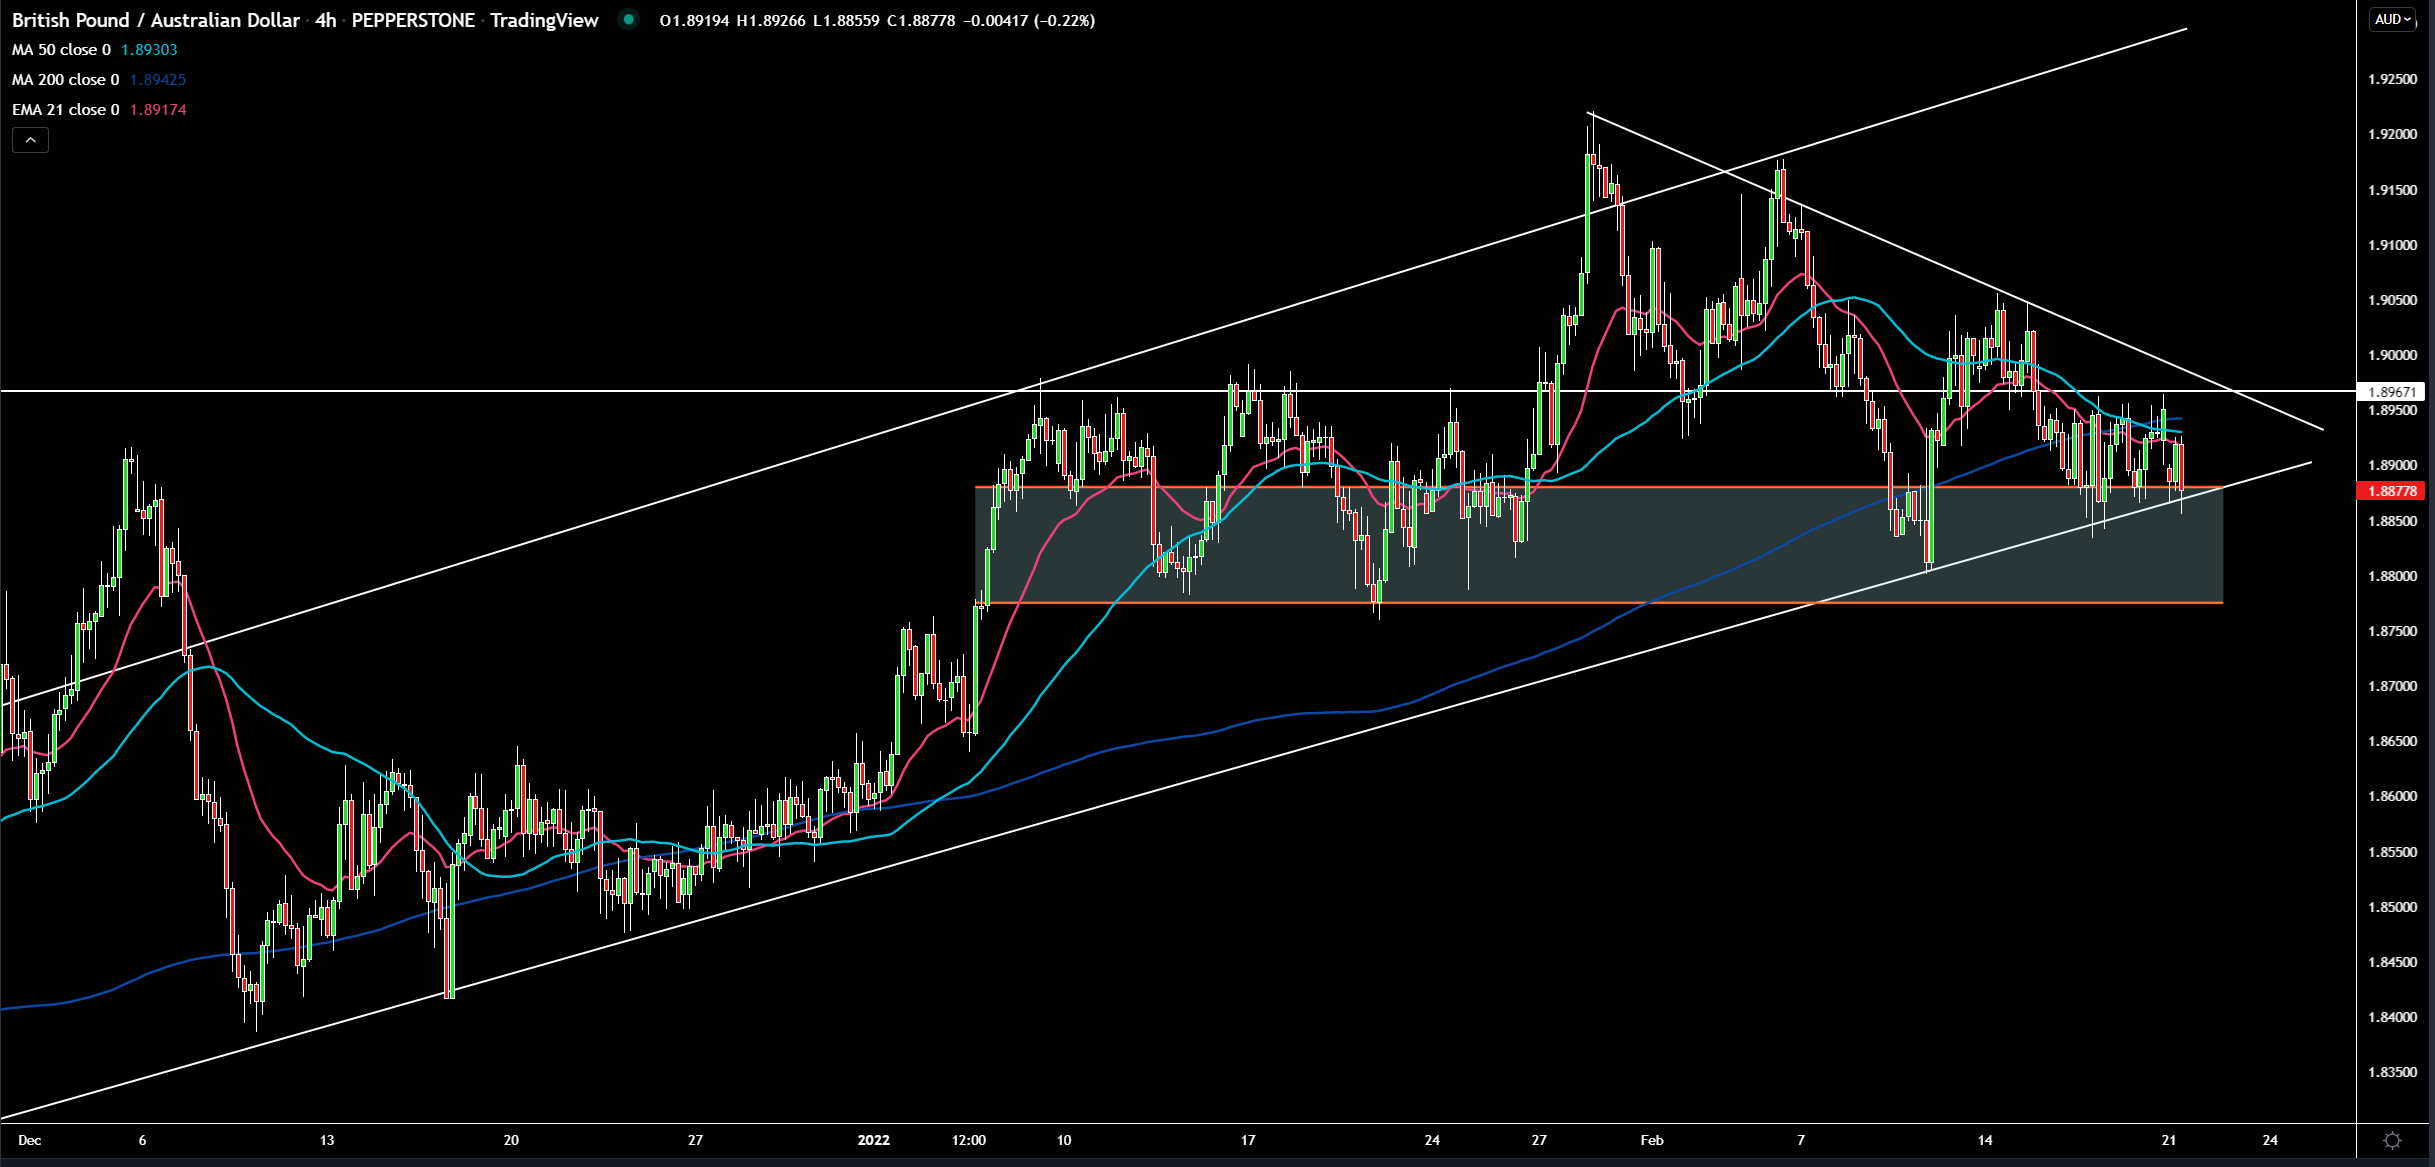
(Source: Tradingview - Past performance is not indicative of future performance.)
What are the charts telling us? I’ve got the 4 hour time frame up. There’s a big bearish engulfing candle at present which took us through the uptrend line. I’ve drawn in a support zone (orange area) as opposed to a line due to the range bound behaviour within it. There is also a triangle structure which has formed which doesn’t tend to have a directional bias, but does precede breakouts. If the lower bound of the orange range support zone breaks, then a short framework would take hold. In terms of targets on the upside, I’d like to see what price does around the 200-day SMA and 50-day SMA (around 1.893/4). Higher than that within the ascending channel we have some horizontal resistance around the 1.896/7 level.
Related articles


Ready to trade?
It's quick and easy to get started. Apply in minutes with our simple application process.
The material provided here has not been prepared in accordance with legal requirements designed to promote the independence of investment research and as such is considered to be a marketing communication. Whilst it is not subject to any prohibition on dealing ahead of the dissemination of investment research we will not seek to take any advantage before providing it to our clients.
Pepperstone doesn’t represent that the material provided here is accurate, current or complete, and therefore shouldn’t be relied upon as such. The information, whether from a third party or not, isn’t to be considered as a recommendation; or an offer to buy or sell; or the solicitation of an offer to buy or sell any security, financial product or instrument; or to participate in any particular trading strategy. It does not take into account readers’ financial situation or investment objectives. We advise any readers of this content to seek their own advice. Without the approval of Pepperstone, reproduction or redistribution of this information isn’t permitted.