- English
- 中文版
FED vs. Markets: Who is Right?
2024 has definitely started off quite interestingly as a series of labor economic data points have adjusted expectations slightly regarding the FED's aggressive rate cuts. As is customary, this had an impact on different areas of the market, such as currencies, risk assets, and safe-haven assets.
Outlook for Rate Cuts in 2024
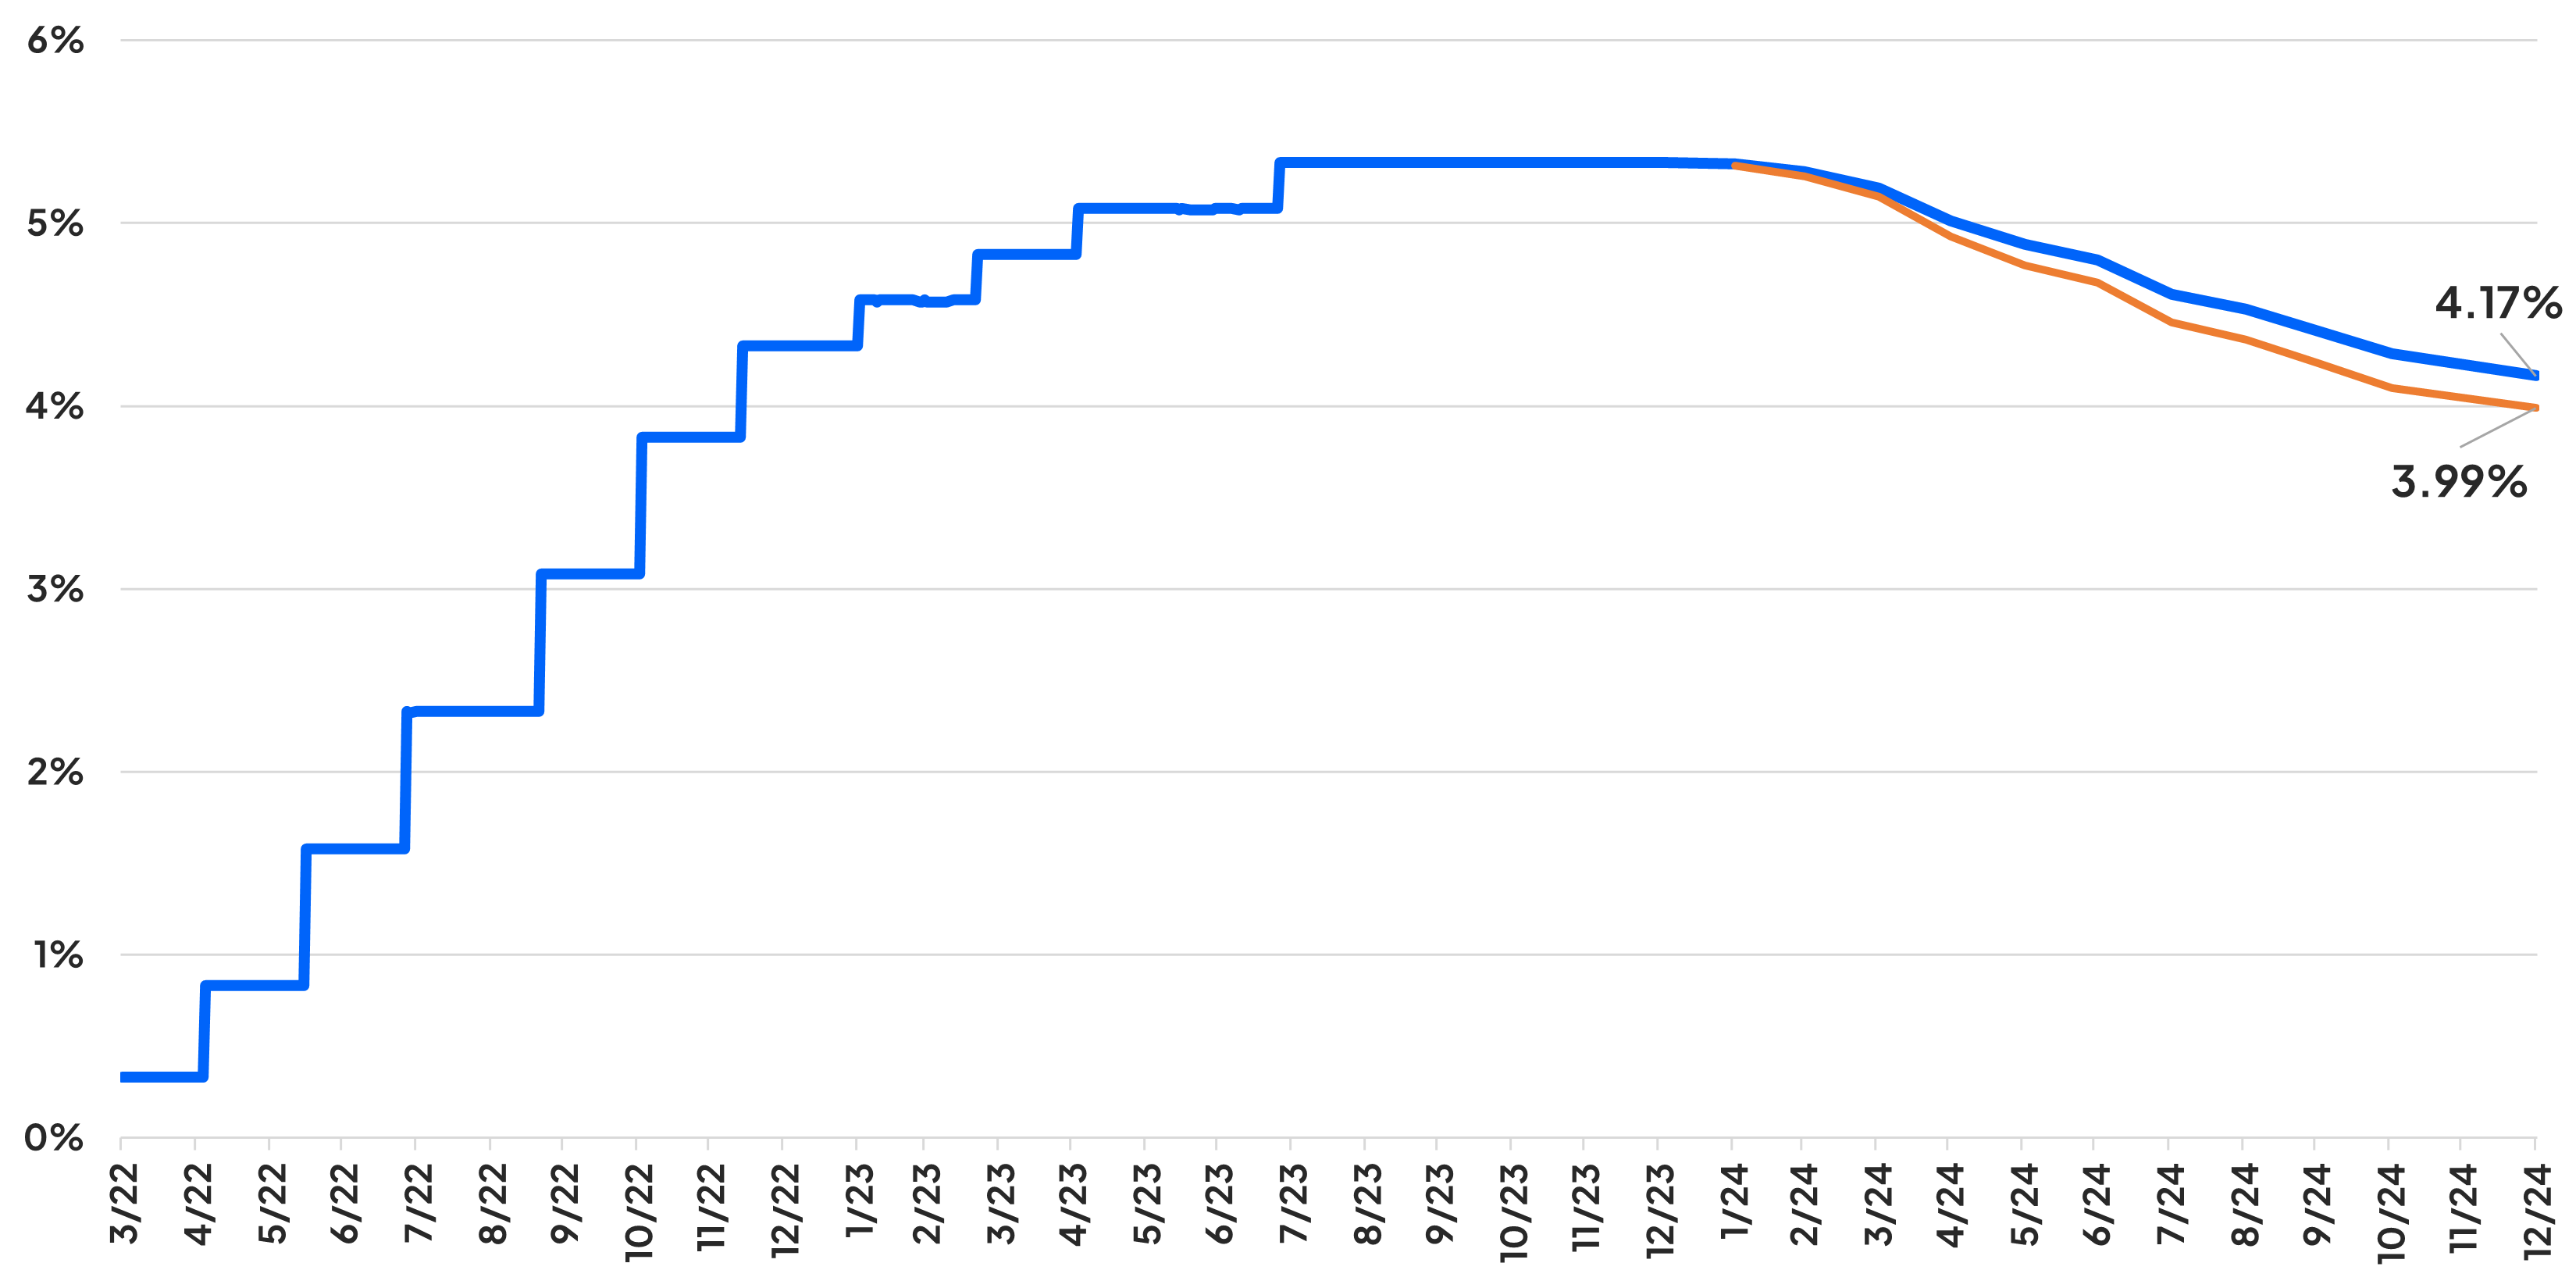
As we recall, last week we saw significant activity in labor-related publications, where, despite their different nuances – some notes coming out better than expected, while others disappointed expectations – overall, this battery of economic data gradually pushed the notion of less aggressive rate cuts by the US Central Bank.
However, just as this gradual adjustment appeared at the beginning of the year, much of the change has already been lost, leaving us with the following situation: There continues to be a considerable discrepancy between what the FED is signaling and what the markets are expecting.
This discrepancy will likely bring about a significant outcome, and that is that, at the end of the day, someone will be wrong, and as this adjusts, it will bring volatility and changes in the prices of different financial asset classes. For us, as traders, this represents opportunities...
Trade the Opportunities with Pepperstone
As a context, during the December FOMC meeting, the FED essentially opened the door to rate cuts, although the dot plot and subsequent statements by members of the Central Bank definitely indicate a preference for a more gradual approach. Looking at the dot plot, it indicates 3 rate cuts of 25 basis points for 2024. On the recent comments front, such as from the President of the Richmond Federal Reserve, Thomas Barkin, he warned that the quest to control inflation was not complete. A series of factors point to the FED having a more gradual view...
As mentioned earlier, this discrepancy will definitely bring opportunities, but here arises a key question: What will tell us who is right in terms of how much monetary policy should be normalized? The answer is quite simple, and as usual, economic data is the answer. This will certainly give the following key releases even greater value.
Heading into the March meeting, we still have two NFP data points and three inflation data releases.
US Core Inflation
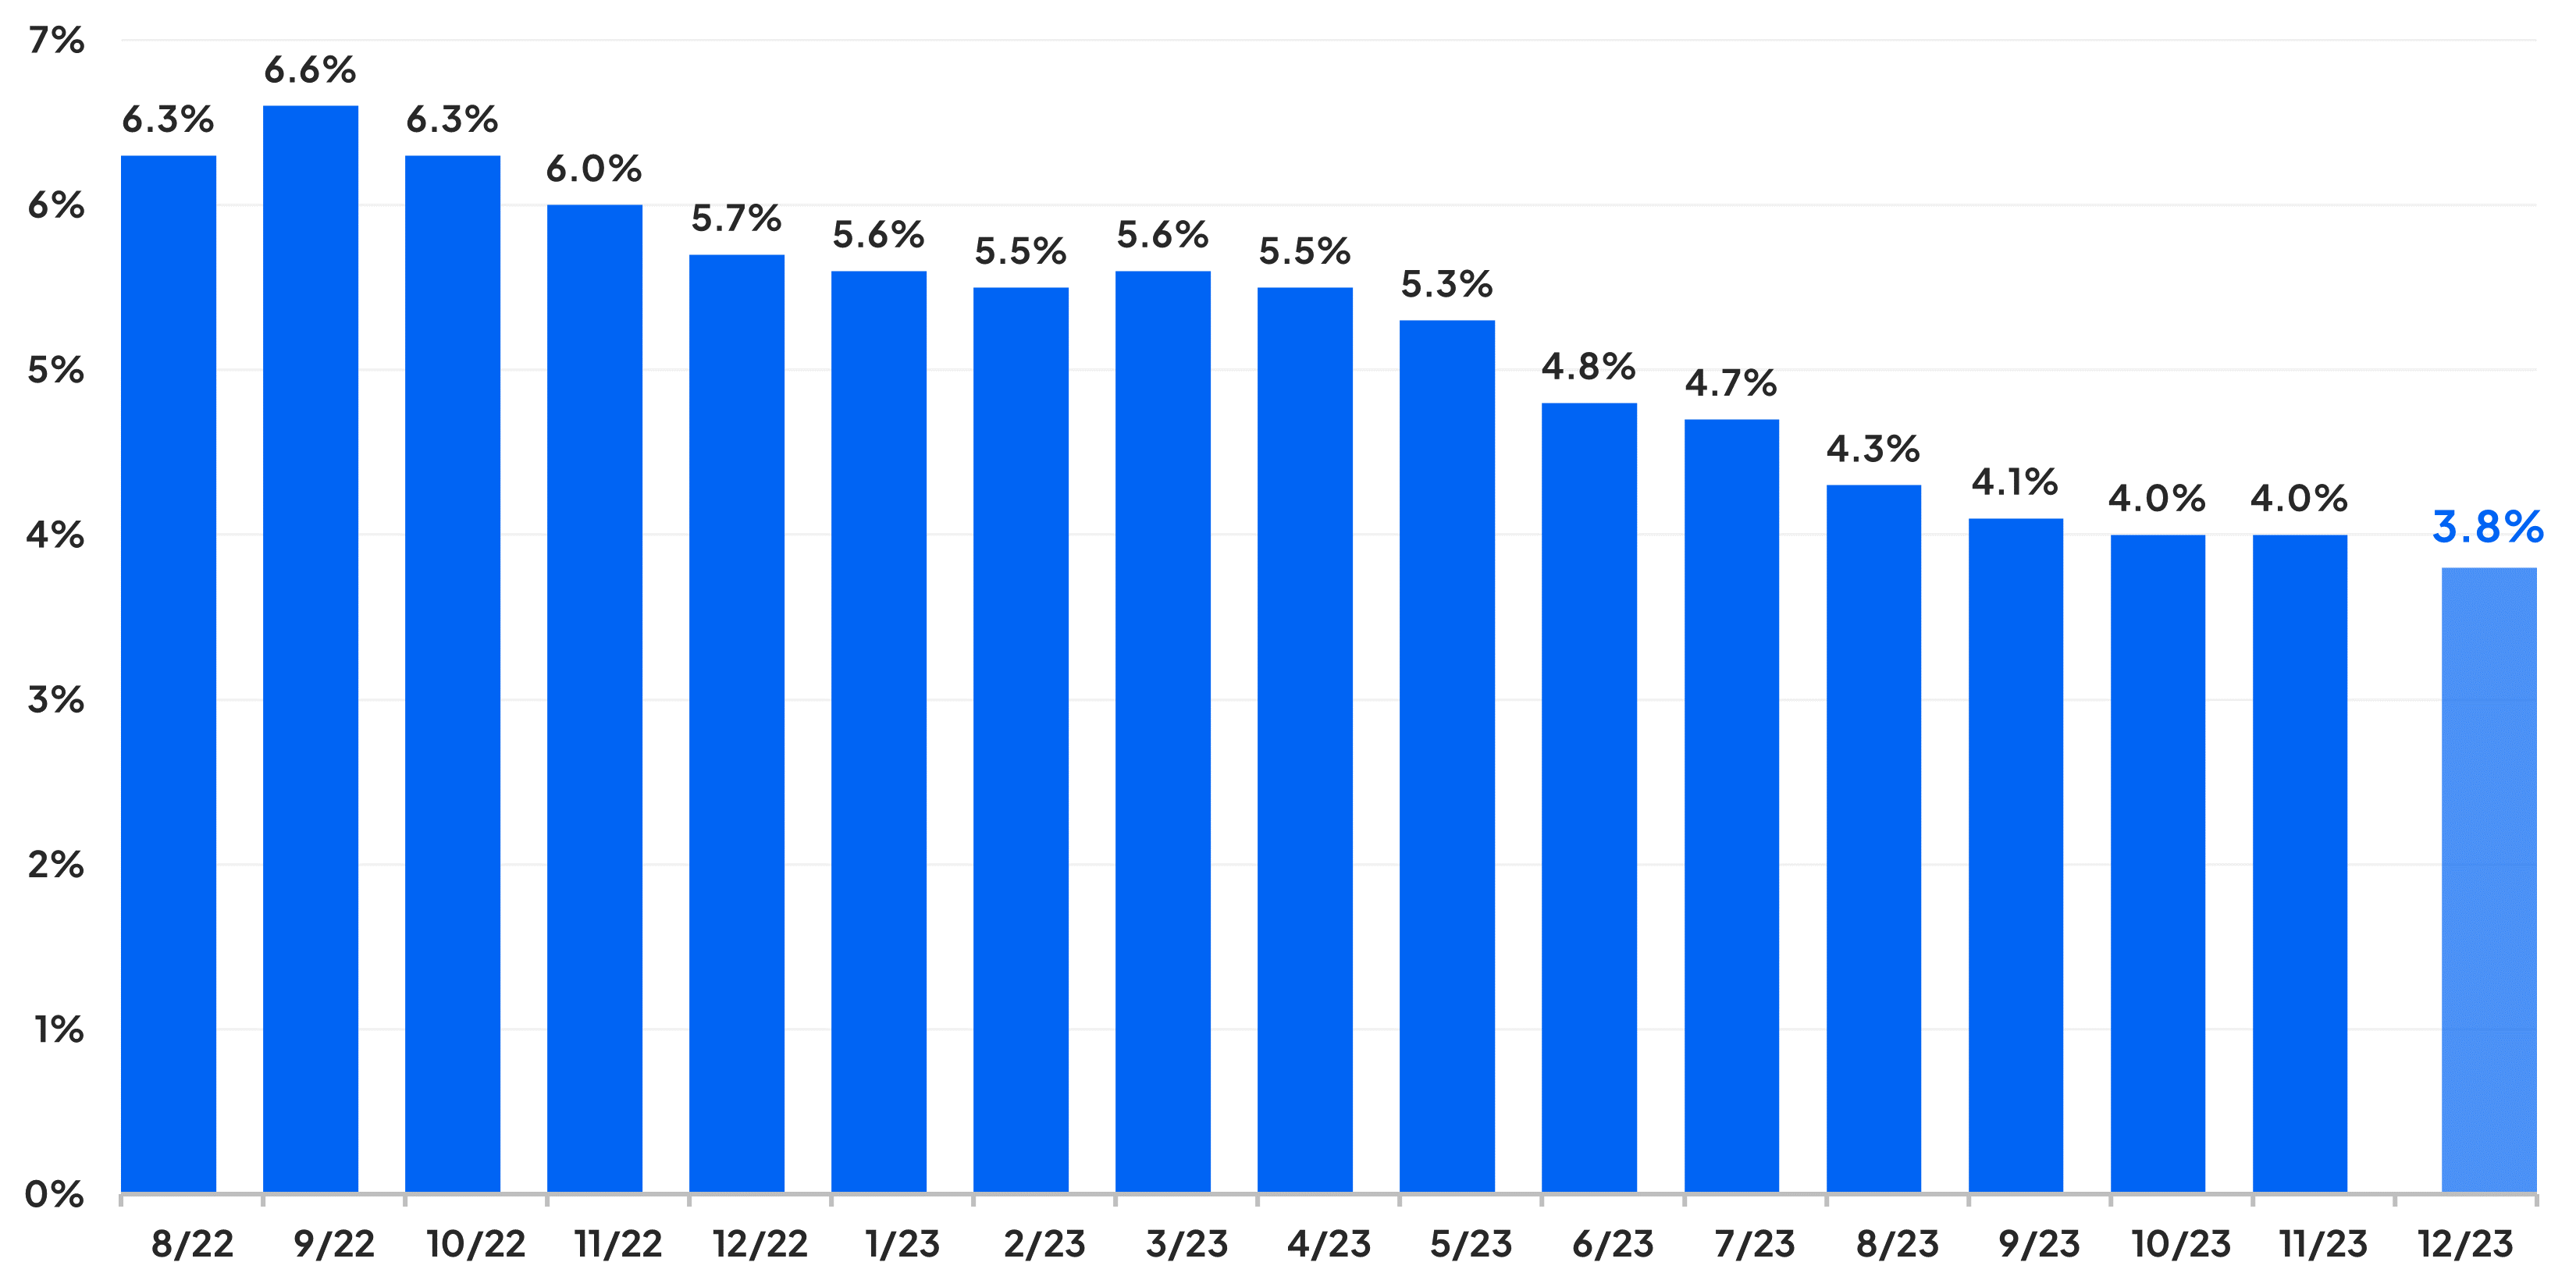
Within the economic front, the closest clue will be presented this Wednesday when the US economy releases inflation data. While it is expected that December's CPI data will show inflation in the US rising from 3.1% in November to 3.2%, I personally believe that the greater focus will be on whether we actually see a continuation of disinflationary dynamics in the core data. If core inflation remains stable, which is expected to finally decrease after staying at 4% since October, this will definitely work against the market and support the FED's narrative that, while it is ideal to start considering the path to normalization, acting as early as the first quarter is a bit premature.
In the labor market, the most important lesson from the past week is that focusing on each individual survey can be volatile and confusing. However, by stepping back and looking at the big picture, a clearer picture begins to emerge: We are witnessing a labor market in the process of finding a better balance.
Continuing Jobless Claims
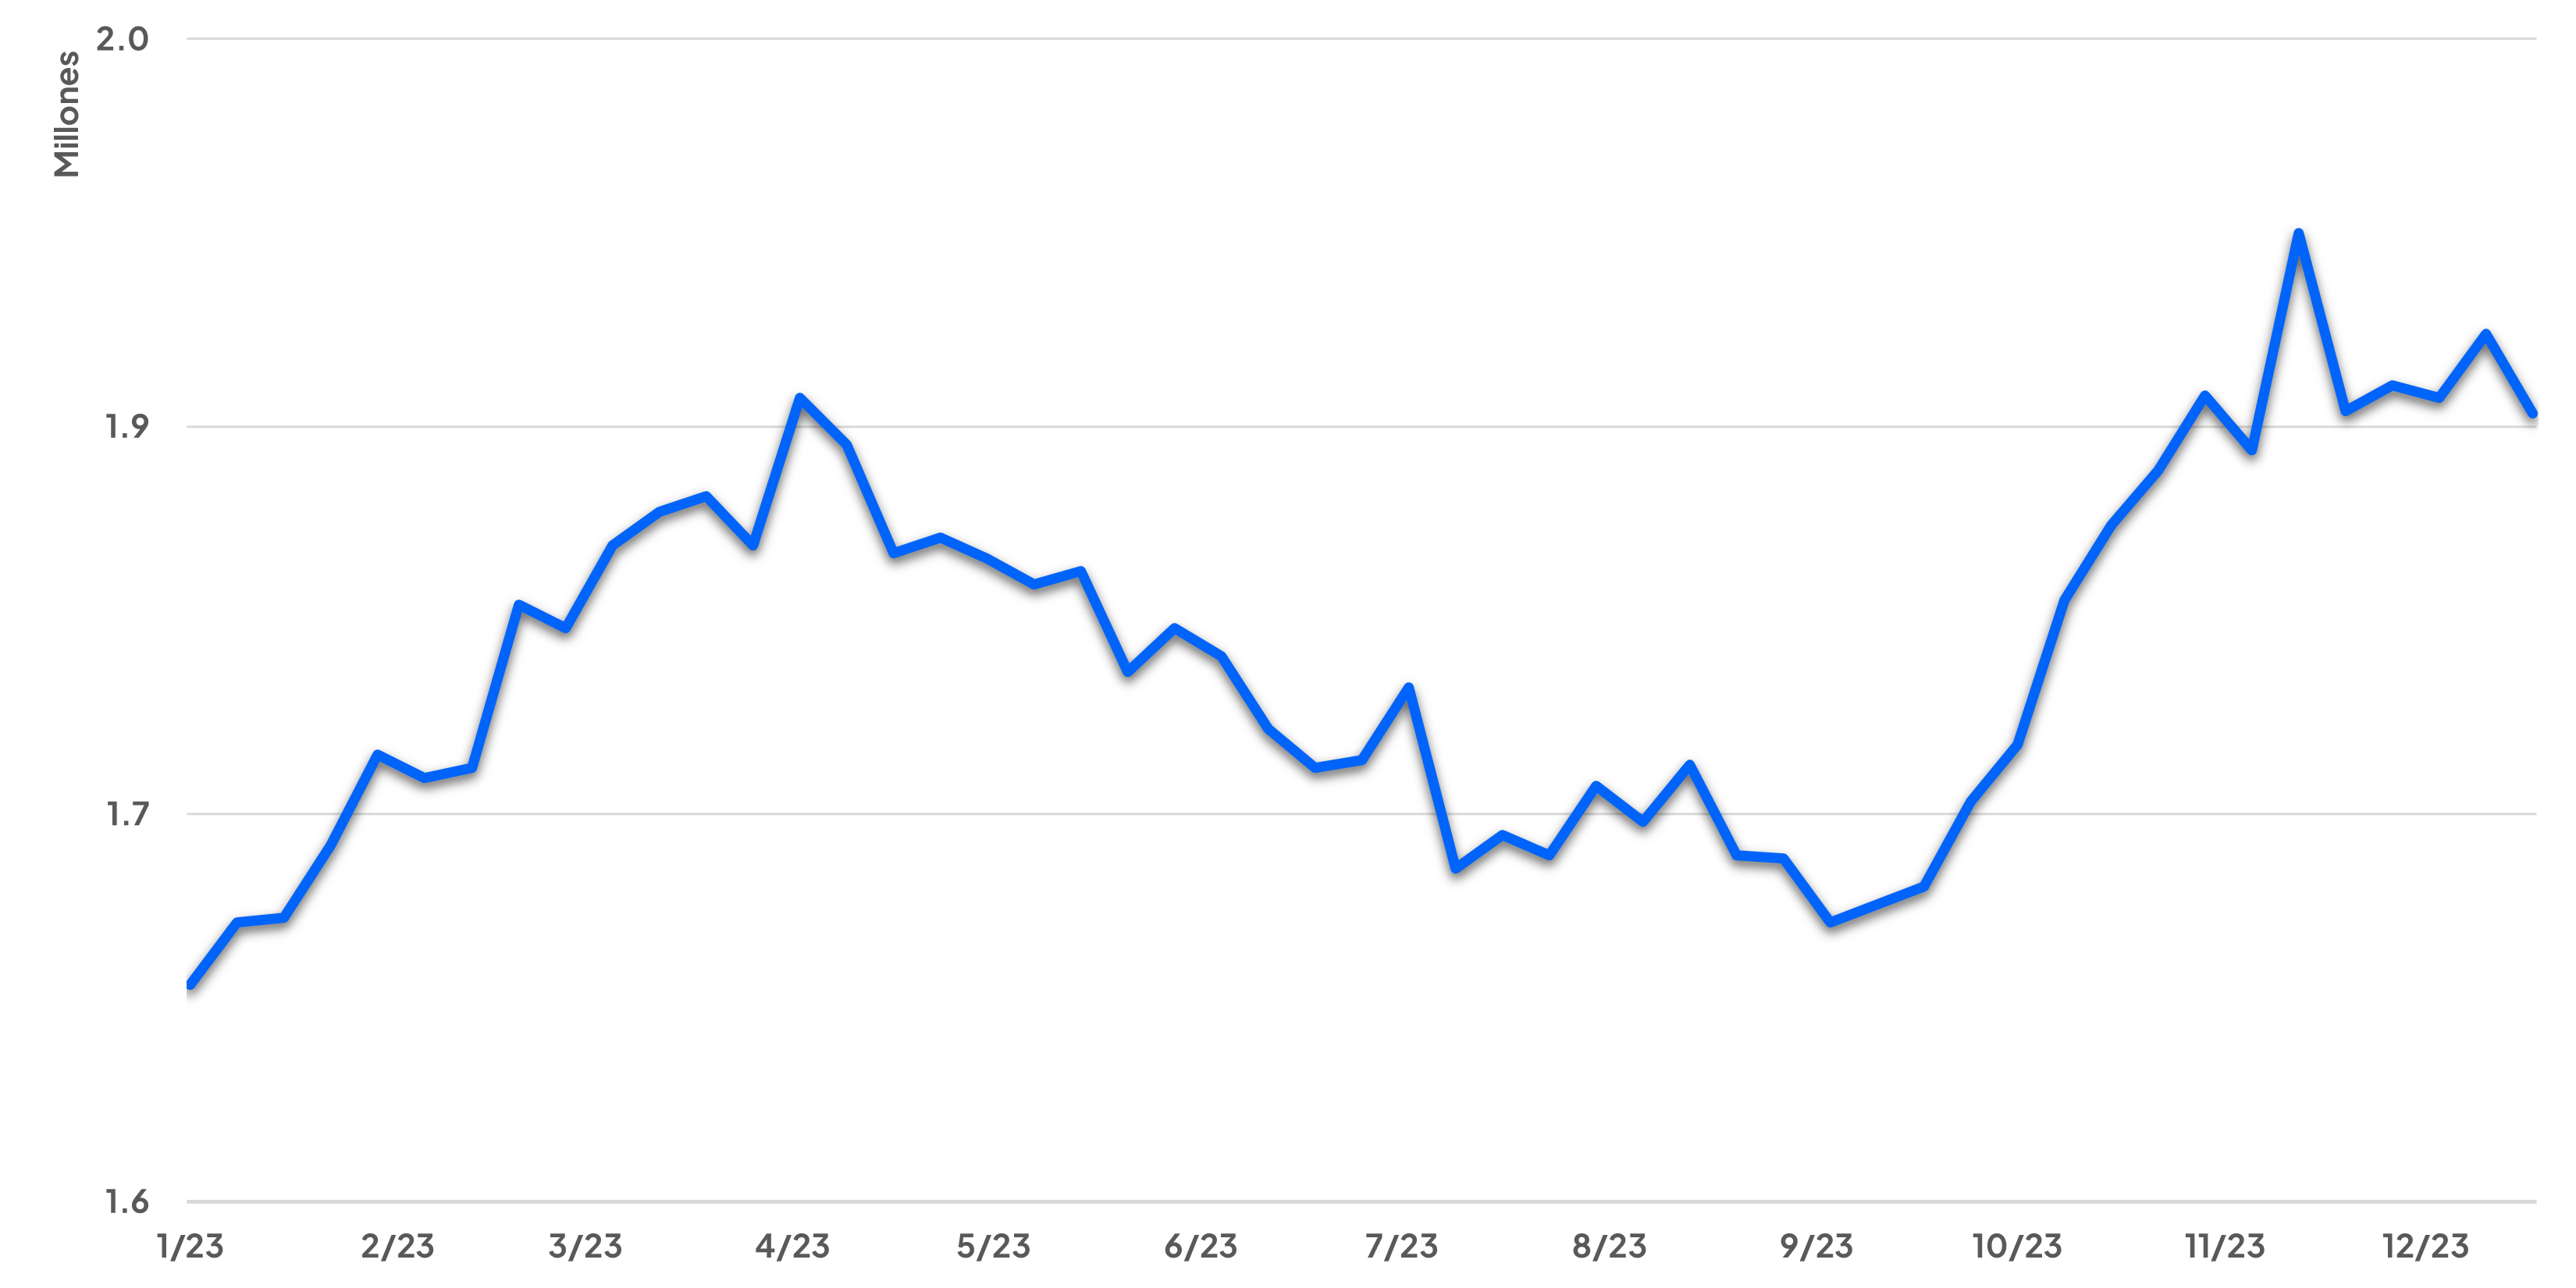
Personally, one of the metrics I will be focusing on more is the continuing jobless claims front, and the reason is as follows. As long as we do not see a significant deterioration where unemployment spikes significantly, I believe other metrics will continue to show volatile indications. Within this line of thinking, if we start to see a significant deterioration in the labor market, this will favor the markets' bet on earlier rate cuts.
This leaves us with a considerable task of keeping an eye on how the economic landscape develops.
Among the wide variety of markets, gold is an asset that currently captures my attention quite a bit. I believe its fundamental outlook is evolving interestingly. On one hand, if there is a more aggressive normalization of monetary policy, this could act as a positive catalyst for gold. On the other hand, if the Federal Reserve (FED) does not carry out rate cuts as quickly and aggressively as the markets anticipate, this may not help the price of gold.
Daily XAU/USD Chart:
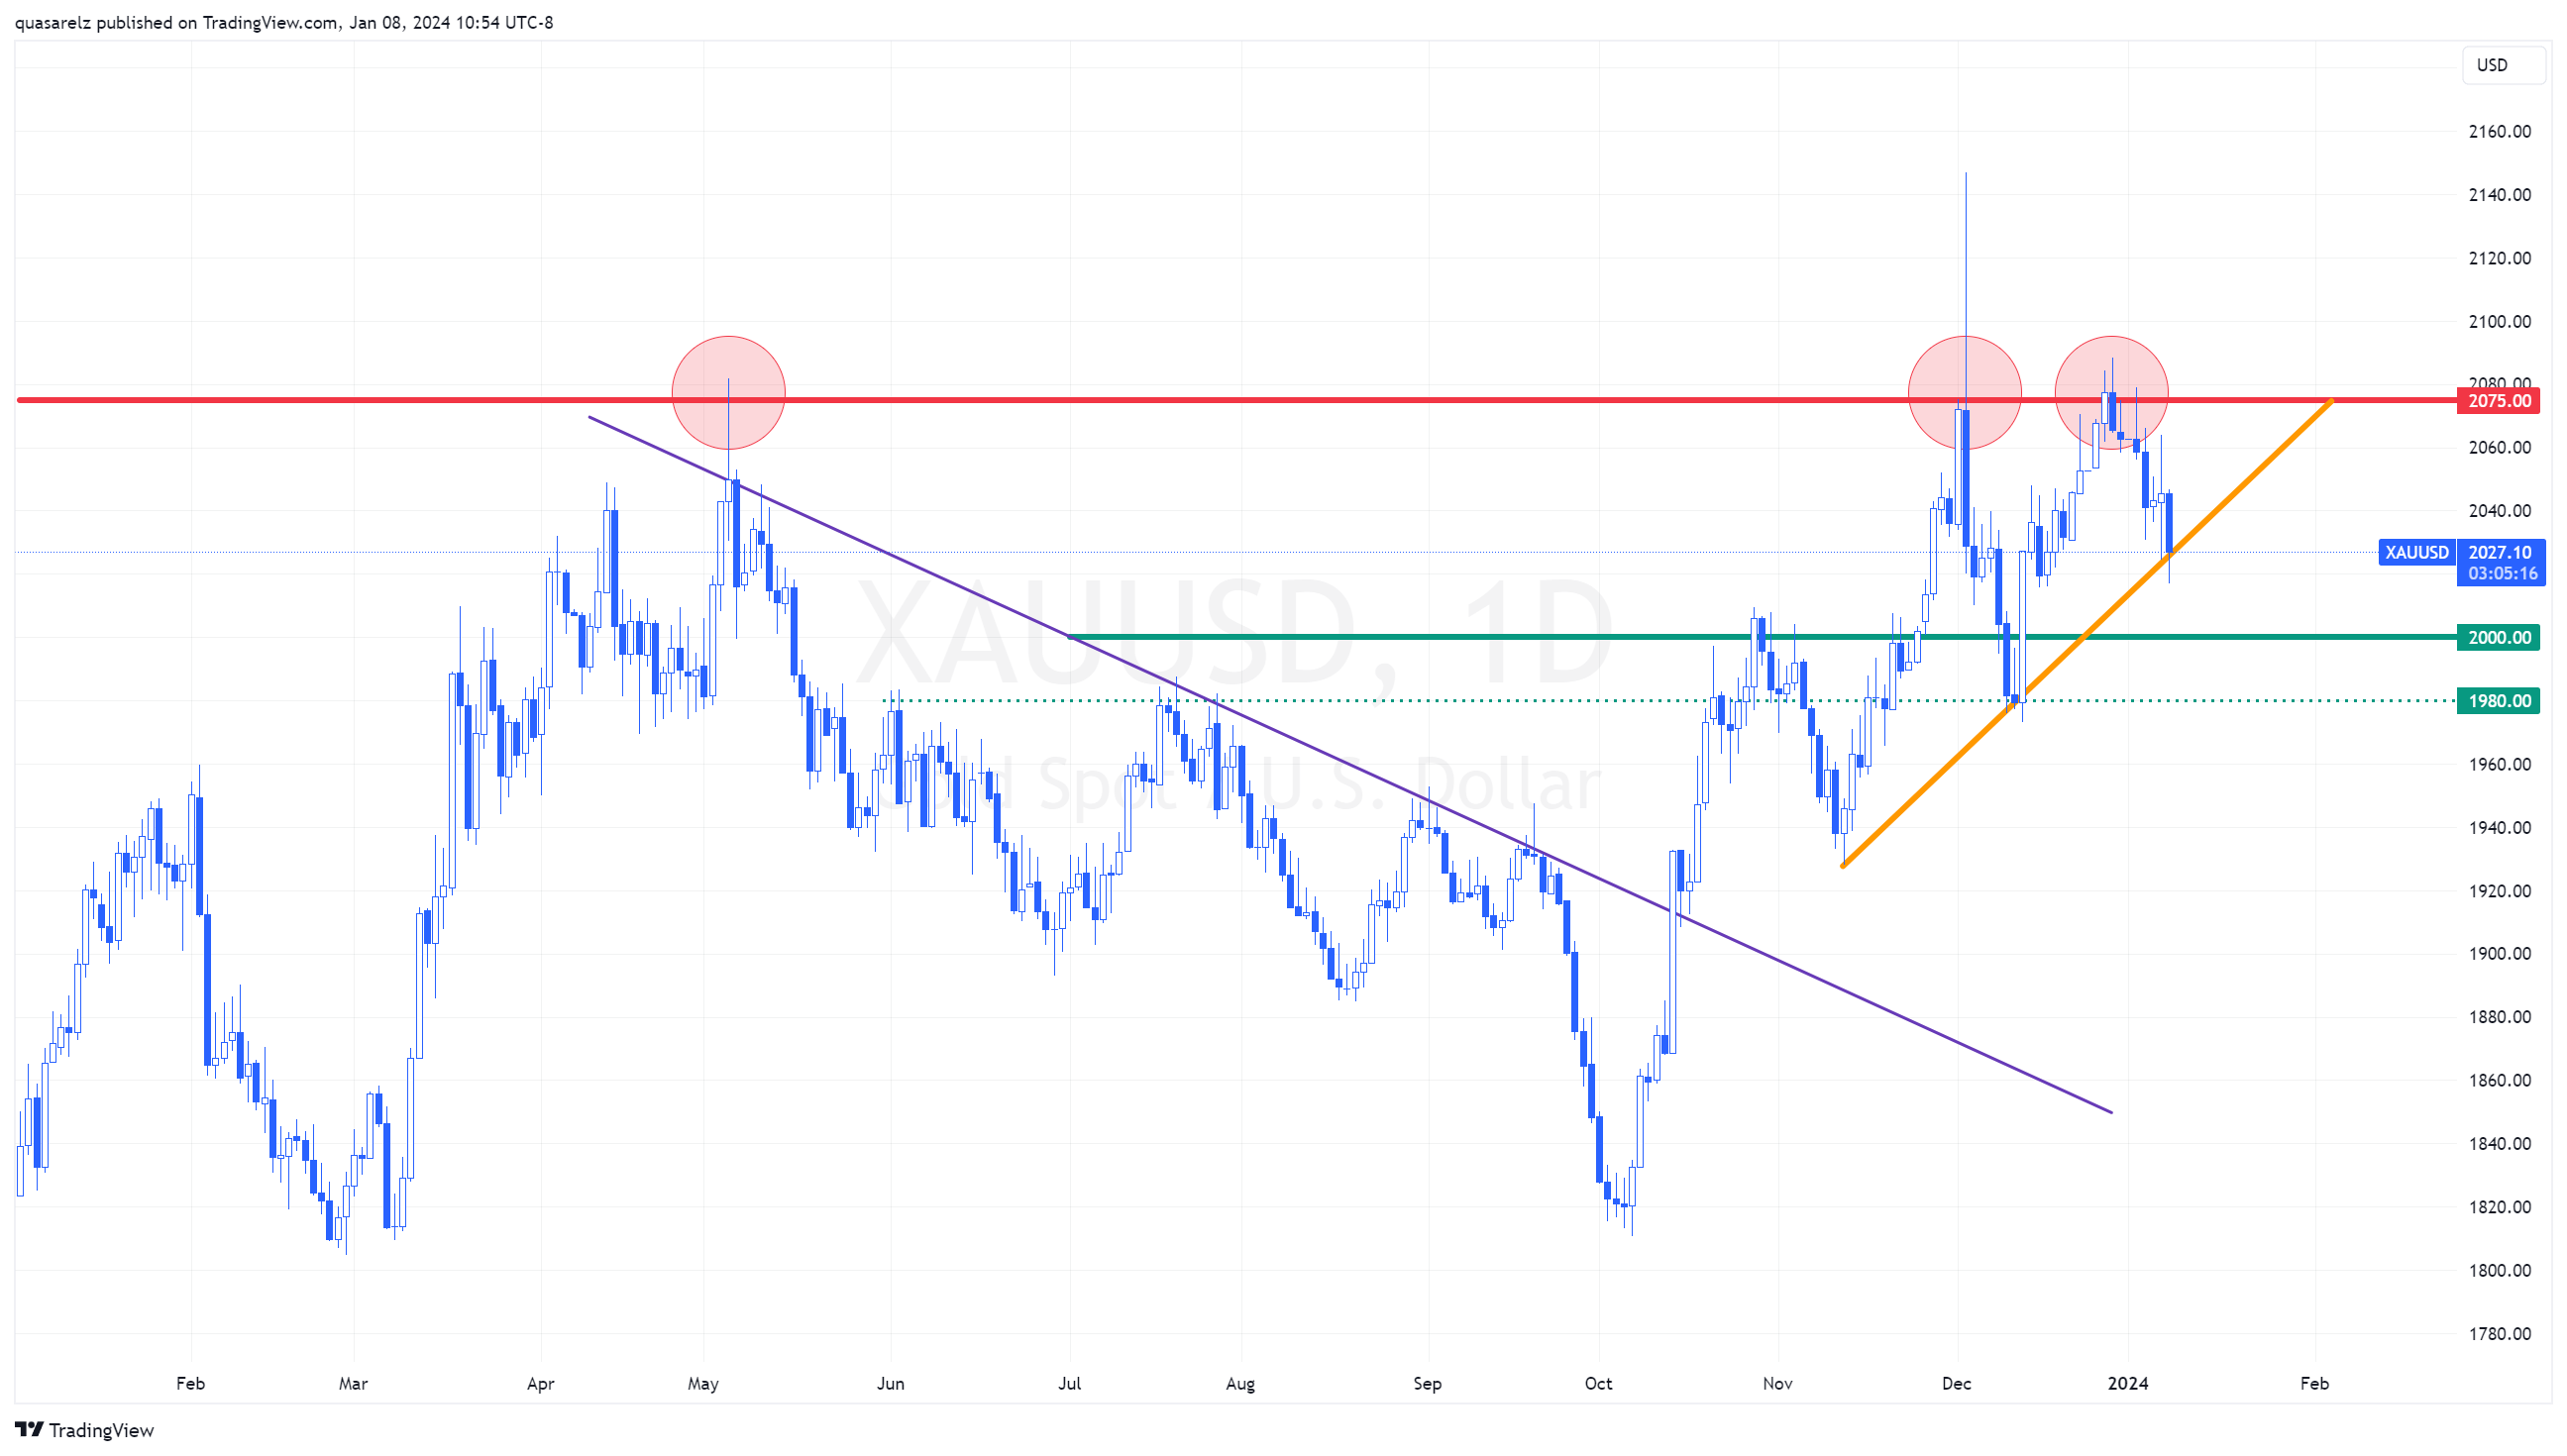
From a short-term technical perspective, we see that XAU/USD is finding support on an upward trendline that originates from the November lows. This support level has become relevant after gold was rejected again around the key resistance of $2,075 per ounce, which has historically been a significant barrier for gold.
Monthly XAU/USD Chart:
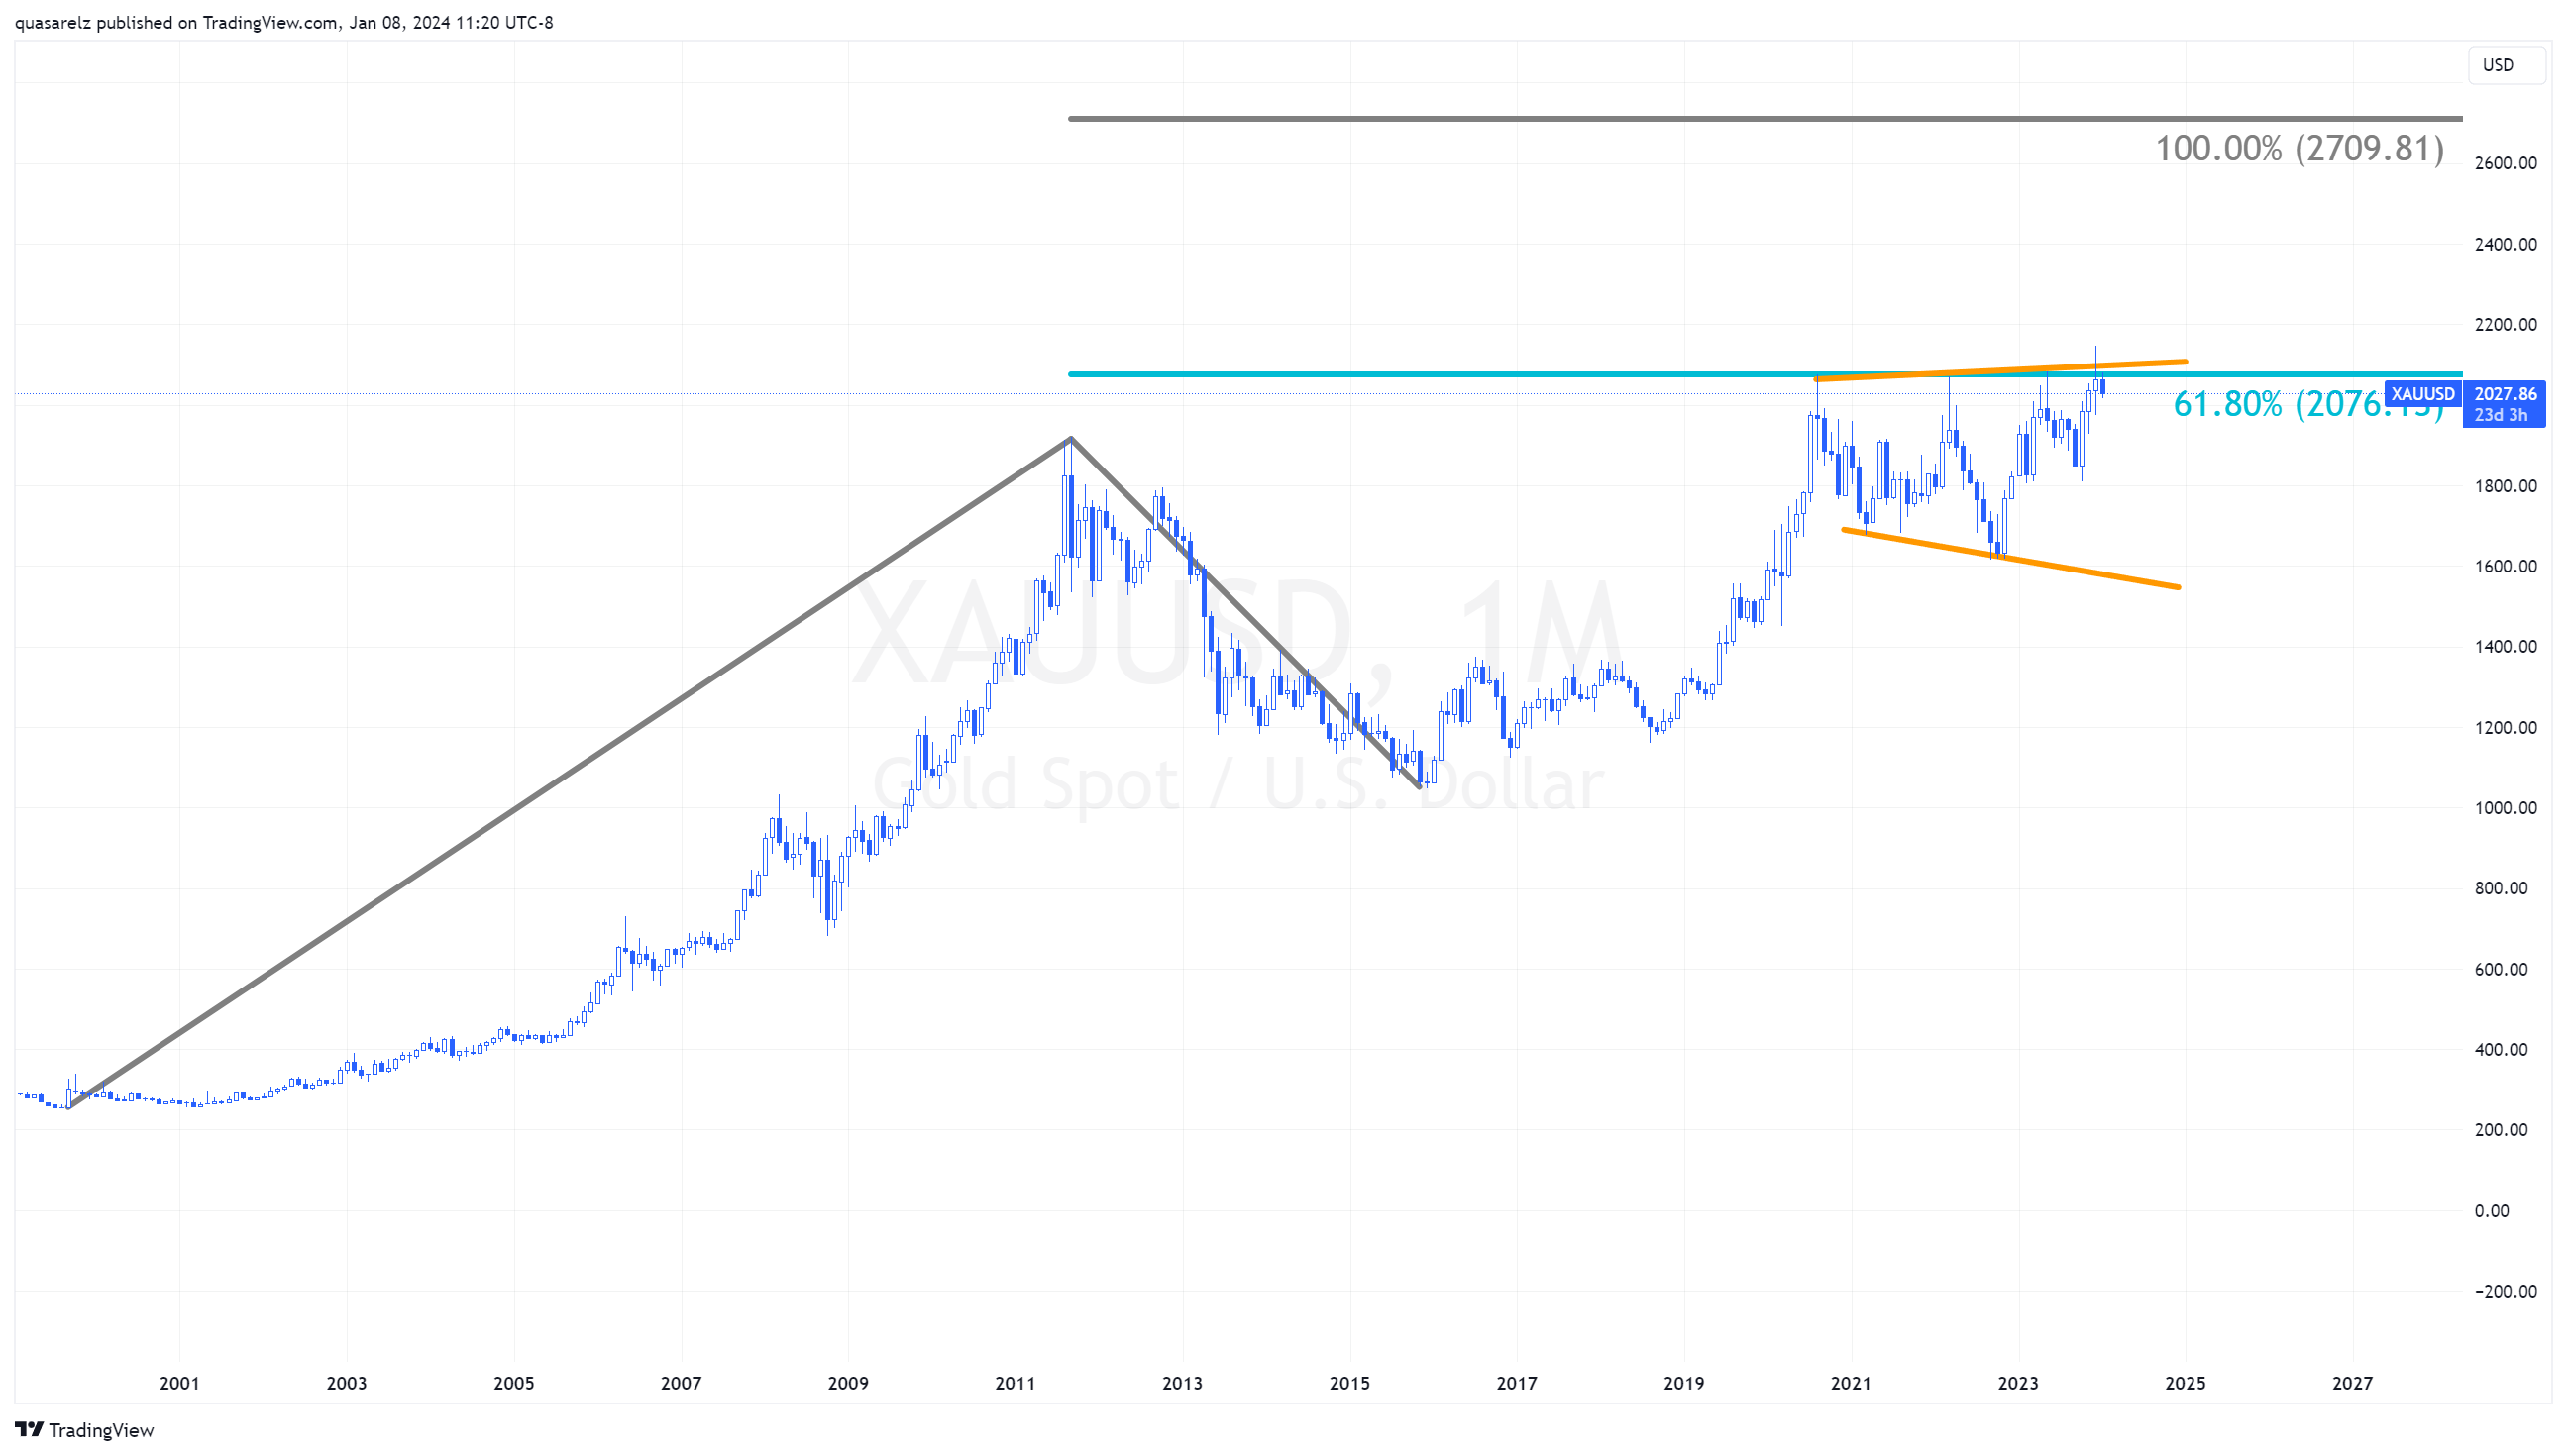
However, what catches my attention the most at this moment is the analysis on the monthly chart. In this longer-term timeframe, gold appears to be taking a breather after reaching the 61.80% Fibonacci expansion level of its previous uptrend. Alternatively, it could be in the midst of an expanding triangle pattern.
If gold is just taking a breather, this could theoretically open the door for gold to finally break above the $2,075 per ounce resistance, and the next long-term target could be at the $2,709 level. It is important to note that this scenario is unfolding on a monthly chart, implying that it could take a considerable amount of time to reach that target.
Regarding the expanding triangle scenario, typically, after encountering resistance within this formation, attention would be focused on the base of the triangle. Personally, I see this option as having less potential at the moment.
The material provided here has not been prepared in accordance with legal requirements designed to promote the independence of investment research and as such is considered to be a marketing communication. Whilst it is not subject to any prohibition on dealing ahead of the dissemination of investment research we will not seek to take any advantage before providing it to our clients.
Pepperstone doesn’t represent that the material provided here is accurate, current or complete, and therefore shouldn’t be relied upon as such. The information, whether from a third party or not, isn’t to be considered as a recommendation; or an offer to buy or sell; or the solicitation of an offer to buy or sell any security, financial product or instrument; or to participate in any particular trading strategy. It does not take into account readers’ financial situation or investment objectives. We advise any readers of this content to seek their own advice. Without the approval of Pepperstone, reproduction or redistribution of this information isn’t permitted.