The argument from economists remains whether we get an L- or V-shaped recovery in China, where we know Q1 GDP will be weak, but the quarters ahead are expected to gravitate back above the 5.5% rate as stimulus feeds consumption and supply chains resume full order. One questions how weak the low will be in the ‘V’ and given all we’ve heard one would not be surprised if this came out well shy of 4%.
We then need to take a view on global growth, with the consensus largely expecting global growth to hit by 30 to 50bp in Q1 – but that predicated on the information flow we know or believe we know.
It will, however, give traders confidence that corporates are restarting production, and many get the sense that bonds and commodities are pricing a scenario somewhere between the L and V. The situation obviously remains fluid, and we haven’t yet reached a point where we can have confidence in the containment aspect, as the death toll in China has risen above 1000, with total global confirmed cases rising above 43,000. Equities have powered on and have made up their mind that supply chain disruptions are not going to lead to a global recession and if anything, it just incentives central banks to stay nimble.
It’s the NASDAQ 100 that steals my focus in equity markets as the tape looks genuinely impressive closing 1.2% higher, and while it feels wrong, this trend says stay long for now. Gains in the S&P 500 and Dow were less impressive with gains of 0.7% and 0.6% respectively. Earnings have rolled in and they have been solid, while equity traders’ sense central banks have their back, liquidity dynamics still favour buying pullbacks and new highs just attract FOMO money. How many money managers are seeing the S&P 500 up 3.8%, let alone the NASDAQ up 7% YTD, and feeling hot under the collar?
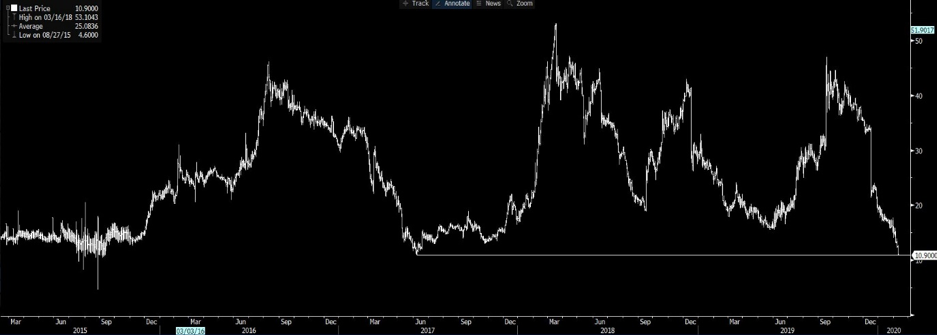
(FRA/OIS Spread)

Source: Bloomberg
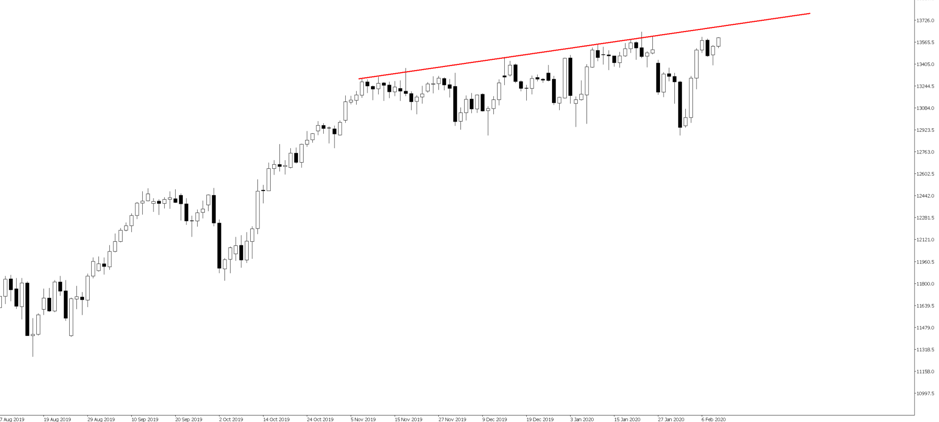
Keep the DAX (GER30) on the radar, with the index eyeing a new all time high (ATH) on open and a test of the November trend resistance and even 13700 seemingly on the cards.

The bond market has been painting a dour message for weeks now. Reflation, the trade/thematic most banks were pushing at the start of the year is either dead in the water, or on ice for a decent stretch, and this has been seen front and centre in the sharp declines in oil, copper and industrial commodities. We are seeing inversion in yield curves again, while ‘real’ (or inflation-adjusted) Treasury yields headed ever further negative and this is key.
US 5-year ‘real’ Treasury yields now sit at -24bp, with 10s at -9bp, while nominal Treasury yields sit at a multi-year range low. Low yields simply re-enforce the attractiveness of the expected future cash flows of these high cash flow, high P/E names, and increase the NPV (Net Present Value) of the stock. Equities are seemingly a by-product of fixed income.
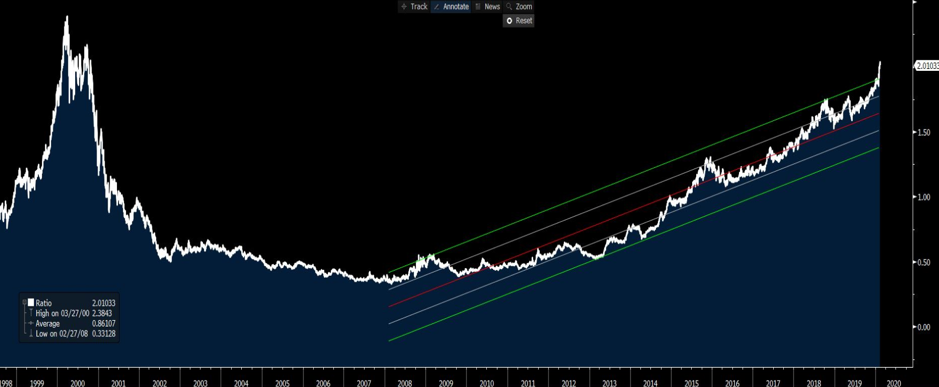
The fact Asian equities are higher today is perhaps more confusing for those looking at the message in global bond markets, but we come back to our friend; liquidity. The ASX 200 is pushing the 7060-supply level, and tactically for those having limited faith on a further equity rally, I would look at the long NASDAQ, short ASX 200 as a pair’s strategy. Here, I have looked at the ratio of the two (both priced in USDs), where the NASDAQ is the denominator (i.e. if the index is going up the NAS is outperforming). Granted, the move has become stretched but any outperformance from the ASX and I will be looking at this as a long/short strategy.

King USD reigns supreme
We have to touch on the USD, as moves in the greenback have to be getting to a point where Trump will become more active on Twitter to talk it down. It's rare we see the USDX gaining for six straight days, but this is life as the least dirty t-shirt. The USD exceptionalism trade rolls on, and while we can look economic data consistently beating expectations (I look at the Citigroup economic surprise index here), solid US corporate earnings or political uncertainty creeping up in Germany, the USD is finding buyers all too easily.
I have focused on AUDUSD of late, and while the pair finds bids all too ready to support below the 67-handle, if this gives way then there isn’t a lot of support through 0.6656 and should this give way then we will be talking about 60c more openly. USDCAD into 1.3350 looks key and much resides on the fate of crude which looks supported sub-$50. GBPUSD traders will be watching Q4 GDP (20:30 AEDT), with expectations of no growth on the quarter, and with price breaking through the series of lows through January it seems now is not the time to be long GBPs, even if the structural story is a positive one longer-term.
EURUSD is where I am focused most prominently, with the pairs eyeing a break of the figure and October low of 1.0878. Price is oversold and has breached the target of the head and shoulders pattern (daily chart), but rallies are to be sold and I would be looking at fading this into 1.0960.
Ready to trade?
It's quick and easy to get started. Apply in minutes with our simple application process.
The material provided here has not been prepared in accordance with legal requirements designed to promote the independence of investment research and as such is considered to be a marketing communication. Whilst it is not subject to any prohibition on dealing ahead of the dissemination of investment research we will not seek to take any advantage before providing it to our clients.
Pepperstone doesn’t represent that the material provided here is accurate, current or complete, and therefore shouldn’t be relied upon as such. The information, whether from a third party or not, isn’t to be considered as a recommendation; or an offer to buy or sell; or the solicitation of an offer to buy or sell any security, financial product or instrument; or to participate in any particular trading strategy. It does not take into account readers’ financial situation or investment objectives. We advise any readers of this content to seek their own advice. Without the approval of Pepperstone, reproduction or redistribution of this information isn’t permitted.
