- English
- 中文版
Analysis
Central bank meetings - the art of understanding what is priced in

The idea of understanding ‘what’s priced in’ has been seen front and centre this week and it’s a science all traders should try to understand – Case in point, the ECB hiked by 75bp – the biggest hike in its history and yet EURUSD fell 90 pips. I can imagine many new traders buying EURs because they’d heard the ECB was likely to pull out the big guns, only to be astonished when price fell.
As a starting point, for those not familiar, a ‘basis point’ (bp) is equivalent to 0.01% - so a 1 basis point rise would be 1.00% to 1.01% (or 100bp to 101bp)
Trading a central bank meeting is rarely straightforward
Granted, not everyone wants to trade the outcome of a central bank meeting – it’s hard, and there are many variables to consider. However, most traders, especially those using a higher degree of leverage, should absolutely review the upcoming meeting for the propensity for outsized movement and volatility. The obvious question being whether to hold, reduce or close positions over the event risk.
Some will attempt to trade the outcome of a central bank meeting. For that, having a strong understanding of what is priced into markets is essential. An understanding of the best, or most sensitive market to trade is also advantageous. For example, I would often see USDJPY as the cleanest play on the FOMC meeting as it’s the most sensitive/correlated to short-term interest rate changes.
I’d love to say market movement is driven solely on the change to the current policy rate and whether they hike (or cut) by 25, 50, 75, or even 100bp. Recall, that aside from the RBA, central banks tend to lift their policy rate in increments of 25bp. However, life just isn’t that simple - often it’s not just about whether the market is priced correctly for the meeting in question, but also how the central bank's outlook marries up with where market expectations for interest rates are in the future.
We then also need to consider the tone of the statement, economic forecasts (if they are provided) and sometimes explicit projections of future interest rate settings. These all need to reconcile with market pricing, and these can often be far more important than a simple hike at the meeting, especially when the market has already discounted that outcome.
How do we know what is discounted?
Traders can express a view on a central banks future interest rate settings using overnight index swaps (OIS) or interest rate futures – such as the fed funds future or Australia's 30-day cash future. Traders can essentially speculate on changes in interest rates or hedge their interest rate risk through these instruments. They are what all other key markets, like currencies or indices CFD, focus on as their guide – they are essentially the first derivative.
When we say a ‘75bp hike is priced in’, we are looking at the tradeable interest rate markets to assess this call.
As with any futures contract, there are known periodic contracts – in most interest rate contracts are monthly, but they can be quarterly, Eurodollar futures for example. Essentially, a trader can choose any month where they feel rate expectations are too high or low and trade that pricing accordingly.
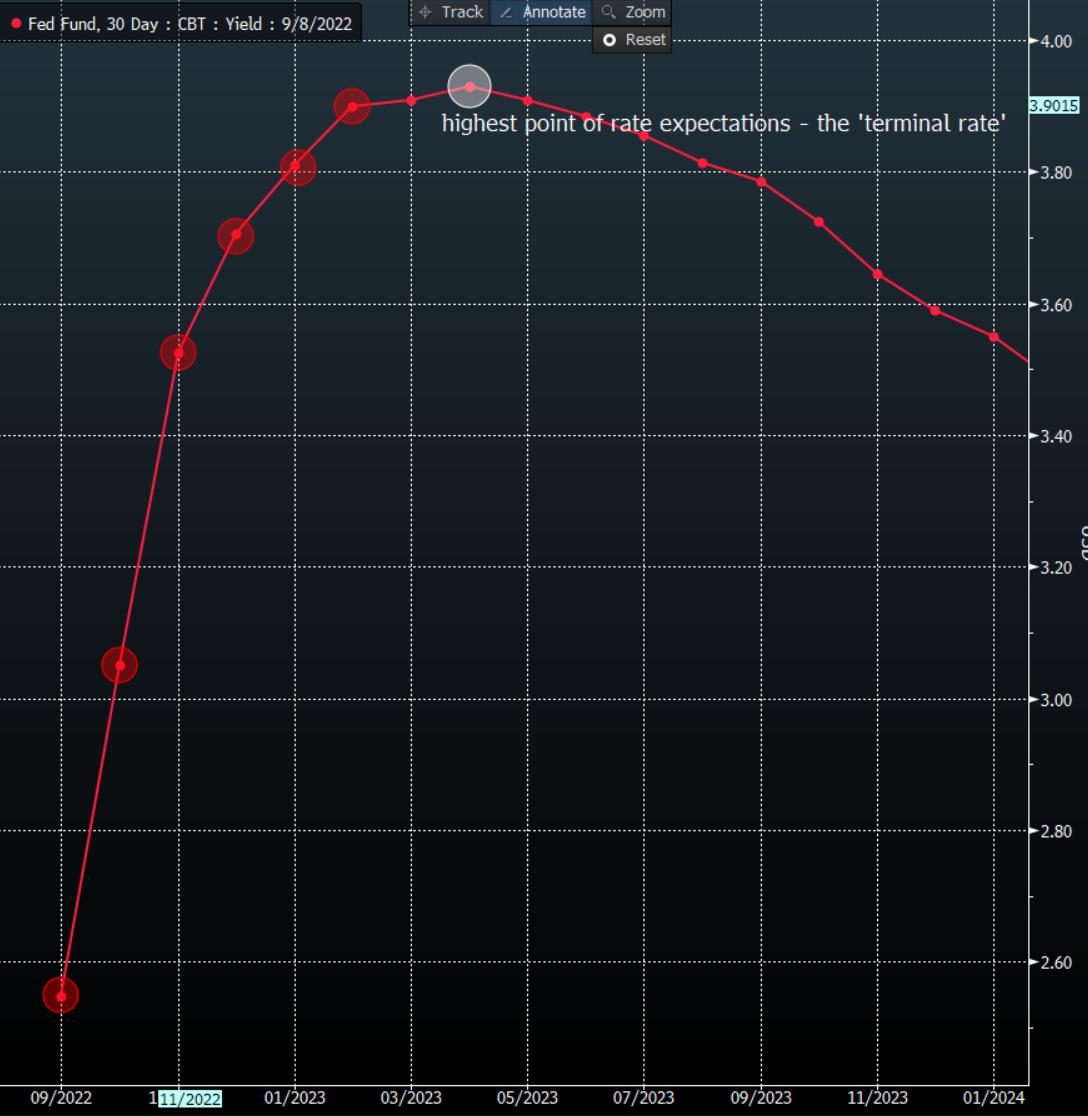
The view of looking at what is priced into each futures contract in the months ahead is called the ‘rates curve’ or ‘term structure’. We see this above with the fed funds future curve, which has monthly contracts to trade (detonated by the red circle).
An interest rate trader will use the price of the futures contract to calculate what the implied policy rate setting is for that month – they’ll understand how many basis points (bp) are therefore priced in – once they have that quantitative intel, it’s from here they can trade their view.
For margin FX, commodity CFD and equity traders, a number of the major central banks have made it easier for us to understand current market pricing, offering rates pricing calculators – granted the intel is not as dynamic as live interest rates pricing, and in most cases, it is updated daily at the close – but unless you’re trading interest rates I don’t think it matters too much and it still offers a strong understanding for our risk assessment into known event risk.
For current pricing we can look at:
- Fedpricing - https://www.cmegroup.com/trading/interest-rates/countdown-to-fomc.html
- BoE pricing - https://www.cmegroup.com/trading/interest-rates/bank-of-england-watch-tool.html
- RBA pricing - https://www2.asx.com.au/markets/trade-our-derivatives-market/futures-market/rba-rate-tracker
Pepperstone publishes this interest rate expectation table weekly – here we take the interest rate pricing to calculate the implied policy setting for each near-term monthly futures contract. We then take the ‘effective rate’ – this is the true interest rate and the price that banks borrow overnight and look at the difference between the two.
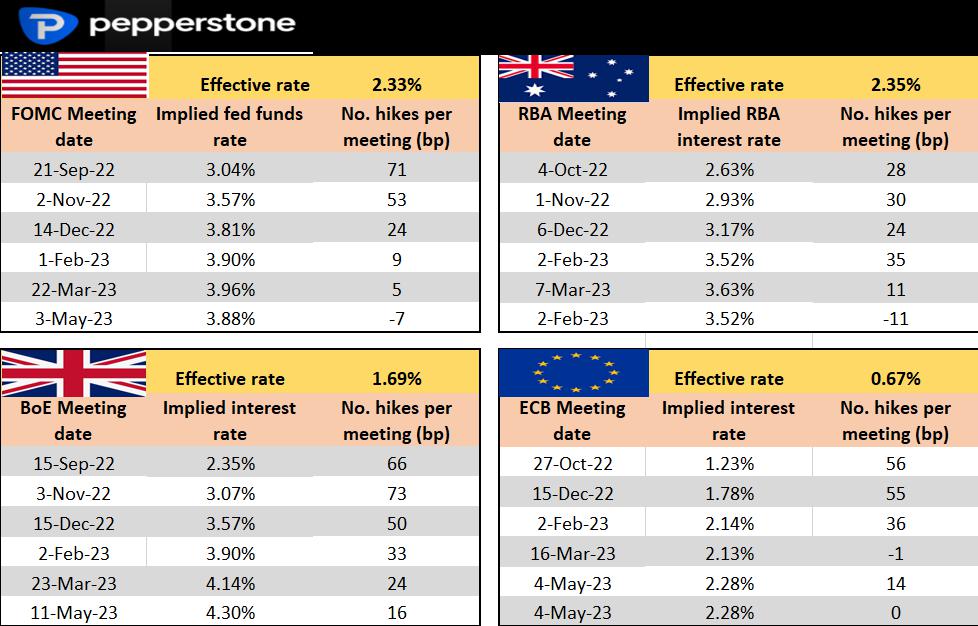
It tells us ‘what is priced in’. For example, if we take the 21 Sept FOMC, we can see 71bp of hikes are priced in. Subsequently, if the Fed were to hike by 75bp (recall they lift in increments of 25bp) then all things being equal the USD shouldn’t react too much – the hike was priced. This is where we look at other variables, such as the tone of the statement and their economic projections and whether they marry up with future pricing.
We then take the next month contract and the implied policy rate to look at the ‘step up' in basis points. For example, the market currently expects around a 50bp hike in the November FOMC meeting.
So, going back to the ECB and even the RBA meeting - why did the EUR (and AUD) fall when the bank hiked so aggressively? It was already expected and other factors such as a sour growth outlook and a continuation of asset purchases until 2024 were the decisive factors.
If trading margin FX, commodity CFDs, and equity indices CFD, understanding how the market is pricing the event can be key – it's never as easy as just buying the EUR because rates are going up.
Related articles


The material provided here has not been prepared in accordance with legal requirements designed to promote the independence of investment research and as such is considered to be a marketing communication. Whilst it is not subject to any prohibition on dealing ahead of the dissemination of investment research we will not seek to take any advantage before providing it to our clients.
Pepperstone doesn’t represent that the material provided here is accurate, current or complete, and therefore shouldn’t be relied upon as such. The information, whether from a third party or not, isn’t to be considered as a recommendation; or an offer to buy or sell; or the solicitation of an offer to buy or sell any security, financial product or instrument; or to participate in any particular trading strategy. It does not take into account readers’ financial situation or investment objectives. We advise any readers of this content to seek their own advice. Without the approval of Pepperstone, reproduction or redistribution of this information isn’t permitted.