- English
- 中文版
Analysis

See our BoE preview here.
Despite all the incoming event risk, volatility remains bitterly subdued, and G10 FX daily high-low ranges are at YTD lows. Is this the calm before the storm, or just a calm….?
We obviously don’t know, but as traders, we must adapt to the market environment and volatility settings. Predicting when volatility and sustained range expansion break out has become a pastime for many market players.
Volatility is typically a function of changes in liquidity, but it also reflects our confidence to price risk and certainty. Right now, with inflation volatility in decline and growth – the emerging core thematic for markets – evolving at a glacial pace, there aren’t too many reasons to hedge risk or buy volatility.
One factor that could become problematic for risk is the bull move across the energy complex – crude, gasoline, diesel, and other refined products. Nat Gas is another big consideration but that remains in a massive basing pattern, but when it goes it could really go.
Many have asked how long we’d need to see high energy prices before it causes a reaction from central banks. For now, the Fed will completely look through the recent spike in crude next week and wait for greater evidence to emerge for the various surveys they conduct. Duration matters though, and the longer energy stays at the levels the greater the impact on headline inflation and the household/consumer.
A spike in energy does galvanize expectations for the ‘higher for longer’ mantra in rates settings– the concept of keeping interest rates at current levels for an extended period to see inflation back to target. It feels perhaps a touch early for this to be planted in the market mind, but the ‘Dots’ plot projection – the line item in the Fed’s quarterly economic projections, where respective Fed members offer a call on where they see the fed funds rate for three years out – could offer a source of market volatility.
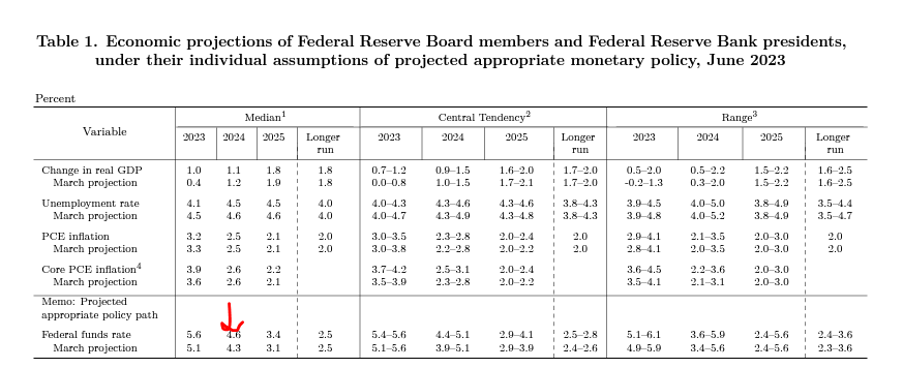
Essentially, the Fed could signal a tightening of the higher for longer, by lifting the median ‘dot’ from 4.6% to 4.9%.
With US interest rate markets pricing 107bp of cuts next year, if the Fed use the 2024 ‘dot’ to tighten financial conditions, it could see rate cuts for 2024 being priced out, which would push the USD further higher, causing higher cross-asset volatility. As I say, this may be premature, but it is a risk.
Related articles

The material provided here has not been prepared in accordance with legal requirements designed to promote the independence of investment research and as such is considered to be a marketing communication. Whilst it is not subject to any prohibition on dealing ahead of the dissemination of investment research we will not seek to take any advantage before providing it to our clients.
Pepperstone doesn’t represent that the material provided here is accurate, current or complete, and therefore shouldn’t be relied upon as such. The information, whether from a third party or not, isn’t to be considered as a recommendation; or an offer to buy or sell; or the solicitation of an offer to buy or sell any security, financial product or instrument; or to participate in any particular trading strategy. It does not take into account readers’ financial situation or investment objectives. We advise any readers of this content to seek their own advice. Without the approval of Pepperstone, reproduction or redistribution of this information isn’t permitted.