- English
- 中文版
A slippery slope for crude
Getting some context
When we look at the performance of and trends in a given market or instrument, it's helpful to take a step back from the current price action and look at what's been happening over the last month, quarter, and indeed year.
If nothing else, looking at some longer-term data will provide historical context for the current price action and may even throw up some levels of interest.
A data surprise
Below you’ll see the performance of some key energy markets over four specific time frames.
I have to admit I didn't think that Brent and WTI crude oils were down by a double-digit percentage over the previous year, or indeed by high a single figure in the case of WTI month-to-date.
The energy complex price performance % change
EnergyPriceDailyWeeklyMonthlyAnnuallyCrude Oil60.568-1.37%-3.10%-7.54%-13.85%Brent69.8853-1.44%-3.26%-5.79%-10.84%Natural gas2.54590.35%-3.49%3.45%-13.37%Gasoline1.9722-0.94%-3.91%-6.92%-11.31%Heating oil2.0219-1.39%-4.72%-3.61%-10.76%Ethanol1.3641-0.22%1.65%4.69%-8.88%Naphtha553.91-0.83%0.07%-1.74%-17.74%Propane0.59-1.15%-4.64%-8.26%-36.31%Uranium24.60.00%0.00%-4.65%7.42%
This data implies a pretty significant and consistent downward pressure on oil prices, and that the negative momentum has been building for some time. However, that's not the whole picture. The table doesn't tell us just what has happened to oil prices over the previous three and six-month periods.
In fact, as we can see from the candlestick chart of WTI (the second of the three charts set out below) crude prices rose consistently and steadily from late December 2018 through to the 23rd of April when they peaked.
A downward path
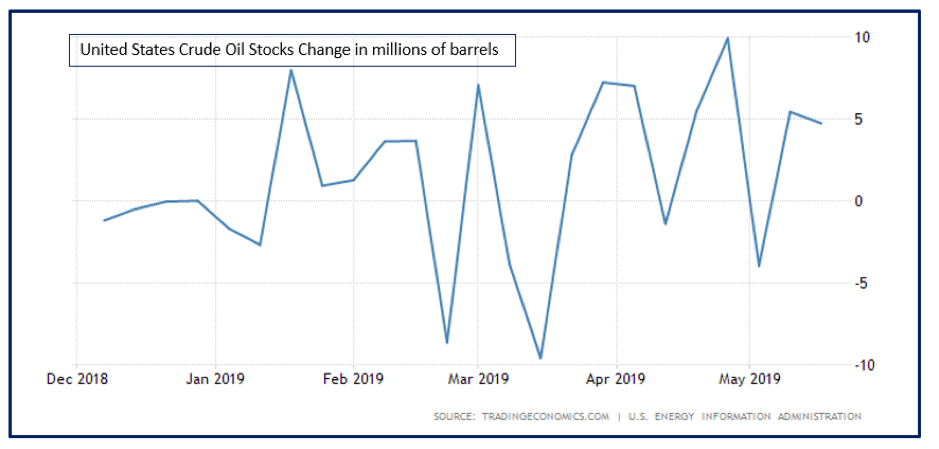
Since then, WTI has mostly been on a downward path. The weakness in price has coincided with a build in US crude inventories, which increased by 4.74 million barrels in the week ending 17th of May.
This was the second week in a row that US crude stockpiles had unexpectedly risen. This created something of a mini-supply shock, which, when coupled with growing concerns about global trade and growth, was the catalyst for a sell-off.
US crude oil stocks
Indeed if we look at the chart for WTI we can see that it has recently broken below both its 20 and 50 day EMA lines. As I type, it’s testing back below the 6 May low at US$60.04.
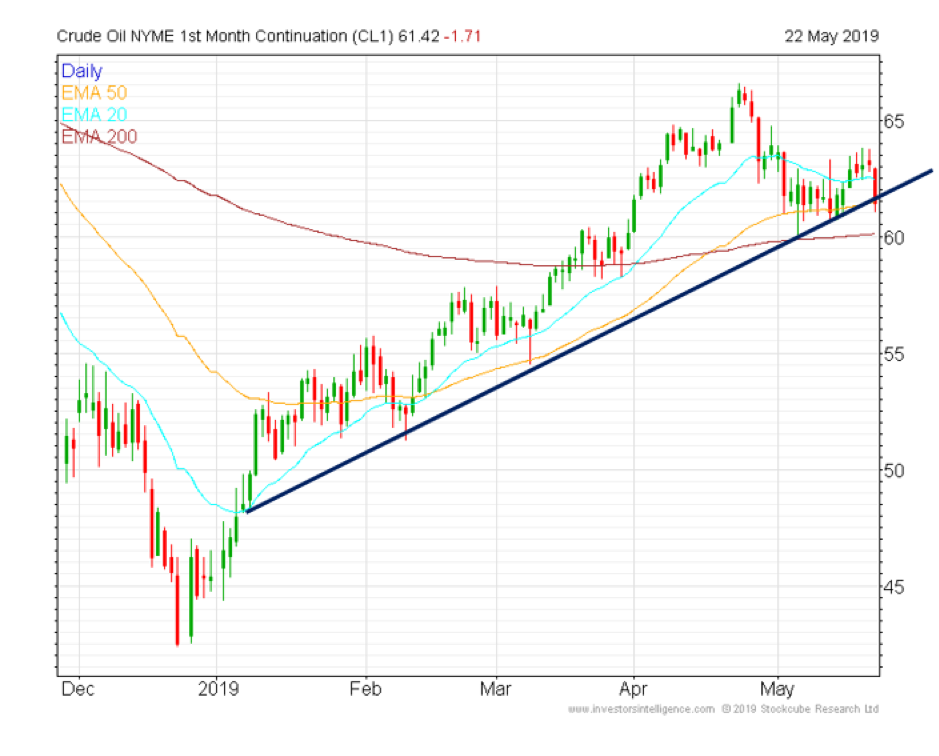
The area between $60.00 and $60.40 has been a sounding board for WTI this year, acting as resistance in the latter part of March. That resistance was finally broken on the 1st of April. The question now is: was that upside move just an April fools prank?
Supply side factors
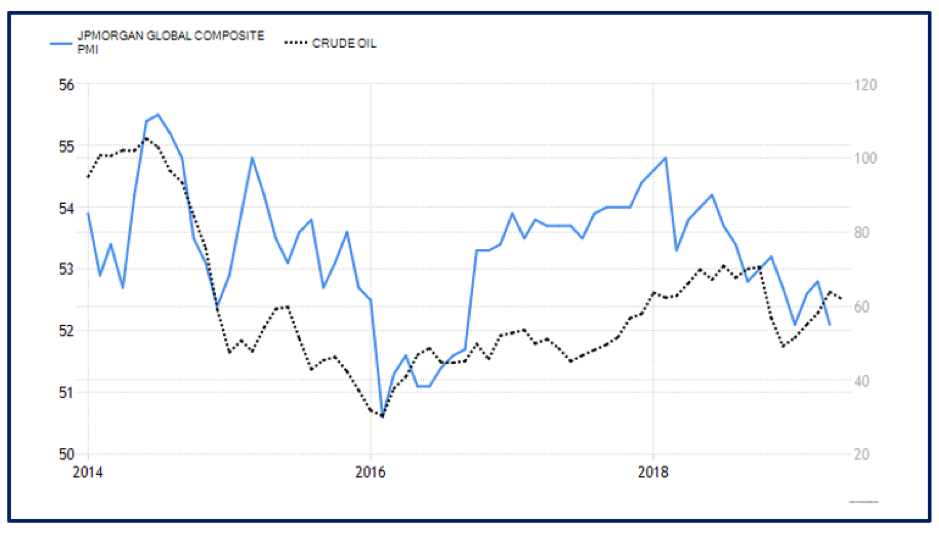
Investment bank Morgan Stanley highlighted the two-way pull on oil in a recent note saying that building supply had to some extent been offset by rising political tensions in the Persian Gulf, between Iran, the US, Saudi Arabia and its regional allies. However, the bank noted that the recent deterioration in the macro backdrop has tipped the scales in favour of supply: slowing global growth and the prospect of an elongated trade dispute, as well as a possible trade war between the US and China, are depleting the case for additional demand for crude.
Morgan Stanley flagged that demand among OECD nations fell by 600,000 bpd during March, and let's be honest: sentiment has not improved since.
JPM global composite PMI vs WTI crude
Lines in the sand
One one hand, a 200-day moving average is just a mathematical concept. On the other hand, it represents trader sentiment over the previous 40 weeks (roughly 80% of the year). This creates a line in the sand, even if it’s just a metaphorical one.
It looks likely we will start the week below the 200-day EMA line. If this holds, we will not only have a broken metaphor, but also the uptrend line that has been in place since the 8th of January. From here, we could start to whittle away at the rest of this year’s gains.
I say that because the model I follow has a very aggressive price objective for WTI. In fact, you would have to call it extreme - so extreme that we haven't been anywhere near this price since early October 1998. Given that the model is so aggressive and that it sees WTI as being a strong bear trend, I don't believe we can ignore it.
So let's have a look at some potential downside levels, starting with the 28 March low of $58.20, then the 15 March low of $57.74, followed by the 22 Feb low of $56.64.
The 4 February high of $55.75 comes into view, followed by the 8 March low of $54.52.
The 11 February low of $51.23 is also worth being aware of in case the downside momentum gathers further pace.
The obvious place for a stop-loss on any short positions would be back above the 200 day EMA line, however if that doesn't make sense from a money management standpoint, $59.29 could deputise.
The material provided here has not been prepared in accordance with legal requirements designed to promote the independence of investment research and as such is considered to be a marketing communication. Whilst it is not subject to any prohibition on dealing ahead of the dissemination of investment research we will not seek to take any advantage before providing it to our clients.
Pepperstone doesn’t represent that the material provided here is accurate, current or complete, and therefore shouldn’t be relied upon as such. The information, whether from a third party or not, isn’t to be considered as a recommendation; or an offer to buy or sell; or the solicitation of an offer to buy or sell any security, financial product or instrument; or to participate in any particular trading strategy. It does not take into account readers’ financial situation or investment objectives. We advise any readers of this content to seek their own advice. Without the approval of Pepperstone, reproduction or redistribution of this information isn’t permitted.