- English
- 中文版
.jpg?height=93&quality=100)
DXY:
The main event of the week was the Fed’s meeting on Wednesday, where the market was expecting monetary policy to be left unchanged. The Fed funds target range remained at 0-0.25% and the quantitative easing (QE) program continues to run at $120 bn a month. Where the uncertainty lay was in the median 2023 dot plot for the Fed Funds rate as well as clarification on the Supplementary Leverage Ratio (SLR) exemption. The street had become too hawkish expecting a hike in the median 2023 dot and when it came in flat there was a knee jerk reaction across a multitude of assets. This was simply a recalibration of expectations to outcomes. Their reaction function now through the prism of Average Inflation Targeting takes the form of being reactive vs proactive, being led by actual data outcomes vs forecasts. Jerome Powell stated “we’re not going to act pre-emptively based on forecast, we’re going to wait to see actual data. This buys them some time – probably until the June meeting where I expect to see a hike in the median 2023 Fed Funds forecast as we are provided with even stronger economic forecasts.
Looking at the Fed’s latest economic projections inflation is expected to exceed the Fed’s 2.0% target to 2.4% this year, however, Powell views it as transitory. Additionally, the Fed want to see a strong labour market (not just unemployment rates, but participation too) before they are galvanized into action. Jobless claims came in slightly higher than expected yesterday, supporting Powell’s focus on recovery in the labour market. Sticking with economic data we don’t tend to give much weight to the Philly Fed manufacturing survey, however, yesterday it exploded higher to 51.8, driven mainly by a spike in the prices-paid index. This feeds into market fears about inflation and was rapidly priced into bond markets via higher yields. Powell remains sanguine on increasing yields as financial conditions remain at multi-year lows. When he was asked whether the Fed would consider Yield Curve Control, he responded that the current pace of asset purchases was appropriate. The only way he could really stem higher yields would be an expansion of the balance sheet via QE, YCC or Operation Twist (shifting purchasing towards longer dated maturity bonds). The Fed just announced that the SLR exemption will expire as scheduled on the 31st of March, yields have spiked higher.
The Buck has bounced firmly on the back of the latest rout in bonds that has shunted benchmark Treasury yields northward. The dollar is now peering its head just above the 92 resistance level and a close above this into the weekend would be a strong signal to the bulls. The 200-day SMA is around 92.6, which seems like a very realistic target above. The RSI still has plenty of room before it’s classified as overbought. I like the dollar’s prospects.
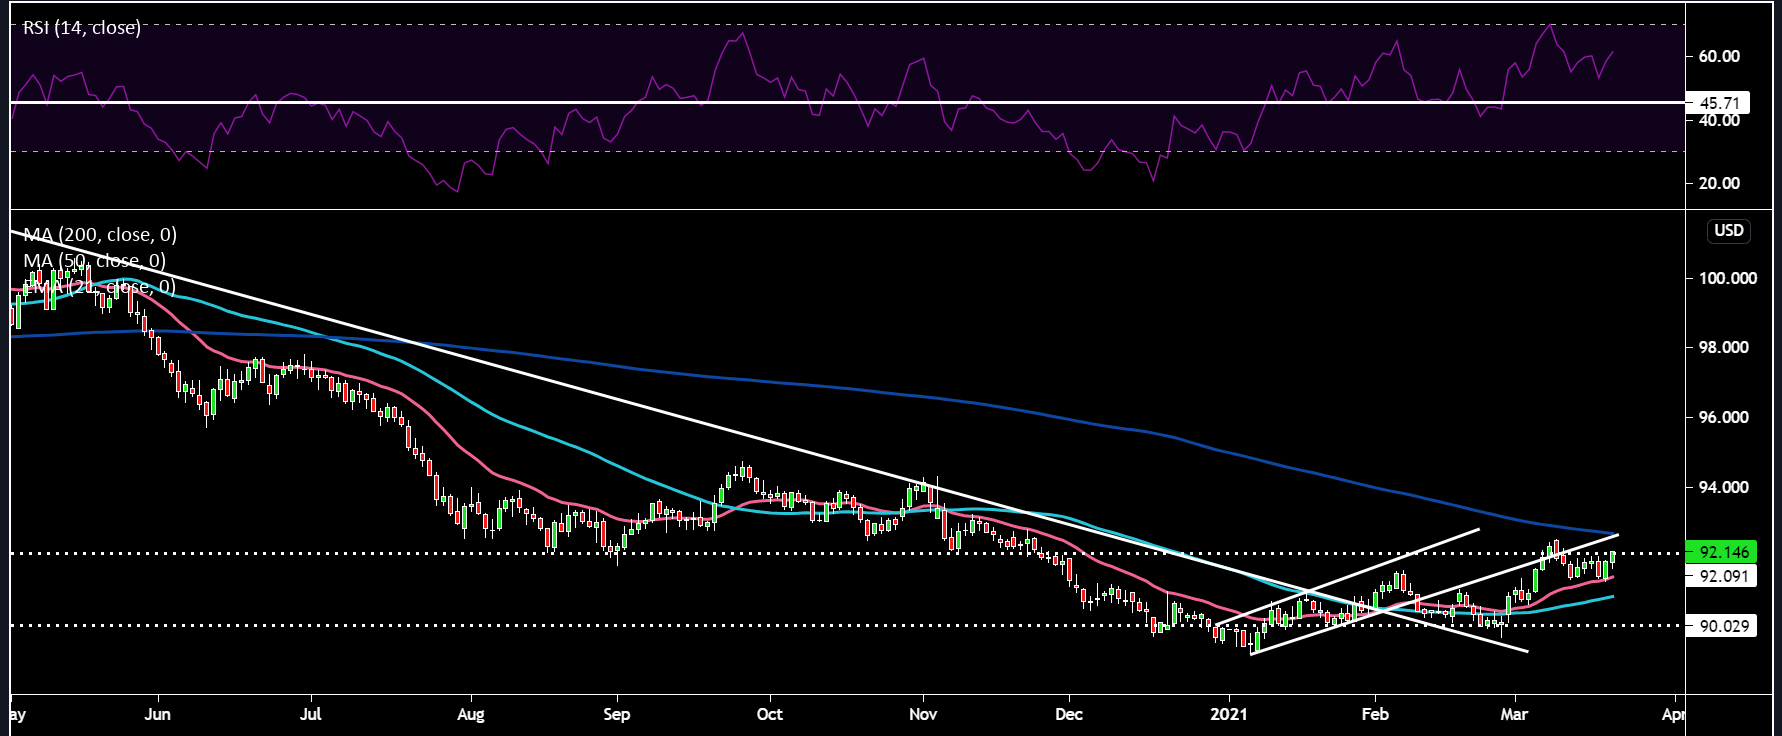
Pink Line: 21-day EMA, Light Blue Line: 50-day SMA, Dark Blue Line: 200-day SMA (same for all other charts)
EURUSD:
The ailing single currency continues to tread heavily with moves lower seeming like the more likely price direction. There has been a torrent of negative news regarding the virus situation over on the European continent. German public health official says it is likely that at Easter we may be in a similar situation as we were at Christmas with the spectre of a 3rd wave becoming a reality. France has now placed further restrictions in Paris and various other regions as hospital capacity reaches its limits. Yesterday, the EMA cleared up all the uncertainty on Astra Zeneca and Germany, Italy, Spain, France, Luxembourg, Lithuania, Latvia, Cyprus, the Netherlands and Slovenia all announced they’ll now start reusing the vaccine as a result. The problem for Europe, however, is that this has created a lack of trust and so called vaccine scepticism which could slow the EU economy’s return to normality and weigh on the euro as the vaccination gap between the EU and US widens even further. Widening yield differentials continue to weigh on the EURUSD, this is down to two reasons – 1) divide between the US and EU’s economic recovery prospects 2) Fed relaxed about longer term yields relative to the ECB. Treasury and German Bund yield differentials are just below 200 bps – highest since Feb 2020. The EU still haven’t deployed their version of stimulus (recovery fund). I find this quite remarkable given that we seem to be in the final innings of this pandemic.
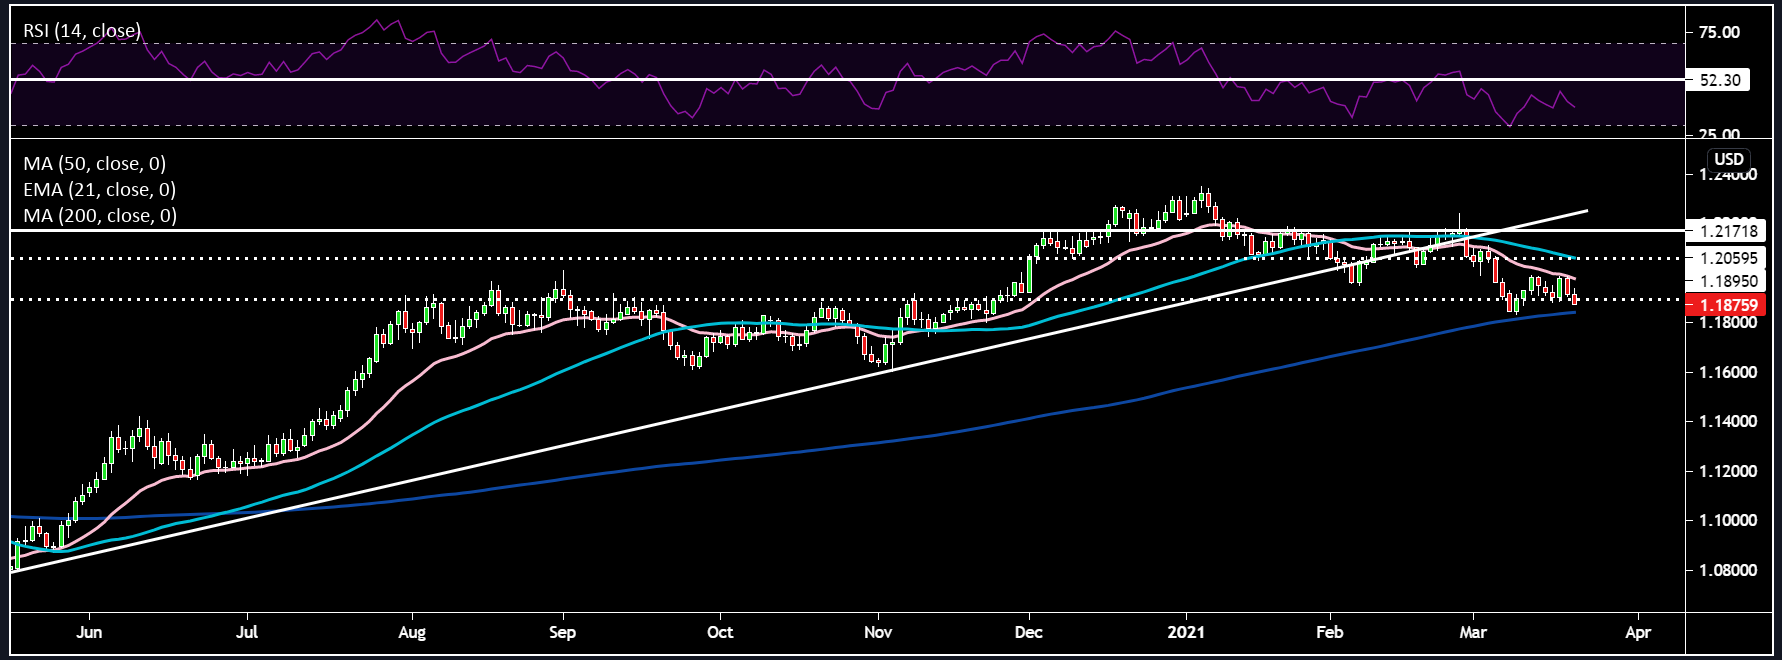
Last week’s positioning data saw liquidations of the euro bringing the net long position to 101.9k contracts (mid-way through last year it got up to 200k). Despite the paring back of net longs, it still remains the largest single currency position. EURUSD has breached the 1.19 support level and looks to be eyeing the 200-day SMA around 1.184. The shorter term moving average is pointing downwards and the RSI is well below the 52 resistance telling me the bias remains down with a short the rallies approach.
GBPUSD:
The Old Lady at Threadneedle Street didn’t give us any surprises on Thursday keeping their policy on hold, voting unanimously to keep the rate at 0.1% and QE at £875 bn. Cable was slightly weaker post the announcement, this wasn’t down to the BoE being more dovish than it usually is, but it wasn’t as hawkish as some may have expected which wouldn’t helped the pound weather the strong dollar strength we saw. The BoE statement, similar to what we’d heard from the Fed contained “the Committee does not intend to tighten monetary policy at least until there is clear evidence that significant progress is being made in eliminating spare capacity and achieving the 2% inflation target sustainably”. I feel they struck a good balance between allowing the market to price in an improving economic outlook without allowing financial conditions to tighten excessively. Thankfully, there was zero mention of negative interest rates in the statement, which seems ironic given that’s all anyone wanted to talk about recently – how fickle markets can be.
You can’t talk about the pound without mentioning Brexit. The EU has begun legal action against the UK over a unilateral decision by the UK to extend the grace period for checks on certain products moving from GB to NI. A formal letter has been dispatched by the EU with which the UK has a month to respond. A failure to address this could lead to fines or retaliatory tariffs being imposed, but like many things with the EU there is a tendency for decisions to take a while and most of the time it’s resolved - so this will be a background issue for the pound at the moment. Reports came out last night that Nicola Sturgeon mislead the Scottish Parliament, which continues to damage her campaign for independence. On this topic, a new poll from Survation revealed 57% of Scots would vote to remain in the Union if a second Scottish independence referendum was held now. Additionally, a new opinion poll from YouGov, shows a strong deterioration in Nicola Sturgeon’s favourability rating with unfavourable at 53%. Besides the fact that I believe Boris Johnson would block a referendum vote, it helps when the appetite to leave is waning in Scotland too. This helps to removes a tail risk for the pound. The Scottish general election is on the 6th of May. There have been some concerns regarding vaccine supply diminishing the UK’s excellent vaccine rollout, however, PM Boris addressed this yesterday stating – “we will receive slightly fewer vaccines in April than in March, but still more than in February, the supply that we do have will still enable us to hit the targets that we have set". Good news!
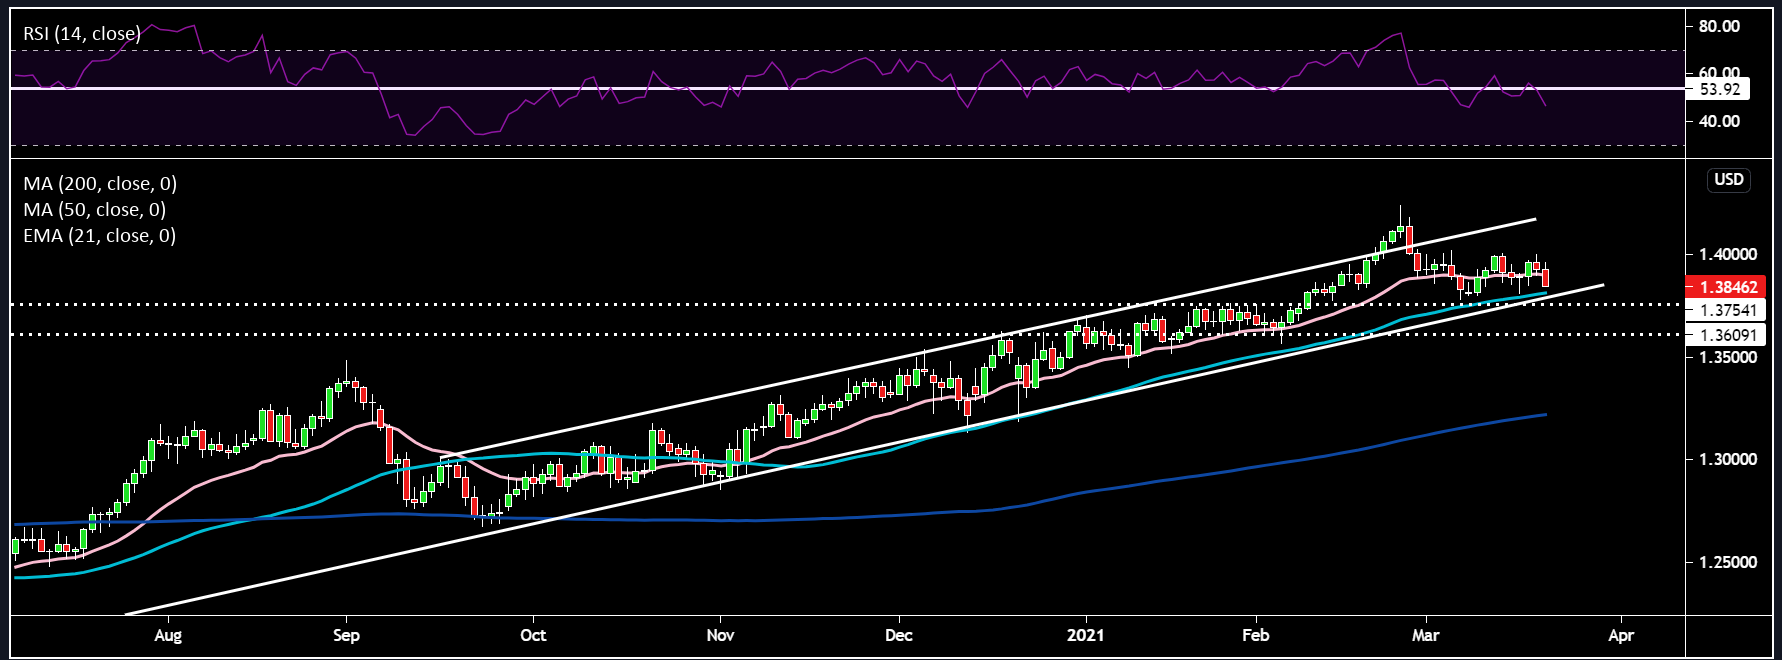
Cable is trying to hold above the 1.385 level, but is struggling against a stronger dollar and could come back towards the lower trend line of the ascending channel and the 50-day SMA around the 1.38 region. The RSI reading is now below the 54 support as price tries to find some direction. Think we consolidate a bit around here now.
USDJPY:
The dollar yen continues to bobble around the 109 region after the conclusion of the much anticipated BoJ policy review results. Well it looks like that Nikkei article released yesterday was bang on the money as the BoJ widened their yield curve target band from 20 bps to 25 bps and scrapped their annual 6 trillion yen ETF purchase target (still keeping their 12 trillion yen ceiling though). Additionally, their ETF purchases will now be targeted towards the Topix as opposed to the Nikkei as previously. They also announced a new loan incentive scheme and tiering system to let the market know that they still have room to send rates further south without hurting banking profits. The BoJ were in a tough spot as they tried to strike a good balance between adverse effects of monetary policy and continuing their supportive stance. Given the recent dollar strength the yen didn’t appreciate all that much and is only down about 40 pips since the news broke.
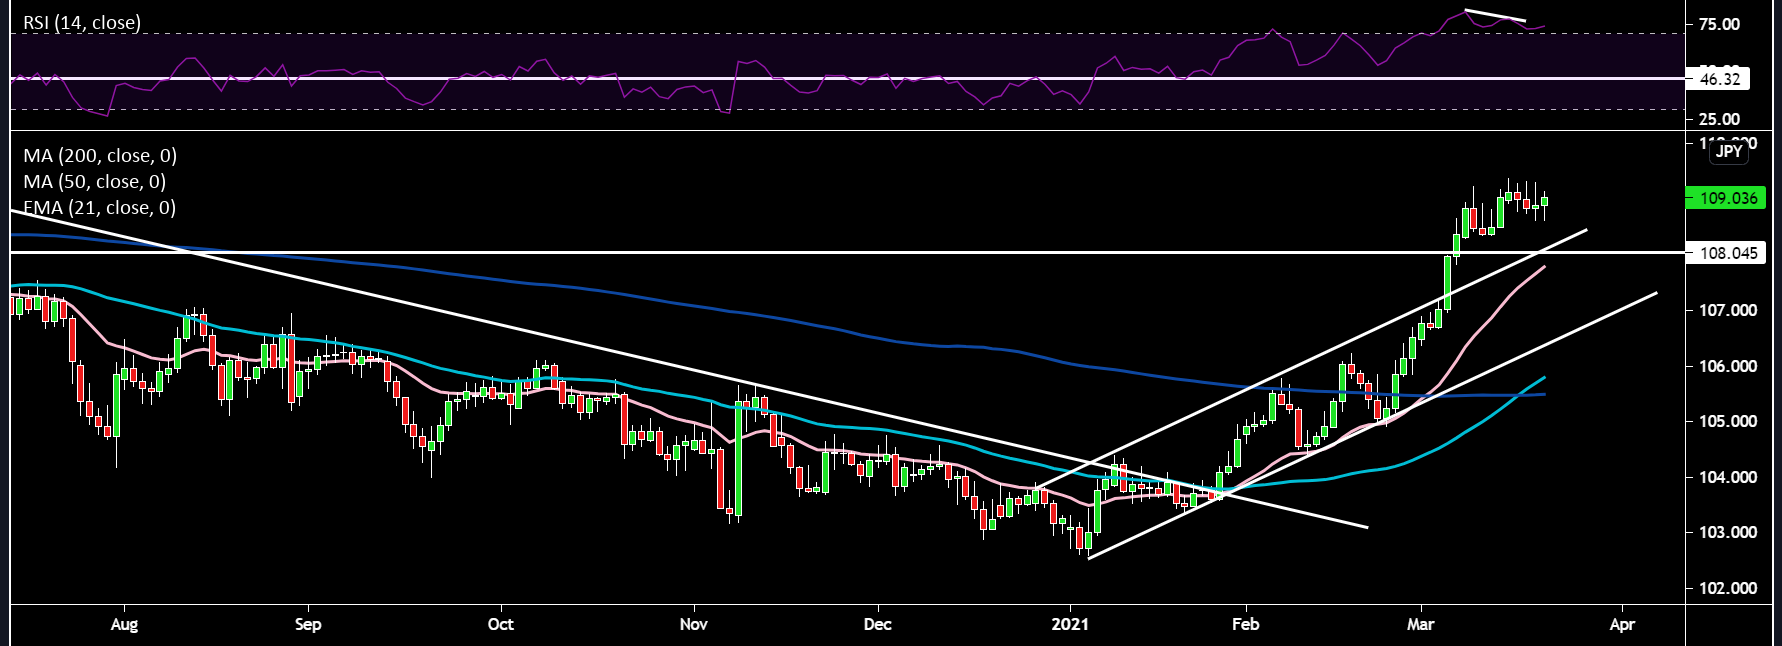
The chart was looking as if this cross was going to rollover lower towards the 108 support level as the RSI was showing divergence with price. However, the spike higher in US yields has stemmed yen strength given its strong inverse correlation with US 10-year yields. On a really strong rally in US yields I don’t see why the 110 level can’t come into play. However, the pair will need to clear the 109.2 resistance first, which has attracted sellers in recent days.
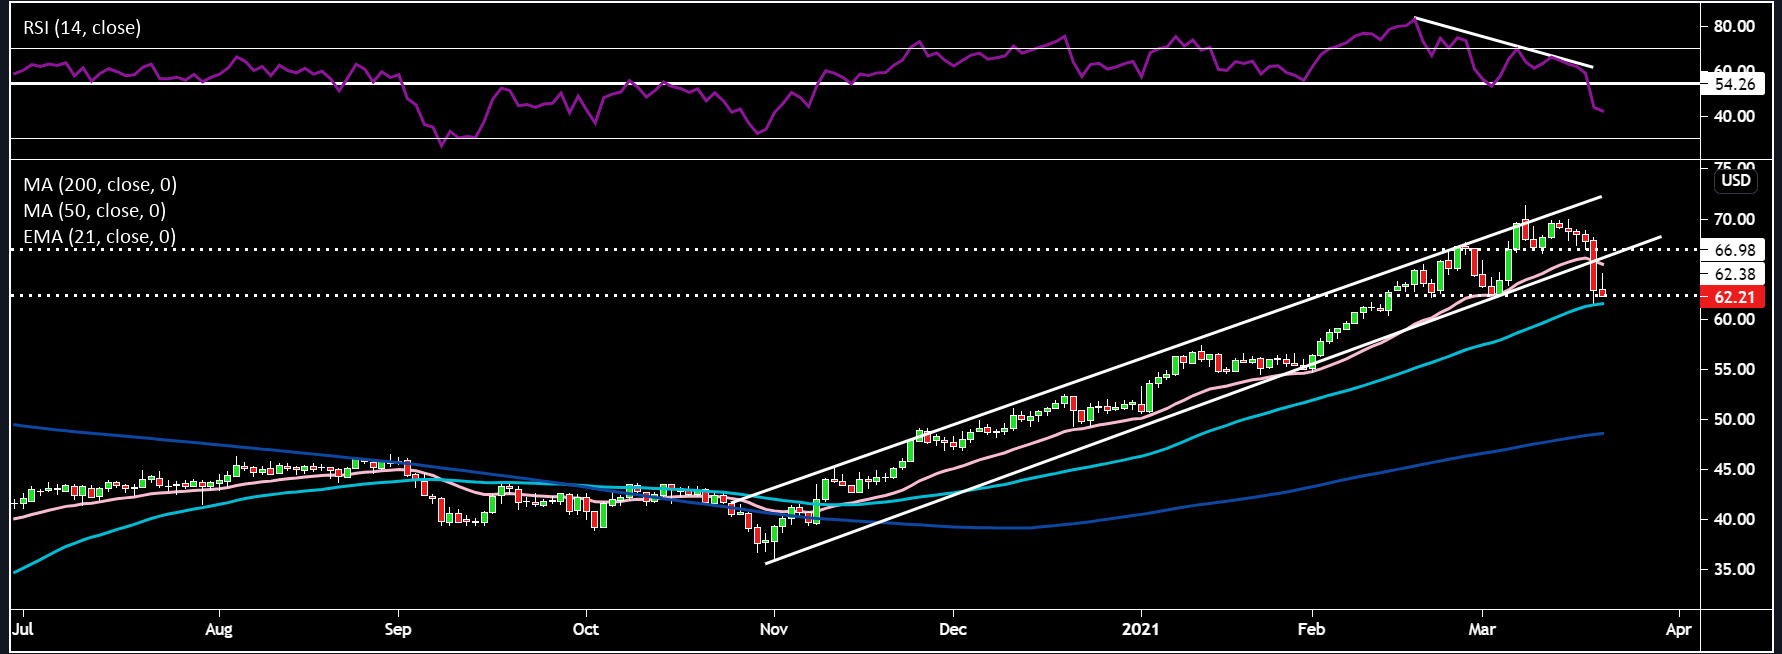
OIL:
Market participants were left scratching their heads yesterday as brent slumped by roughly 7% on the back of zero news flow. I suppose one could say the further restrictions in Europe could have hit demand, but I think it could have just been a technical move with profit taking triggering stops and causing further reductions in speculative positions, which there are quite a few in the oil complex. Price had also gone up almost in a straight line and was circa 40% above its 200-day moving average (multi-year highs). I think this highlights the short-term risk of the market having reached a level from where current fundamentals are not yet strong enough to support another leg higher in the short-term. A stronger dollar never helps too and the higher yields made the risk environment more fragile. In terms of supply, Iranian oil has been gushing into China in recent weeks, threatening to complicate efforts by OPEC+ to keep supply tight. Private inventory data was mixed. The IEA came out with their oil report this week, pushing back against investment bank views that we’re on the verge of a new price super cycle, with “oil inventories still ample compared with historical levels”. They also noted that oil demand will return to 2019 levels by 2023. We also have to consider what higher prices might do with regards to shale production. Those with a deep knowledge on this topic believe shale is unlikely to grow at the rates seen before the pandemic due to producers' increased focus on free cashflow generation, debt reduction, consolidation and shareholder distributions as opposed to capex.
Price action made a nasty technical break lower through the ascending channel. Price seems to be holding the $62 level support for now as well as being right on the 50-day SMA. There was some negative divergence showing on the RSI as price made higher highs yet momentum began to slow, making lower highs. Divergence is a great tool to add to your trading repertoire. Price is now well below the 54 RSI support and will need to reclaim it if the price is to remain in an uptrend. If price drops below the $62 support and the 50-day SMA we could see a move down to $56.
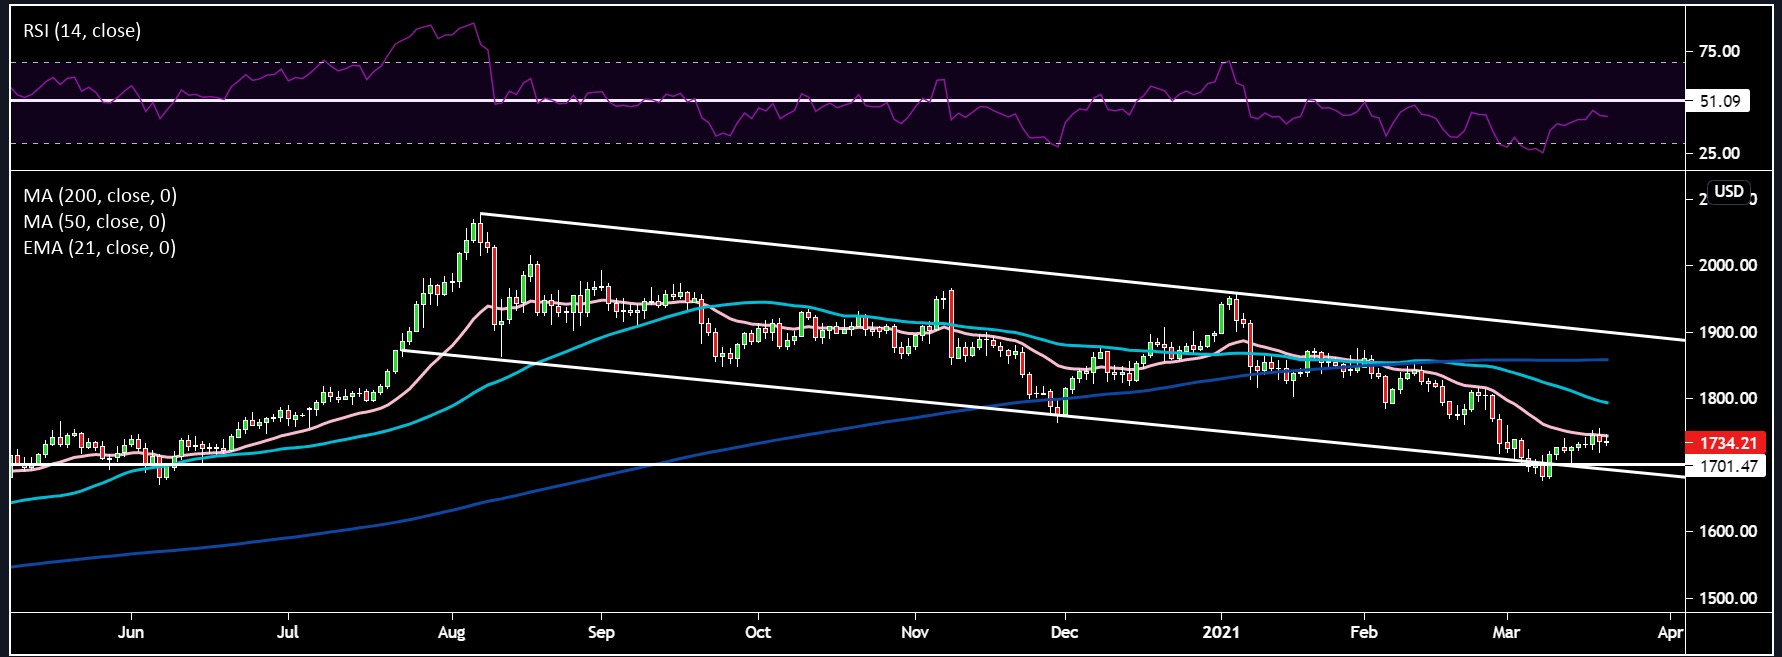
Gold:
Gold has surprised me of late, as price has held up well against increasing real yields and a stronger dollar. Maybe fears over runaway inflation and a fragile risk environment are helping the shiny yellow metal weather some headwinds. The medium and longer term trend seems to be a slow grind lower within the bounds of the ascending channel with sporadic rallies and pullbacks off the lower and upper trend channels. Price seems to be capped at the $1750 level which coincides with the 21-day EMA. The RSI is additionally struggling to overcome the 51 resistance, which has also held back previous rallies. The zone between the 21-day EMA and 50-day SMA could be an area to look at potential shorts. Price targets on the downside would be the $1700 support and the previous March low of $1675.
Related articles


Ready to trade?
It's quick and easy to get started. Apply in minutes with our simple application process.
The material provided here has not been prepared in accordance with legal requirements designed to promote the independence of investment research and as such is considered to be a marketing communication. Whilst it is not subject to any prohibition on dealing ahead of the dissemination of investment research we will not seek to take any advantage before providing it to our clients.
Pepperstone doesn’t represent that the material provided here is accurate, current or complete, and therefore shouldn’t be relied upon as such. The information, whether from a third party or not, isn’t to be considered as a recommendation; or an offer to buy or sell; or the solicitation of an offer to buy or sell any security, financial product or instrument; or to participate in any particular trading strategy. It does not take into account readers’ financial situation or investment objectives. We advise any readers of this content to seek their own advice. Without the approval of Pepperstone, reproduction or redistribution of this information isn’t permitted.