- English
- 中文版

US economic data remains relatively strong, stocks continue to hit record highs, and is importantly considered less exposed to the novel coronavirus (NCoV).
The ability of the US to ride out the headwinds is thanks to favourable economic conditions: liquidity, a strong labour market, and a low Federal Funds rate. Here are five charts that show the USD is the place to be.
USDX
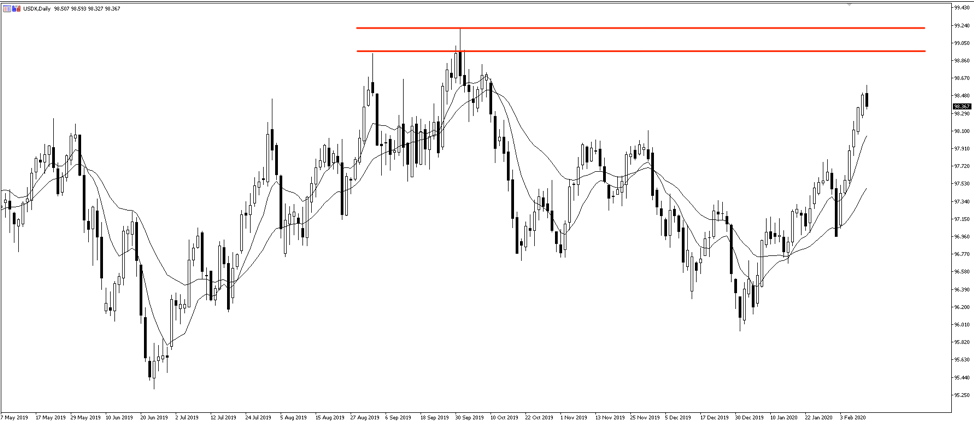
The US dollar is going from strength to strength so far in 2020, and a great way to see this is the US dollar index (USDX), up more than 2.5% since the 31 December low.
The USDX measures the value of the US dollar against a basket of currencies, comprised of EUR, GBP, JPY, CAD, SEK, and CHF. The euro holds a 57.6% weight in the basket. You can trade the USDX as a Currency index CFDs with Pepperstone.
The index is currently trading at 98.360 after a strong run of higher highs and higher lows, as the USD appreciates against the basket of currencies. Should the USDX continue to rise, we’ve got resistance at 98.93 and above that the October high at 99.203 (highest level since June 2017).
It will take considerable further weakness in basket currencies and the USDX higher. This could eventuate from increasing virus fallout in China, continued euro weakness, or US President Donald Trump polling higher ahead of the November election. Markets see Trump as a positive for US equities. His higher polling should boost stocks and raise dollar demand.
So let’s take a deeper dive and understand what’s pushing the USD higher.
Citi Surprise Index
The Citi Surprise index is a very clean read on USD performance. It measures the performance of the outcome of US data relative to expectations. A positive reading indicates data printed stronger than consensus expectations; a negative reading indicates data below expectations. As we can see US data is consistently beating expectations.
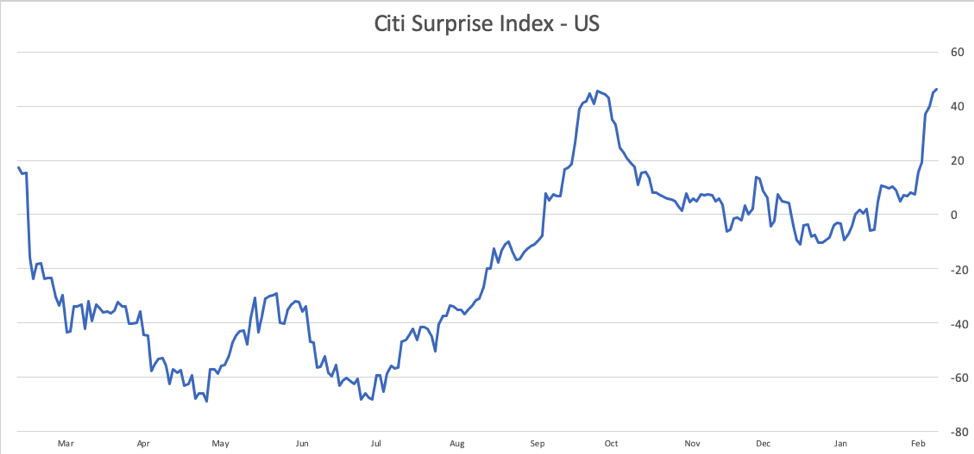
The new year has once again seen considerable US data outperformance and a strengthening dollar. This comes despite Europe struggling to meet data expectations and coronavirus panic spooking global growth prospects. The Phase One trade deal struck between Beijing and Washington early January surely provided a boost here: US companies now have a clearer understanding of the future and can make more confident investment decisions.
US500: Are US stocks a safe haven?
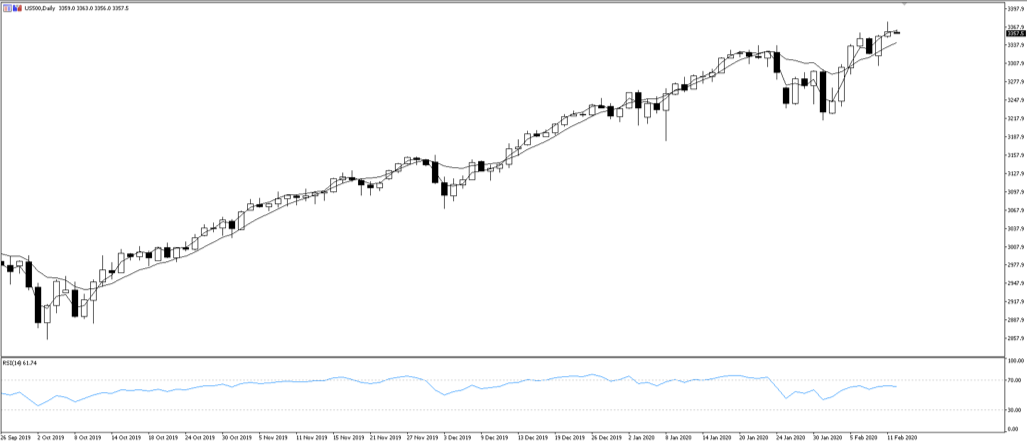
US stocks seem unstoppable, and the 2019 rally defied expectations. The S&P 500 posts a new record high every few days. Just look at that chart: price action flying from bottom left to top right.
The extraordinary growth in the share market has for sure been in part helped by the Federal Reserve. Low interest rates, balance sheet expansion, and injecting liquidity into the overnight repo markets have all played a part in the swelling asset prices. Although Fed Chair Powell insisted it was not a form of quantitative easing (QE), markets surely responded to the liquidity as if it were.
Add to this unemployment near a 50-year low and data printing above expectations, and you’re in a pretty good spot.
Beyond Fed policy, the US is relatively isolated from the Novel Coronavirus (NCoV) outbreak. Further, the US economy can rely better on itself amid global crisis than others can, and the US consumer continues to spend and champion the economy.
Perhaps it’s these favourable conditions that see the S&P 500 behaving like a safe haven. The global outlook is less certain once again, meanwhile US stocks go nowhere but up. As investors pile money into the US stock market, demand for - and value of - the US dollar increases.
US500 Q1 earnings
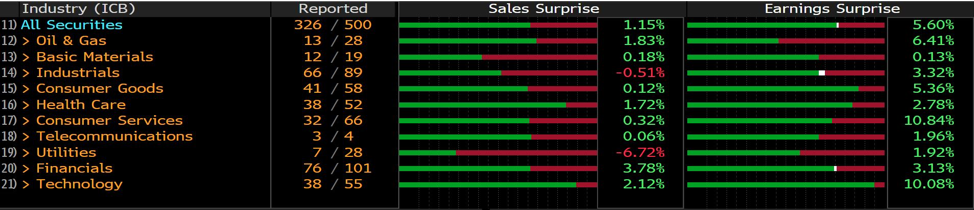
Source: Bloomberg
Q1 earnings for all S&P 500 industries have exceeded earnings expectations, offering a boost to the US stock market which had been underpricing Q1 earnings. Most industries are in the green: it’s a positive outlook for the rest of 2020.
Especially noteworthy is the technology companies, which saw earnings exceed expectations by an impressive 10%. Amazon joined the club of trillion dollar companies alongside Apple, Microsoft, and Alphabet.
Uncertainty will begin to linger as the Democratic nominations play out, and if markets begin to think they pose a threat to Trump’s incumbency. Moderal liberate candidates like Bloomberg, Klobuchar, and Biden offer familiar market policies. Buttigieg, Biden, and Sanders less so. Buttigieg proposes higher regulation for big tech companies, which have been major contributors to growth in the US500. Further left, Biden and Sanders have considered breaking up the big tech companies completely. The policies would combat the industry’s anti-competitiveness, but wreak havoc on share prices.
EURUSD
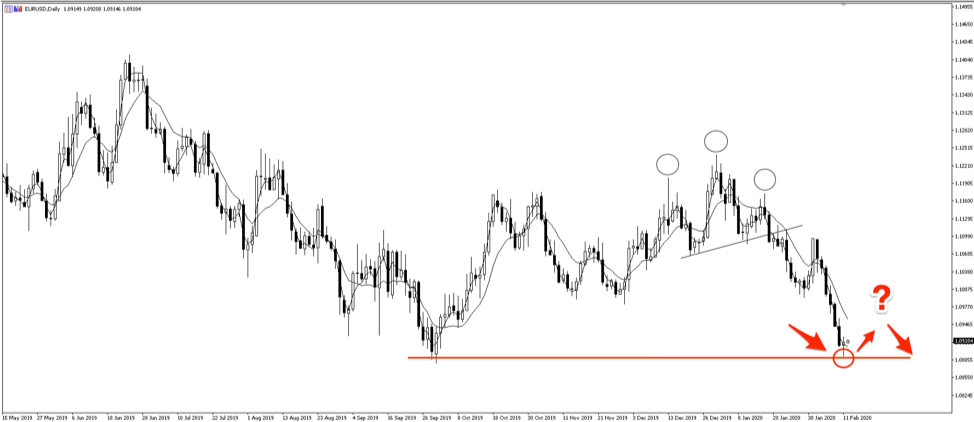
Here’s a tidy chart that shows US dollar strength and the threat its star status poses to weakening currencies.
The bulls rejected EURUSD resistance just below the 1.09000 handle, finding a small buying opportunity as expected. The downtrend held: Tuesday’s candle made another lower low and lower high despite closing higher on the day. This aligns with the fundamentals that the euro outlook remains to the downside as european data underperforms and US data impresses.
Should the forex pair break below October’s low 1.08791, we’ll be in price territory not seen since May 2017. The question is, what makes EURUSD break? More weak data from the eurozone, heightened NCoV panic, increased likelihood of Trump maintaining office, a continued uptrend in the Citi Surprise Index: all will push USD higher.
Ready to trade?
It's quick and easy to get started. Apply in minutes with our simple application process.
The material provided here has not been prepared in accordance with legal requirements designed to promote the independence of investment research and as such is considered to be a marketing communication. Whilst it is not subject to any prohibition on dealing ahead of the dissemination of investment research we will not seek to take any advantage before providing it to our clients.
Pepperstone doesn’t represent that the material provided here is accurate, current or complete, and therefore shouldn’t be relied upon as such. The information, whether from a third party or not, isn’t to be considered as a recommendation; or an offer to buy or sell; or the solicitation of an offer to buy or sell any security, financial product or instrument; or to participate in any particular trading strategy. It does not take into account readers’ financial situation or investment objectives. We advise any readers of this content to seek their own advice. Without the approval of Pepperstone, reproduction or redistribution of this information isn’t permitted.