- English
- 中文版
Analysis

JPN225 – the hottest ticket in town
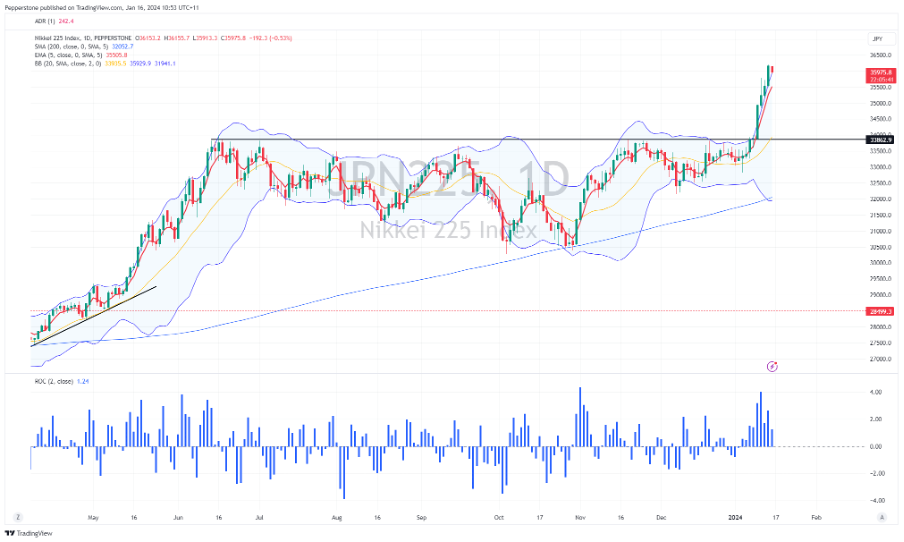
The JPN225 continues to garner much attention from clients given the sharp rally we’ve seen since 10 Jan, with the index pushing above 36k. Fast money players have chased the index higher, largely spurred on by weaker economic data that gives the BoJ few reasons to move away from its ultra-easy policy stance. There is a mean reversion trade between Japan and US equities, where the JPN225 underperformed (in both JPY and USDs) from June to October, and US funds have switched to long JPN225 seeing the relative underperformance as having gone too far. Tactically the question is whether to take out short exposures here for a quick move lower or to stay out and look to buy weakness should it eventuate. It is hard to initiate longs at these levels as the move is clearly stretched but we live in interesting times, and we need to be open-minded to flows that cause another leg higher.
EURCHF – ECB pushback offers EUR upside
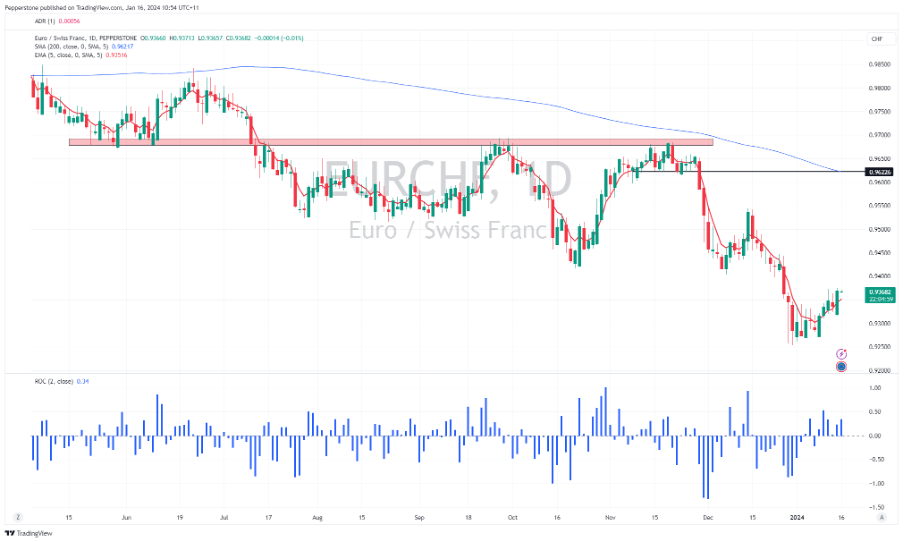
The EUR is finding some form of late with solid moves vs SEK, JPY, AUD, CHF, and CAD. One driver for EUR appreciation has been the pushback from a coordinated group of ECB officials not comfortable with the extent of rate cuts priced into EU swaps throughout 2024. The rates market hasn’t radically repriced on the ECB pushback, however, and we still see April as the consensus date in market pricing for the ECB to cut. That said, we are seeing EU govt bonds underperform on a relative basis and therefore relative yield spreads are tightening up in favour of EUR upside. While we also consider the workings of the SNB FX reserve policy, we see the CHF as one of the weaker currencies over the past 5 days and taking a momentum approach marrying the strong (EUR) and the weak (CHF) often pays. Having built a base into 0.9270, we see price having printed a bullish outside day - longs will want price to see follow-through buying above 0.9375, which opens up a move into 0.9400/03 and even 0.9511. While we get more ECB speakers through the week, in the session ahead (20:00 AEDT) we get the ECB’s 1- and 3-year CPI expectations and that could be a modest risk for EUR exposures.
GBPAUD – a lot of green on screen
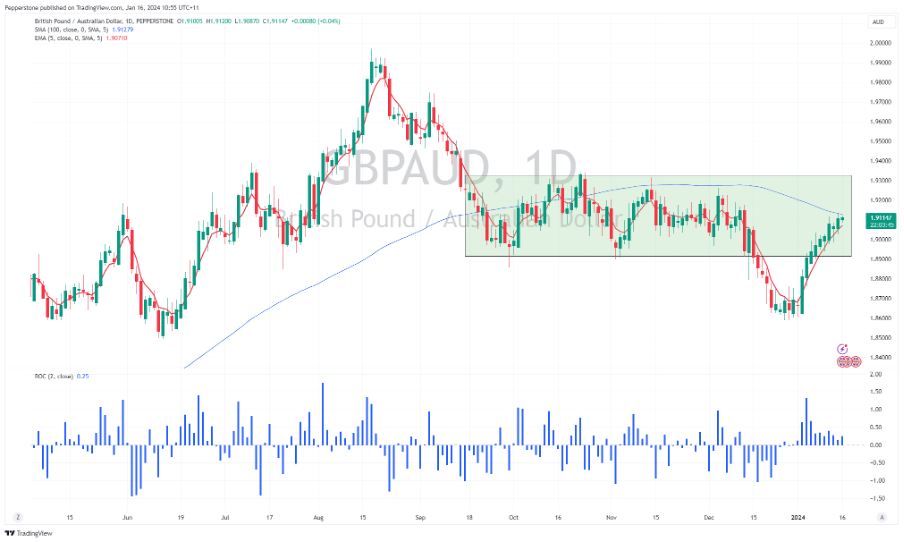
GBP has started the year in good form and is the best performing G10 currency so far this year. GBPJPY has been the big percentage mover and has been well traded across a range of accounts, with the JPY frustrating many who were expecting the BoJ to start a normalizing process. GBPAUD also captures attention given we’ve seen the cross close higher in 9 of the past 11 sessions and has moved back to the congestion zone seen between October and December. The 100-day MA is currently capping rallies, but a break here and I’d be looking for a move into the top of that prior range around 1.9300. UK employment and wages (due at 18:00 AEDT) pose a risk to GBP exposures in the session ahead, with expectations for a 6.8% print (from 7.3%) on weekly earnings. This comes ahead of the UK CPI print tomorrow (also at 18:00 AEDT), where the market looks for core CPI to come in at 6.1% (from 6.3%). Both data sets will feed into BoE rate expectations, where the market prices the first 25bp cut in May and 5 cuts by Dec 2024 - consider we also hear from BoE gov Bailey in the session ahead and we look for signs of pushback on UK rate pricing.
XAUUSD – eyes on Fed gov Waller
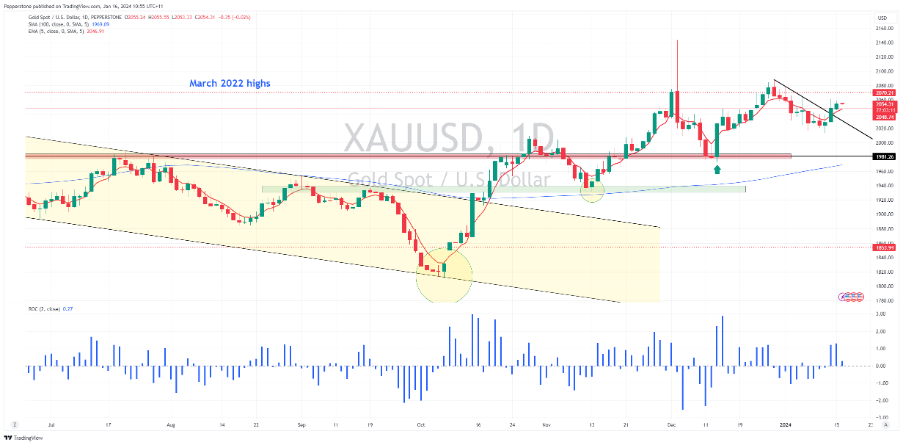
With cash bonds closed for MLK day the gold and FX markets have lacked direction, but that changes in the session ahead with St Louis Fed gov Waller speaking on the US economic outlook and monetary policy (03:00 AEDT). Recall, Waller was responsible for setting up the rally in US equity, where on 28 Nov he gave a defined path by which the Fed could ease the fed funds rate, should inflation move as intended. We know Waller looks at the 6-month annualized inflation rate, and with US core CPI running at 3.2% and core PCE inflation running around 2%, Waller should maintain a view that the Fed could ease if this trend persists. The risk for gold and NAS100 longs/USD shorts is that he pushes back on market pricing for a March cut and shows a lack of urgency to normalize policy. There may also be expectations he touches further on a timeline to taper its Quantitative Tightening (QT) program. That said, should he even remotely validate market pricing, then we should see US 2-year bond yields fall further, the USD should move lower, and gold may push back to the 28 Dec high of $2088. Certainly, the set-up is looking more constructive for gold longs, with the break of the downtrend and momentum studies turning bullish.
NAS100 – which way does it break?
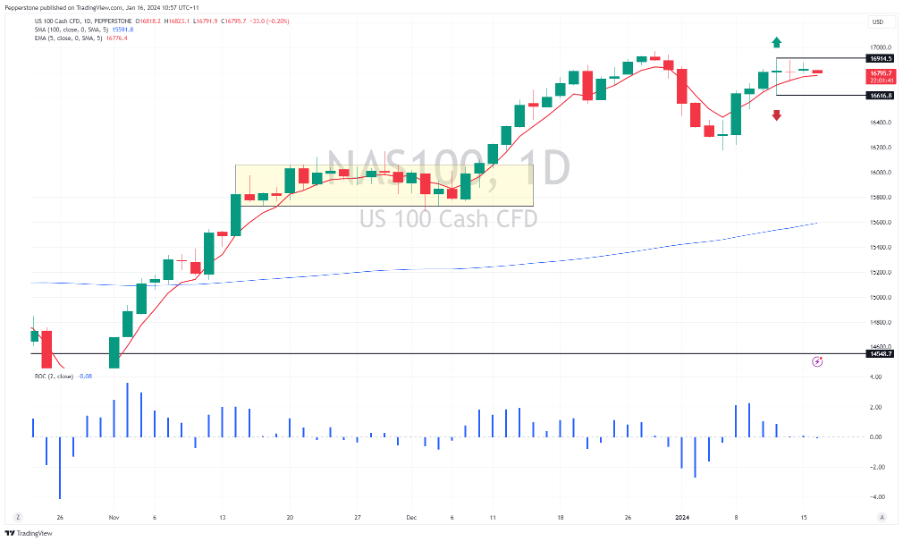
As we look ahead to Fed gov Waller’s speech on policy and economics we also see VIX, equity index and single stock options expiration throughout the week. The resulting flows that come from OPEX could see high volatility in the US equity markets and notably once a lot of the gamma has been cleared from the market, the market will be free to move around without such dealer hedging flows. Near-term on the daily timeframe we see two consecutives inside bars – this suggests trading a breakout and going with a subsequent move through 16909 and 16612. Which way does it break? Obviously, no one knows, and while I see higher risks it breaks to the upside, reacting to the break is key - so I am waiting for the market to reveal itself and trade the flow.
Related articles

The material provided here has not been prepared in accordance with legal requirements designed to promote the independence of investment research and as such is considered to be a marketing communication. Whilst it is not subject to any prohibition on dealing ahead of the dissemination of investment research we will not seek to take any advantage before providing it to our clients.
Pepperstone doesn’t represent that the material provided here is accurate, current or complete, and therefore shouldn’t be relied upon as such. The information, whether from a third party or not, isn’t to be considered as a recommendation; or an offer to buy or sell; or the solicitation of an offer to buy or sell any security, financial product or instrument; or to participate in any particular trading strategy. It does not take into account readers’ financial situation or investment objectives. We advise any readers of this content to seek their own advice. Without the approval of Pepperstone, reproduction or redistribution of this information isn’t permitted.