How to trade EUR/USD

How to trade EUR/USD: Influential factors and essential strategies
The EUR/USD is highly attractive to all types of traders for several reasons:
Most Liquid Currency Pair
- Liquidity: EUR/USD is the most liquid currency pair in the world. It accounts for a large portion of the global margin FX market's average $6 trillion daily trading volume. This high liquidity means there’s an almost constant flow of buyers and sellers, making it easier to execute trades quickly and at stable prices.
- Tight Spreads: Because of its significant liquidity, EUR/USD typically has the lowest spreads (the difference between the bid and ask price) among currency pairs. Low transaction costs appeal to both retail and institutional traders, allowing for efficient trading, especially for short-term or high-frequency trading strategies.
Diverse Trading Strategies
- Suitability for All Timeframes: Because of its high liquidity and frequent price movement, EUR/USD is suitable for a wide range of trading strategies, from scalping and day trading to swing trading and long-term trend following. Traders can use technical, fundamental, or sentiment analysis to trade the pair, depending on their preferred style.
- Reliable Trends and Technical Patterns: EUR/USD often follows recognisable trends and technical patterns, making it a popular choice for technical traders. The pair’s large trading volume can make chart patterns and technical indicators (like moving averages and RSI) particularly effective.
Lower Risk of Extreme Spikes
- Stability: Compared to some exotic or emerging-market currencies, EUR/USD tends to have more stable price movements without extreme, unexpected spikes. This can make it less risky for traders looking for more predictable market behaviour.
Correlation with Other Markets
- Relation to Equities and Commodity CFD: EUR/USD often correlates with other asset classes, such as U.S. equities and commodity CFDs like gold. For instance, a strong U.S. dollar typically corresponds with weaker commodity CFD prices, and traders can use these relationships to refine their trading strategies.
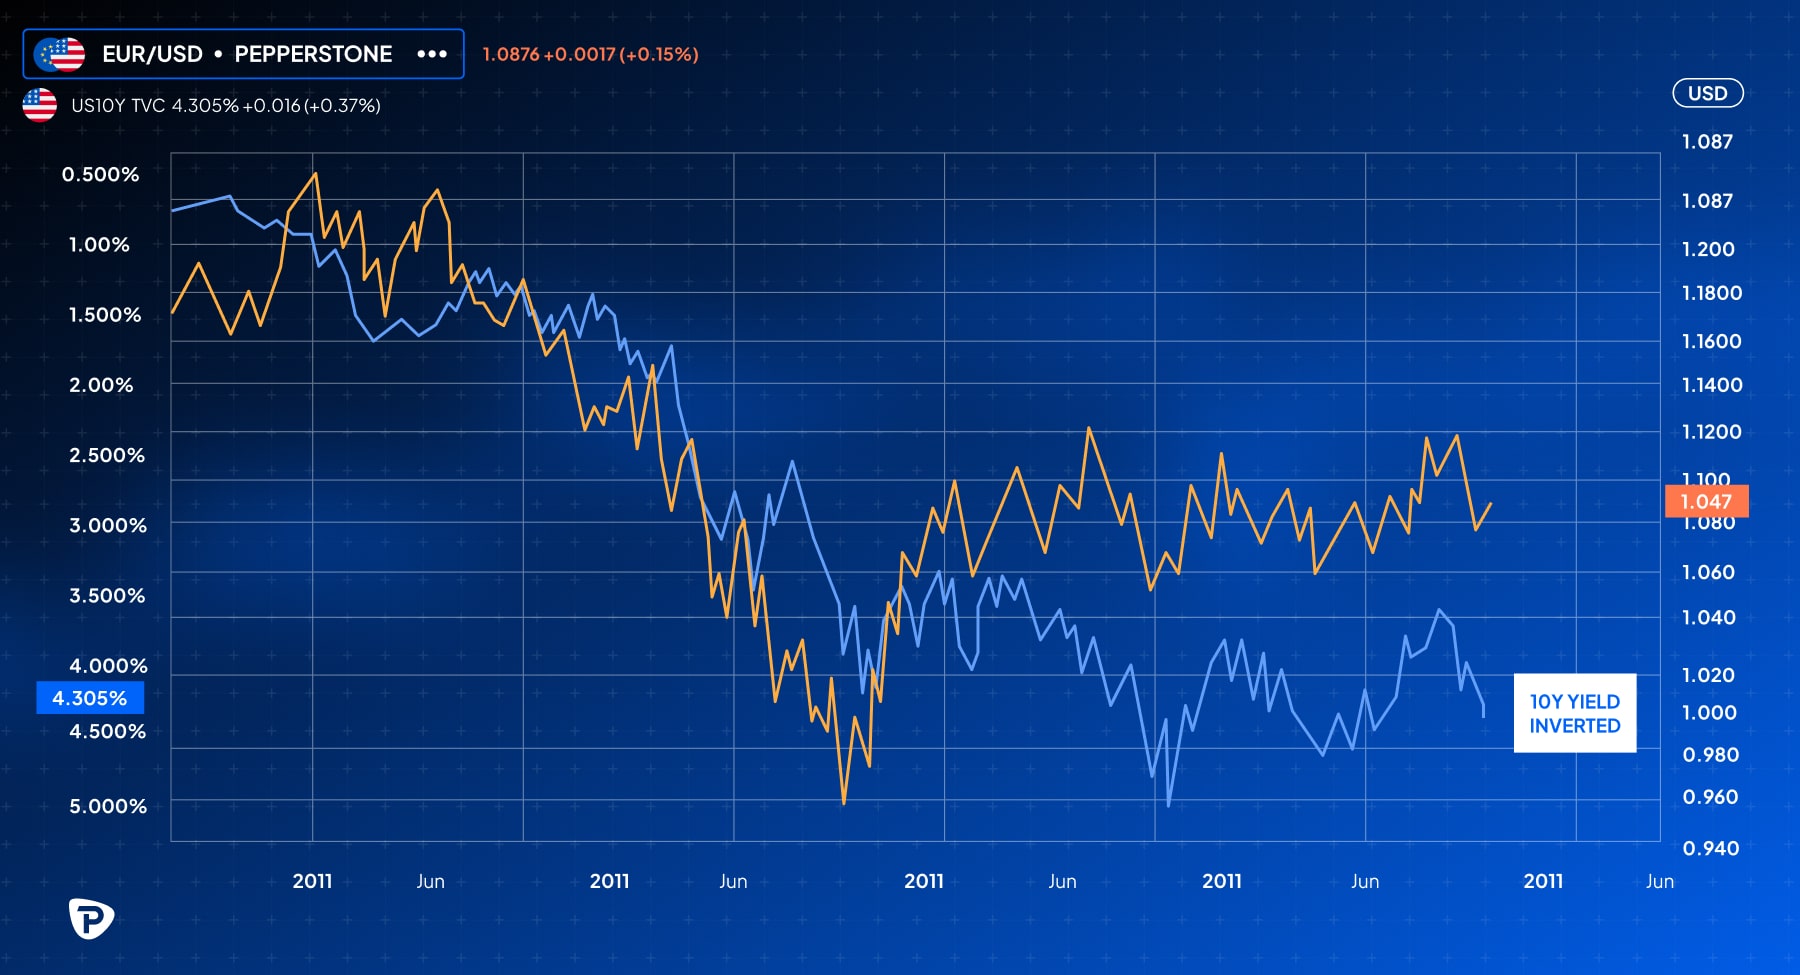
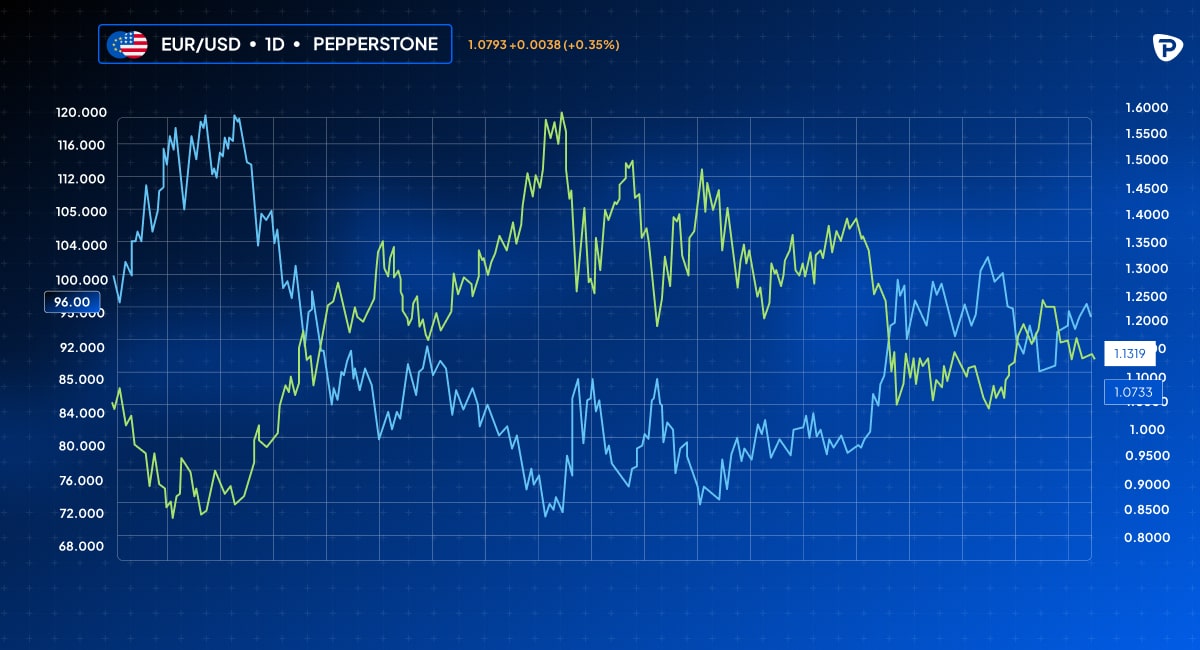
- Impact of Treasury Yields: The pair also correlates with U.S. Treasury yields (see chart below). Rising yields in the U.S. often strengthen the dollar, affecting EUR/USD directly, as investors shift into higher-yielding dollar-denominated assets.
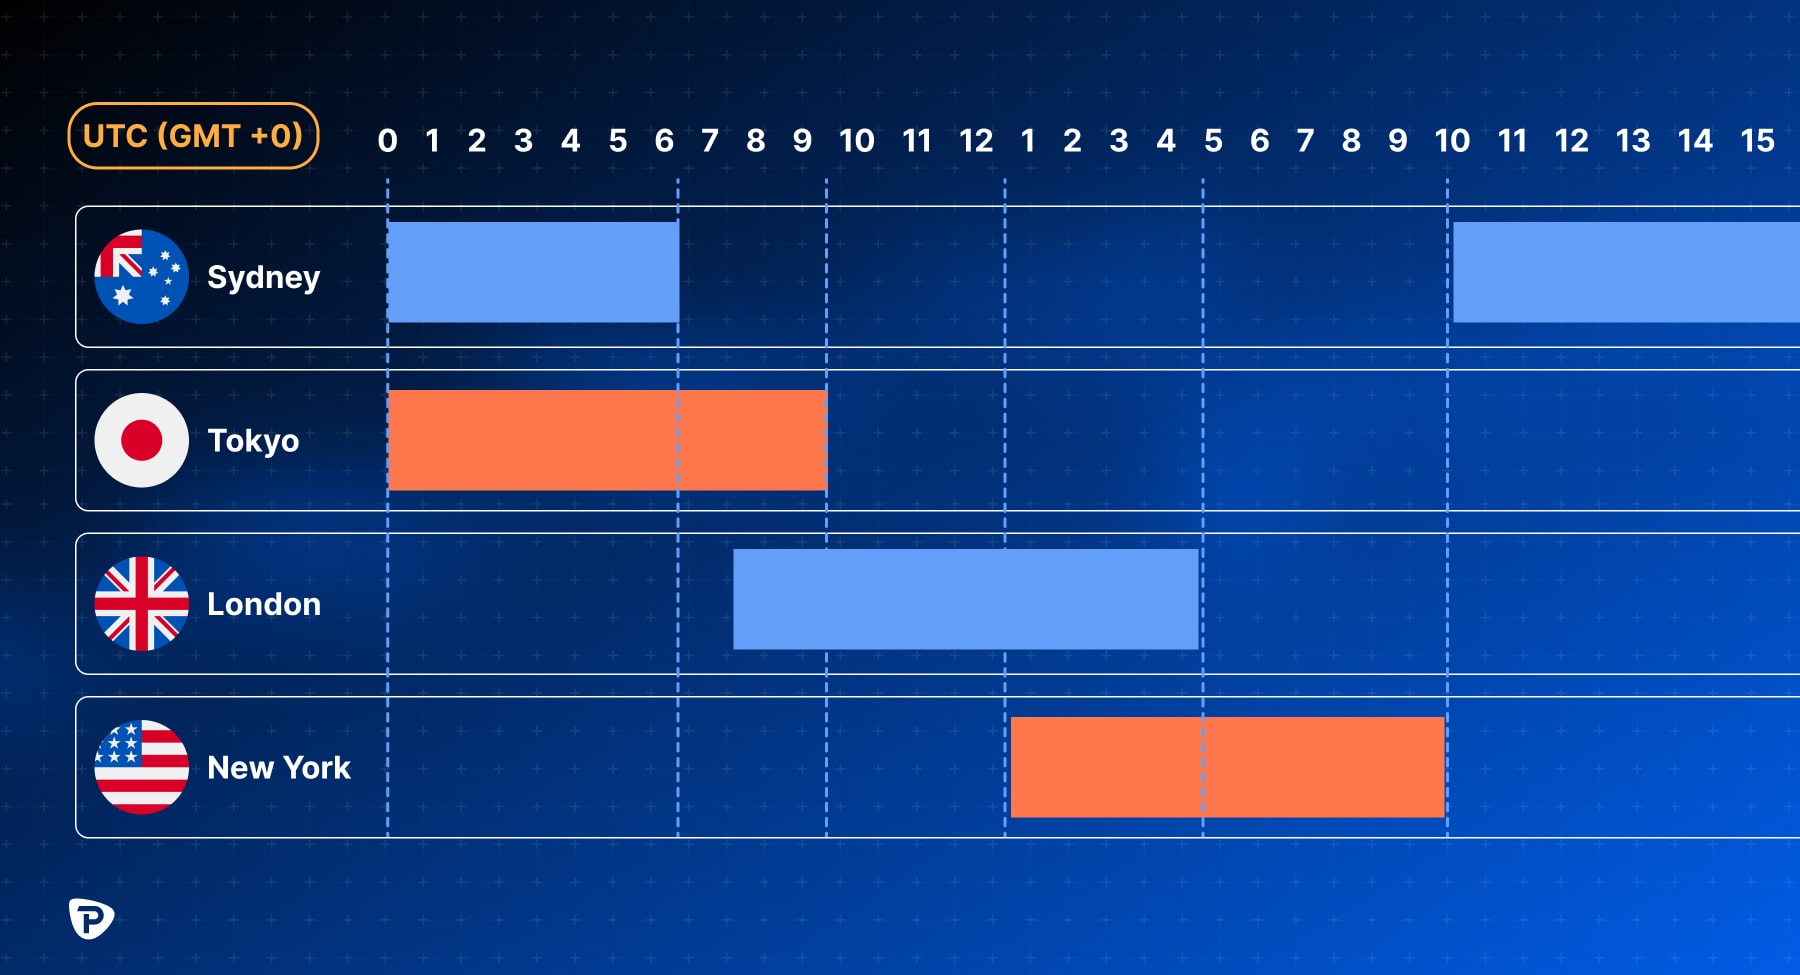
Best Time to Trade EUR/USD
The best time to trade EUR/USD is during the overlap of the European and U.S. trading sessions, specifically from 12:00 to 16:00 UTC. During this period, market liquidity and volatility are at their highest, which benefits day traders and those seeking quick trades.
Analysing EUR/USD trends
Analysing EUR/USD trends involves a combination of technical, fundamental, and sentiment analysis to understand price direction and predict potential movements. Here’s how to approach each method:
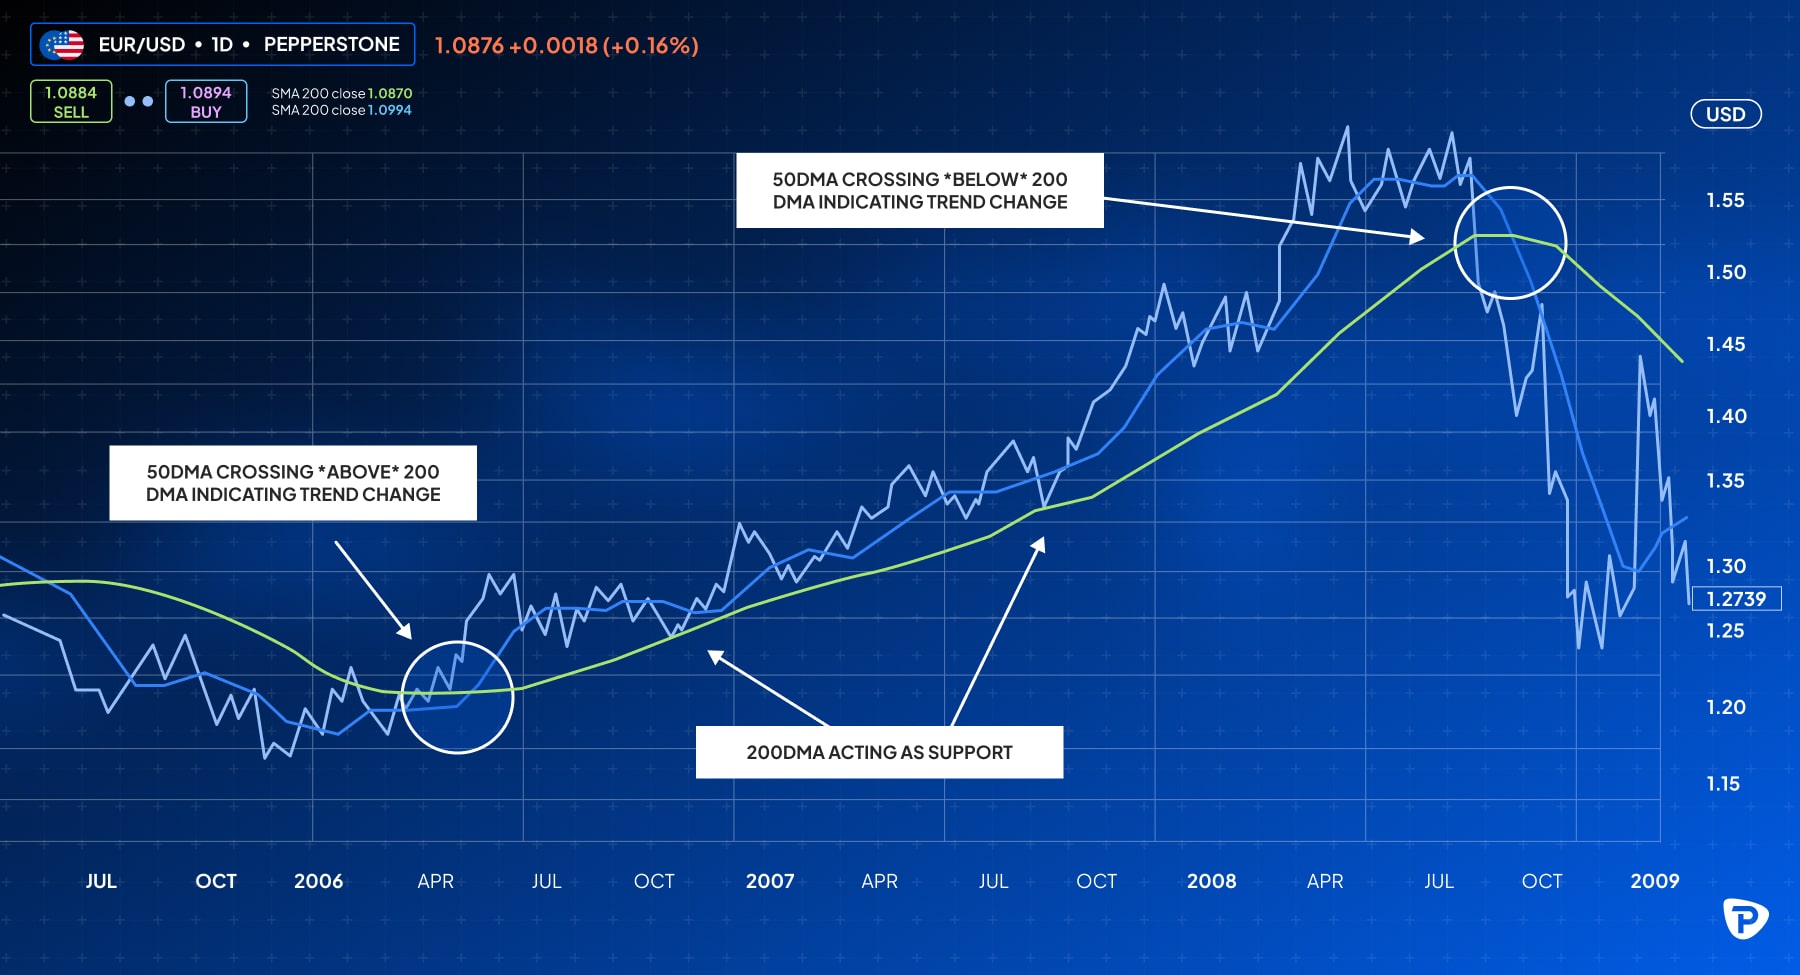
Technical Analysis
- Moving Averages: Simple or exponential moving averages (e.g., 50- and 200-day) can help identify long-term trends. If the shorter-term average crosses above the longer-term average, it often signals an uptrend, and vice versa for downtrends.
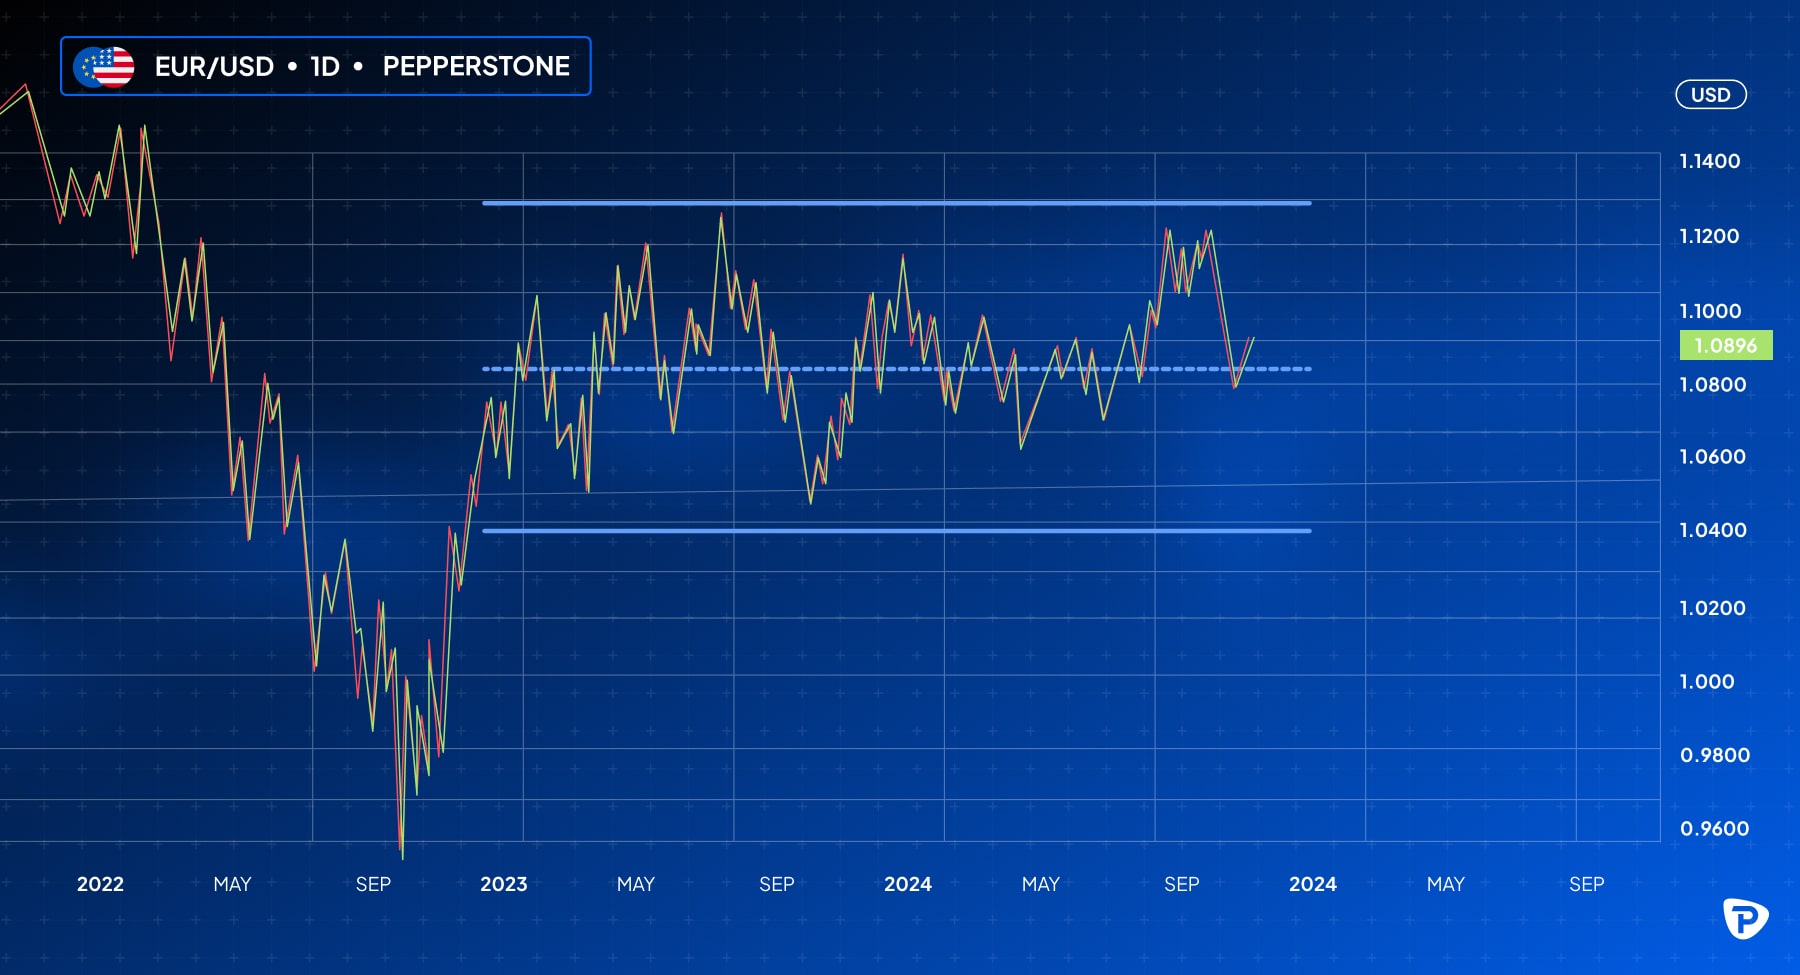
- Trend Lines and Channels: Drawing trend lines between highs and lows helps visualise support and resistance levels (see below). Channels can indicate range-bound movement or a strong directional trend.
- Indicators: Use tools like Relative Strength Index (RSI) to spot overbought or oversold conditions, or Moving Average Convergence Divergence (MACD) for momentum signals.
Fundamental Analysis
- Central Bank Policies: The Federal Reserve and ECB interest rate decisions and policy statements heavily influence EUR/USD. Hawkish (rate-hiking) policies can strengthen the currency, while dovish (rate-cutting) stances may weaken it.
- Economic Indicators: Focus on key data such as U.S. and Eurozone GDP growth, employment figures, and inflation reports. For example, strong U.S. GDP may boost USD strength and drive EUR/USD lower (see Key Economic Indicators below).
- Political Events: Geopolitical developments, such as trade agreements or conflicts, often impact EUR/USD sentiment and trend direction.
Sentiment Analysis
- COT Reports: The Commitment of Traders (COT) report shows institutional trading positions, which can reveal market sentiment toward EUR/USD. The CFTC (Commodity Futures Trading Commission) commitments of traders' data is published weekly on a Friday and contains an aggregated report of the different holdings of market participants in the US futures market. Look at the net positions (long vs. short) of different trader categories. A high level of long positions among large speculators could indicate bullish sentiment, while a high level of shorts could suggest bearish sentiment.
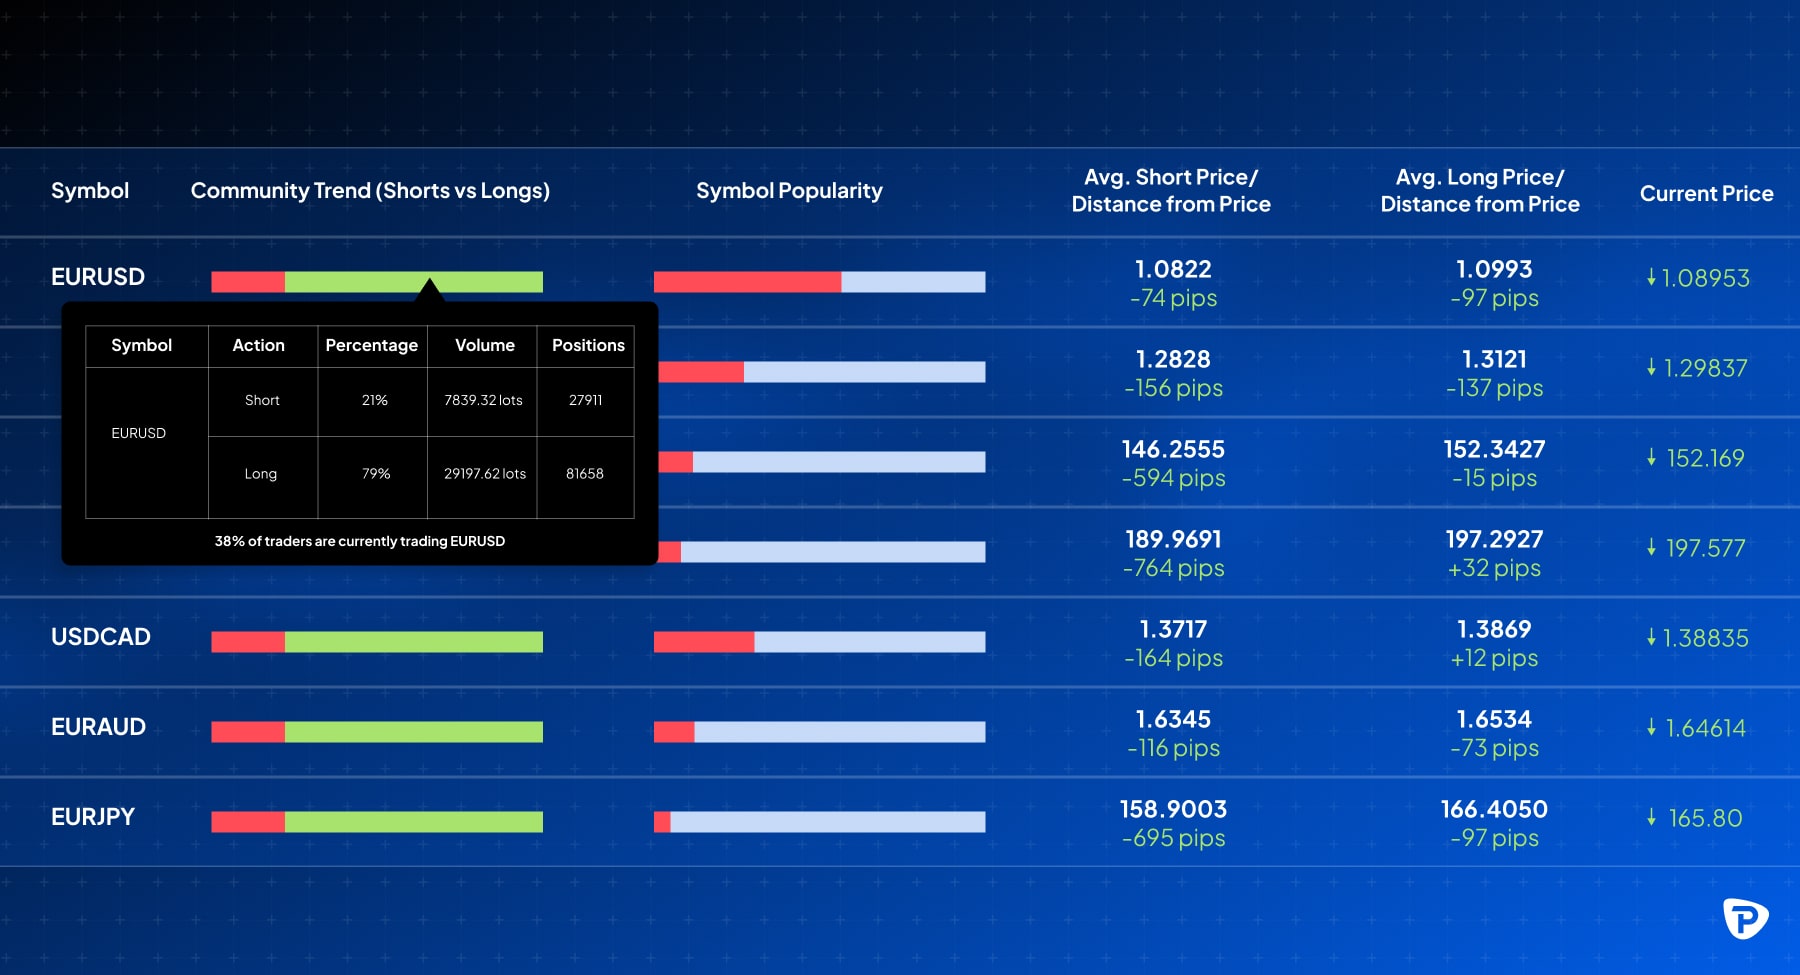
- Market Sentiment Tools: Many brokers and platforms offer sentiment indicators (see below) that show the percentage of retail traders in long versus short positions. For example, if a large majority of retail traders are short on a currency pair, it might indicate bearish sentiment, and vice versa.
Combining these methods provides a fuller picture of EUR/USD trends and enhances trading decisions by balancing price patterns, economic insights, and market sentiment.
Which trading strategies work best for EUR/USD?
Each of the following strategies could be effective, depending on market conditions and personal trading preferences:
Breakout Strategy
- Overview: A breakout strategy aims to take advantage of strong price movements following the release of key economic data or significant news, such as ECB or Fed rate announcements.
- How It Works: Traders identify support and resistance levels. When the price breaks through these levels with high volume, it often signals a strong directional move.
- Best for: High-volatility periods, particularly around economic data releases or central bank events.
Trend-Following Strategy
- Overview: The EUR/USD offers clear trends, especially during times of economic divergence between the Eurozone and the U.S.
- How It Works: Traders identify the direction of the trend using moving averages or indicators like the MACD. They enter trades in the trend’s direction, buying in an uptrend or selling in a downtrend.
- Best for: Extended periods of economic alignment or divergence between the ECB and Fed policies.
Range Trading
- Overview: During periods of economic stability, EUR/USD often consolidates within well-defined ranges, bouncing between support and resistance.
- How It Works: Traders look for overbought or oversold conditions near support and resistance levels. They buy near support and sell near resistance.
- Best for: Low-volatility periods when EUR/USD lacks a clear trend.
News Trading
- Overview: Economic data releases and central bank announcements frequently cause immediate movements in EUR/USD.
- How It Works: Traders monitor an economic calendar and take positions just before or after major releases, such as Non-Farm Payrolls, ECB speeches, or inflation reports.
- Best for: Experienced traders comfortable with high-volatility trading around events.
Scalping
- Overview: Scalping involves making multiple small trades over a short period, capturing tiny price movements.
- How It Works: Traders enter and exit trades quickly, usually within minutes. High liquidity and tight spreads in EUR/USD make it ideal for scalping.
- Best for: Traders with the time and discipline for short-term, fast-paced trading.
Mean Reversion Strategy
- Overview: Based on the idea that prices tend to revert to their mean or average level after deviating significantly.
- How It Works: Traders use indicators like Bollinger Bands or the Relative Strength Index (RSI) to spot overbought or oversold conditions. When EUR/USD moves too far from its average, traders anticipate a reversal.
- Best for: Periods with no strong directional trend.
How much leverage should I use when trading EUR/USD?
When trading EUR/USD, the amount of leverage should depend on regulatory limits, trading strategy, risk tolerance, and personal circumstances. A conservative approach often leads to more sustainable trading practices, especially in a volatile market like margin FX.
Always be aware of broker margin requirements and the risks of a margin call.
Key Economic Indicators for EUR/USD
By following these indicators and understanding their impacts, traders can better anticipate EUR/USD movement in response to economic shifts in both regions:
- Interest Rate Decisions (ECB and Federal Reserve): The ECB and Fed set benchmark interest rates. If the ECB raises rates while the Fed holds steady, the euro might strengthen against the dollar, pushing EUR/USD up, and vice versa.
- GDP Reports: Quarterly GDP data reveals the economic growth of both regions. For example, if U.S. GDP growth outpaces that of the Eurozone, it may strengthen the USD against the EUR, leading to a lower EUR/USD. While GDP figures in the U.S. and EU are often subject to subsequent revisions, these initial releases can have an immediate impact on trading EUR/USD, as market participants react to the first impressions of economic growth.
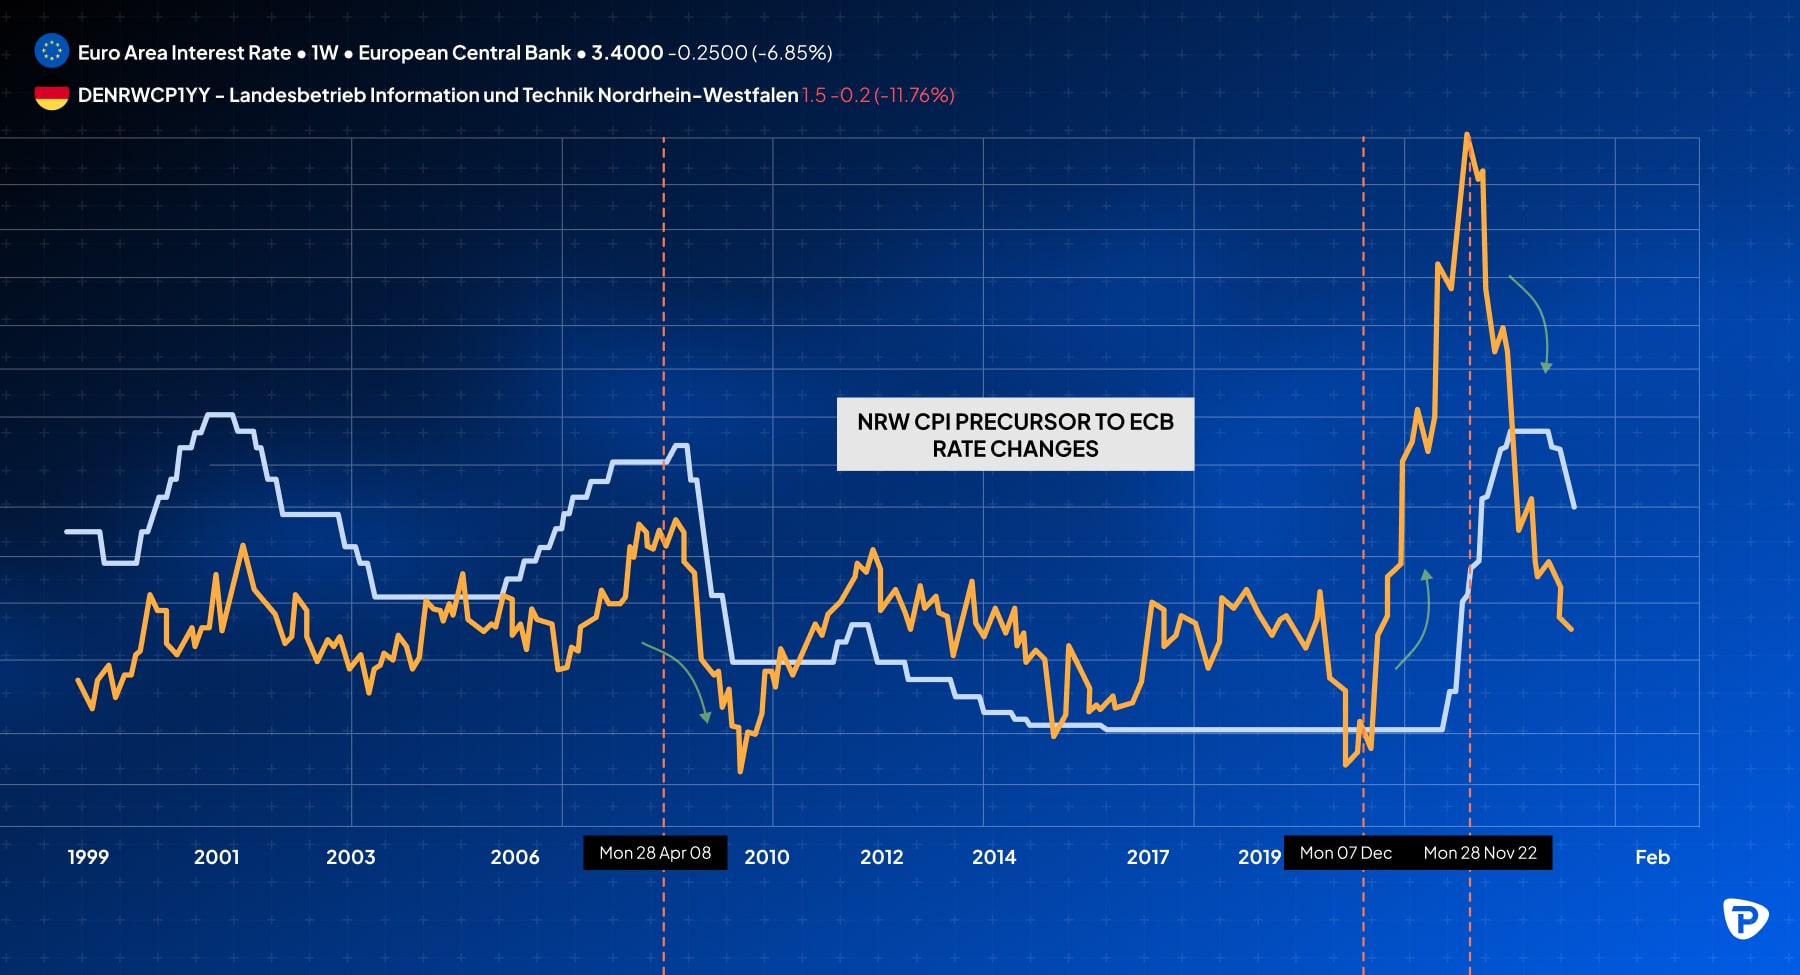
- Inflation Data: High inflation often prompts rate hikes to stabilise prices, which may boost a currency’s appeal. The Fed specifically monitors the Personal Consumption Expenditures Price Index (PCE), which is a measure of inflation that reflects changes in the price of goods and services consumed by individuals. For the Eurozone the North Rhine-Westphalia (NRW) CPI reading often serves as a precursor to Germany's main CPI reading. NRW is Germany's most populous state and typically releases its inflation data before the national figure, giving traders an early indication of the overall trend in German inflation for that month. This regional data can provide valuable insights into the direction of the national CPI, which is also closely monitored by the ECB as an inflation gauge for the broader Eurozone.
- Employment Data: The U.S. Nonfarm Payrolls (NFP) report, released monthly, is one of the most impactful indicators. Strong job growth typically signals economic resilience, often leading to USD strength. In the Eurozone, unemployment data, particularly from Germany as a proxy for the region, offers insights into labour market health and its potential impact on ECB policies.
- Trade Balance: Trade balance figures reflect the net difference between exports and imports. A large trade surplus in the Eurozone (or a deficit in the U.S.) can push EUR/USD higher, as increased demand for European exports supports the euro.
- Economic Sentiment Surveys - ZEW Economic Sentiment (Germany): Measures investor confidence in Germany’s economy, which is influential for the Eurozone. Positive sentiment can strengthen the euro. U.S. Consumer Confidence Index (CCI): Gauges U.S. consumer outlook, which can affect the dollar. High confidence generally supports the dollar, while low confidence can weaken it.
Impact of Interest Rate Changes on EUR/USD
Interest rate changes are a critical driver of the EUR/USD exchange rate. They affect capital flows, inflation expectations, economic growth perceptions, and overall market sentiment. By understanding how interest rate movements influence currency values, traders can better position themselves to capitalise on potential shifts in EUR/USD. Monitoring central bank decisions and economic indicators is essential for anticipating changes in interest rates and their impact on the currency market:
Attraction of Foreign Capital
- Higher Interest Rates: If ECB or the Fed raises interest rates, it typically makes that currency more attractive to investors seeking higher returns on investments. For example, a rate hike by the Fed may lead to increased demand for the USD, causing the EUR/USD pair to decline.
- Lower Interest Rates: Conversely, when rates are lowered, the associated currency may become less attractive, leading to capital outflows. This can result in a weaker currency. If the ECB lowers rates while the Fed maintains higher rates, it could lead to a stronger USD relative to the EUR.
Inflation Expectations
- Rate Hikes: Central banks often raise interest rates to combat rising inflation. Higher rates can signal a commitment to maintaining price stability, enhancing the currency's strength. If the market perceives that the ECB is more focused on fighting inflation compared to the Fed,
- Rate Cuts: Conversely, if rates are cut to stimulate the economy, this can lead to concerns about future inflation and currency depreciation. If the Fed cuts rates while the ECB maintains rates, the USD may weaken against the EUR.
Central Bank Guidance and Forward Guidance
- Communication from Central Banks: Statements and forecasts from the ECB and Fed regarding future interest rate paths can significantly influence the EUR/USD exchange rate. Clear signals of intended rate changes can lead to pre-emptive movements in the currency pair.
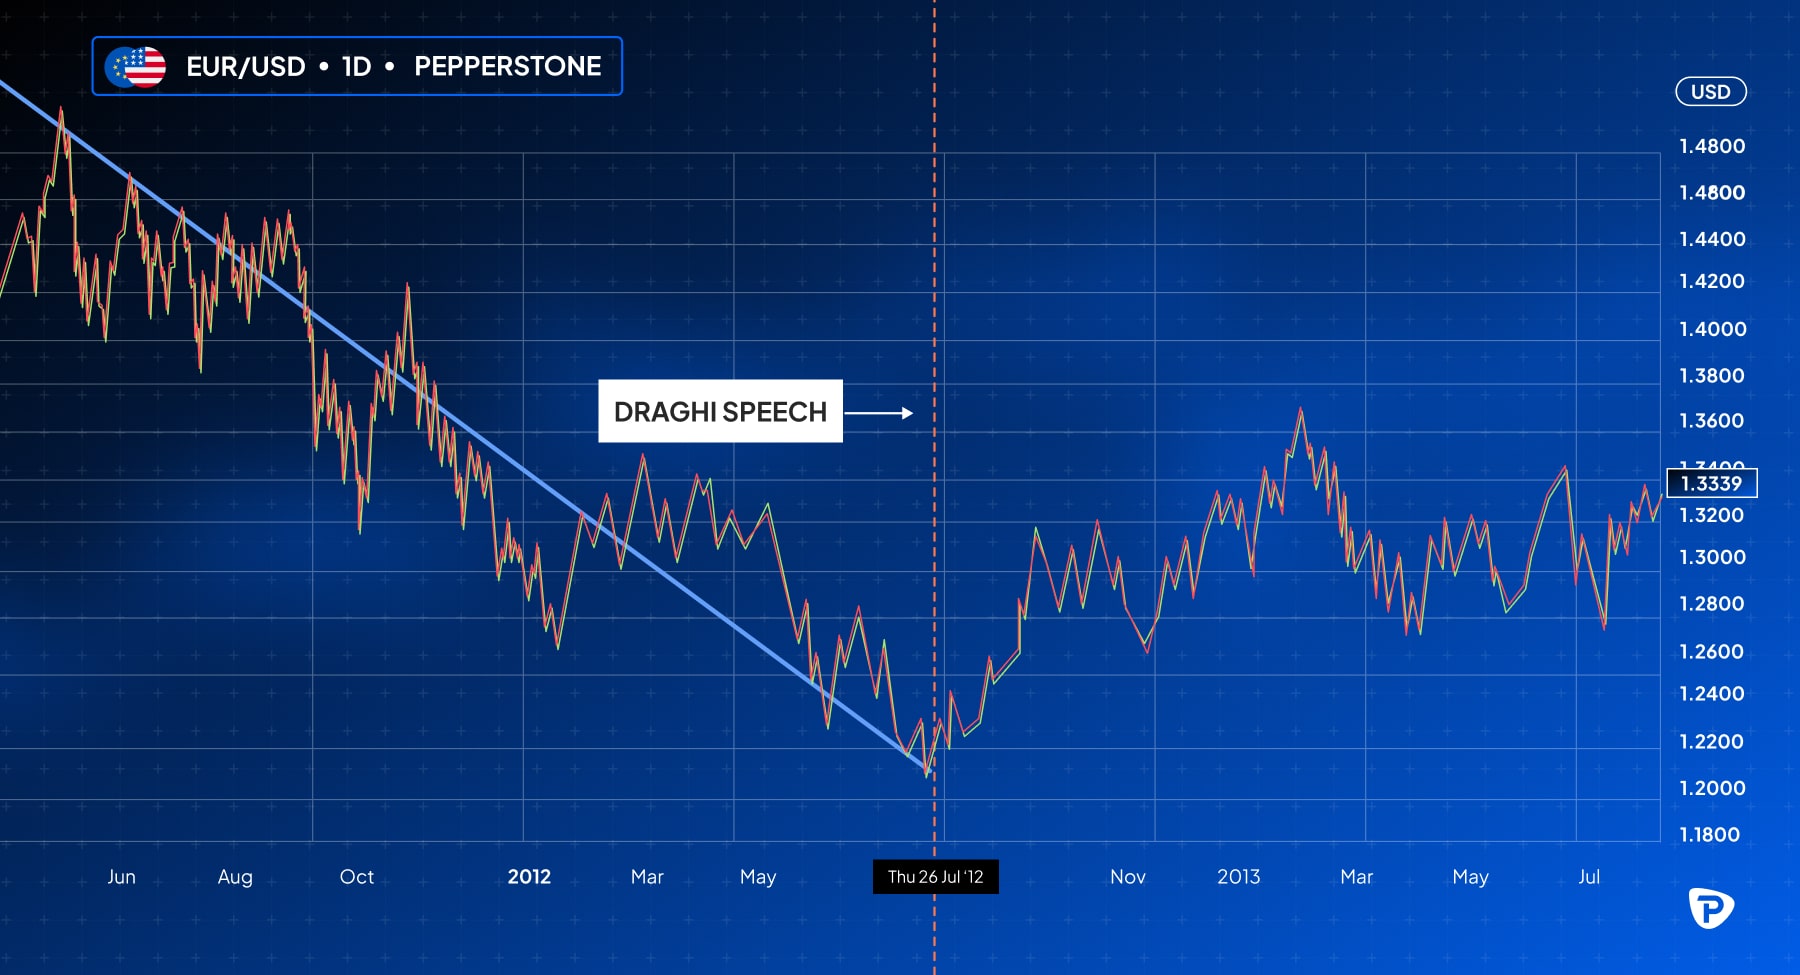
- Forward Guidance: A notable example of ECB communication affecting the EUR/USD occurred on July 26, 2012, when then-President Mario Draghi stated the ECB was "ready to do whatever it takes to preserve the Euro." This reassured markets during the Eurozone's sovereign debt crisis, alleviating fears of defaults by countries like Greece and Spain. Following his speech, the EUR/USD reversed its downward trend, rising from around 1.21 to nearly 1.27 within a month (chart below). Draghi’s strong message had a significant psychological impact, boosting investor confidence and demand for the euro while stabilising the Eurozone economy.
Managing Risk When Trading EUR/USD
Managing risk when trading EUR/USD is essential for protecting capital and achieving consistent profitability. Employing multiple strategies, such as combining stop-loss orders, position sizing, and diversification, enhances risk management by providing layered protection against market volatility and unexpected price movements:
Set Stop-Loss Orders
- Why: Stop-loss orders limit potential losses by automatically closing a trade when it reaches a predetermined level. This helps protect against unexpected market movements and emotional decision-making. They do not guarantee the exact closing price, as slippage can occur, particularly in volatile market conditions.
- How: Place stop-loss orders based on technical levels, such as support or resistance, or by setting a maximum percentage of your account balance that you’re willing to risk (e.g., 1-2% per trade).
Use Proper Position Sizing
- Why: Position sizing determines the amount of capital allocated per trade, which directly impacts risk. By controlling position size, exposure can be managed and over-leveraging avoided.
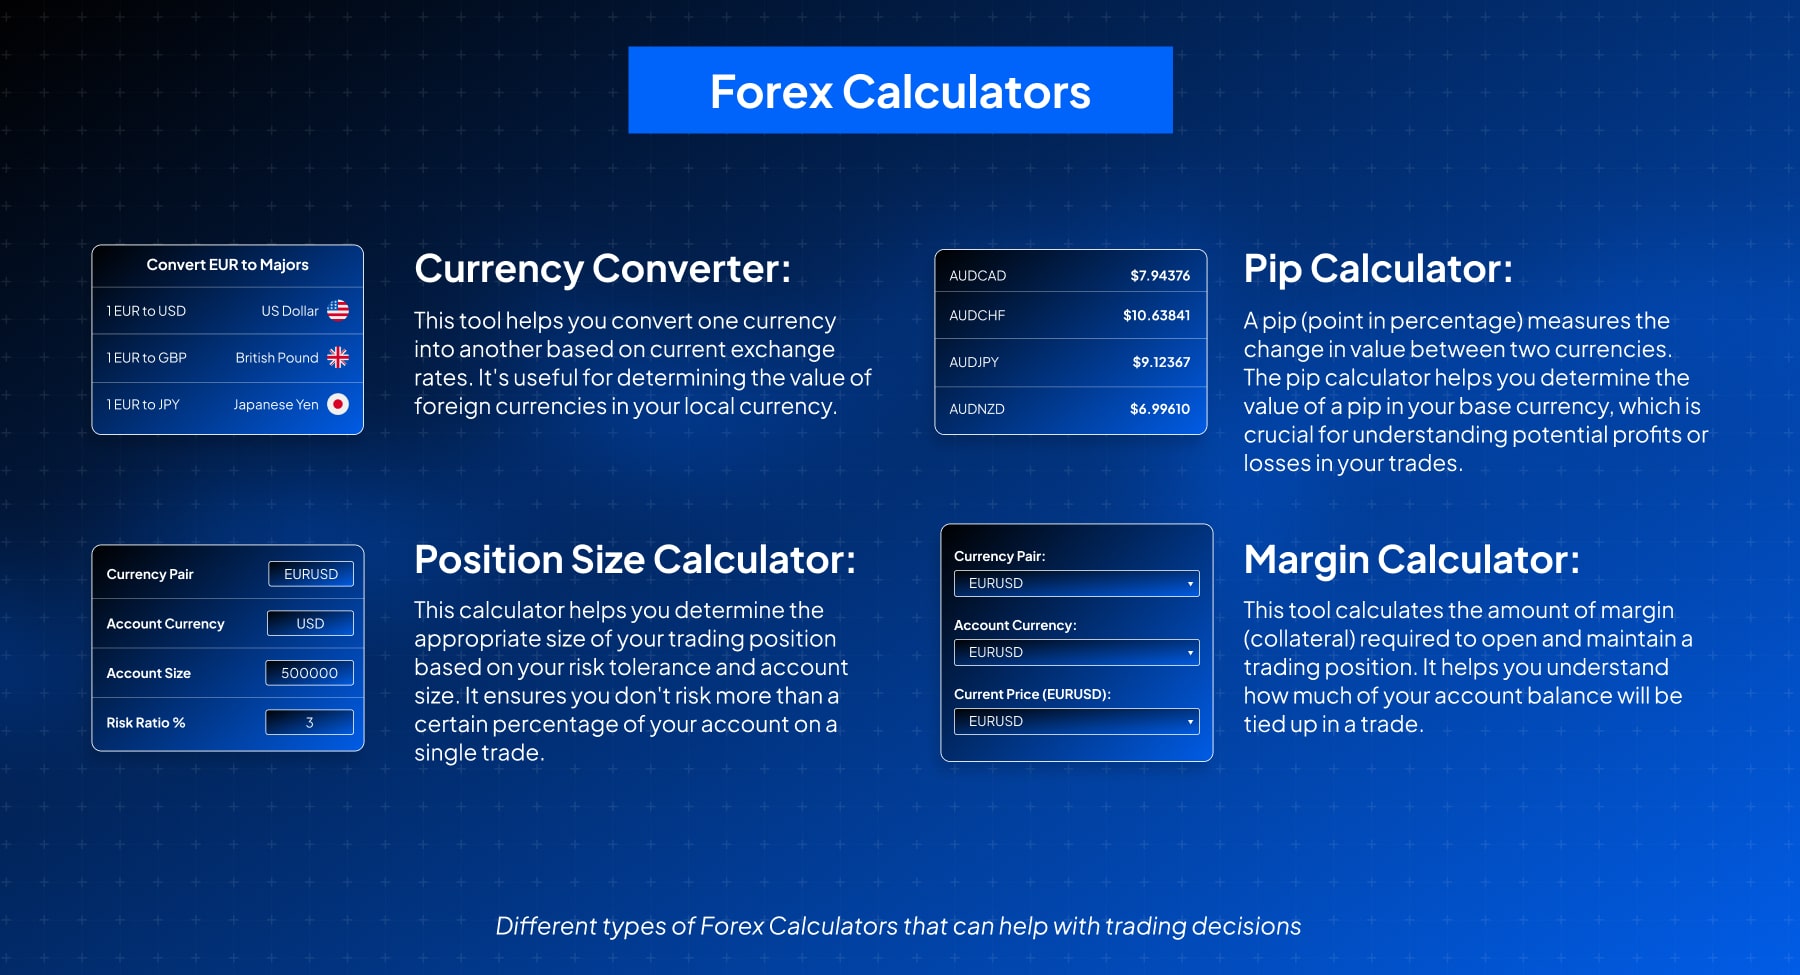
- How: Calculate position sizes based on account size and risk tolerance, using margin FX calculators to ensure precise lot sizing. A general rule is to risk no more than 1-2% of an account on a single trade, adjusting the lot size accordingly.
Monitor Economic Events and News
- Why: EUR/USD is highly sensitive to economic data from both the Eurozone and the U.S. Sudden news can cause rapid price fluctuations.
- How: Keep track of major economic releases and avoid holding large, unhedged positions during high-impact events if possible.
Trade with a Plan
- Why: A structured trading plan helps with consistent, rational decisions, reducing impulsive or emotional trades that increase risk.
- How: Set clear entry and exit rules based on technical analysis, fundamental factors, or a combination, and stick to a plan to avoid overtrading or revenge trading.
Limit Leverage
- Why: While leverage can amplify profits, it also increases risk. High leverage can lead to significant losses if the market moves in the wrong direction.
- How: Use minimal leverage, especially if a beginner. Many professional traders limit leverage to preserve capital, focusing instead on gradual gains.
Utilise Take-Profit Orders
- Why: Take-profit orders allow profits to be set at a predetermined level, ensuring gains are captured.
- How: Place take-profit orders based on realistic target levels or key price points to avoid holding positions too long and risking reversals.
Practice Risk-Reward Ratio Discipline
- Why: A favourable risk-reward ratio (such as 1:2 or 1:3) ensures that potential profits outweigh potential losses, increasing overall profitability.
- How: Set up trades where the potential reward is at least twice the potential risk, adjusting stop-loss and take-profit levels to match this ratio.
How does the USD’s strength affect EUR/USD?
The strength of the USD has an inverse effect on the EUR/USD pair because it is the quote currency in the pair. This relationship reflects a negative correlation between the USD and EUR/USD, which is often close to -1 (perfectly inverse) under stable conditions. For instance, when the U.S. dollar index (DXY), which measures the USD against a basket of other major currencies, rises, it often correlates with a decline in EUR/USD. The USD is viewed as a “safe haven” currency so it tends to strengthen during times of economic uncertainty, further weakening EUR/USD.
Top Trading Platforms for EUR/USD
The top trading platforms widely known for their features, reliability, and suitability for trading EUR/USD include the following:
MetaTrader 4 (MT4) and MetaTrader 5 (MT5)
- Overview: MT4 and MT5 are popular for margin FX trading due to their robust technical analysis tools, customisable charts, and automated trading via Expert Advisors (EAs).
- Pros: Extensive technical indicators, a large user community, and support for algorithmic trading.
- Best For: Traders who value in-depth technical analysis and customisable trading systems.
TradingView
- Overview: Advanced charting and social trading features, TradingView allows traders to access a wide array of technical indicators, drawing tools, and real-time data.
- Pros: User-friendly interface, extensive charting tools, social trading community, and customisable alerts.
- Best For: Chart-focused traders who prefer to analyse EUR/USD trends and share CFD insights with other traders.
cTrader
- Overview: cTrader offers Level II pricing, algorithmic trading capabilities, and advanced charting tools.
- Pros: Transparency with Level II pricing, customisable trading environment, and automated trading support through cAlgo.
- Best For: Traders who want in-depth market data and prefer a highly customisable platform.
Should I Focus on Short-Term or Long-Term Trades?
Whether to focus on short-term or long-term trades with EUR/USD depends on trading style, goals, and risk tolerance. Consider the following pros and cons of each trading style:
Short-Term Trading (Day Trading and Scalping)
Pros:
- Takes advantage of daily volatility in EUR/USD, especially during active hours like the overlap of the London and New York sessions.
- Allows for quick profit-taking on smaller price movements.
- Reduced exposure to overnight risk from unexpected news or economic events.
Cons:
- High time commitment and need for close monitoring.
- Requires more skill in fast decision-making and precise timing.
Long-Term Trading (Swing and Position Trading)
Pros:
- Aligns with broader economic trends, interest rate differentials, and policy shifts by the ECB and Fed.
- Less need for constant monitoring, focusing instead on larger moves over days, weeks, or even months.
- Lower transaction costs due to fewer trades and less impact from spreads.
Cons:
- Increased exposure to overnight or weekend risk from unexpected events.
- Requires strong discipline and may involve holding through temporary unrealised losses in favour of larger trends.
Common Mistakes to Avoid in EUR/USD Trading
- Overusing Leverage: Can quickly deplete capital, especially in volatile markets.
- Ignoring Economic Indicators: Leads to incomplete analysis.
- Overtrading: Entering too many trades without proper setup increases risk.
- Failing to Manage Risk: Not using stop losses or taking oversized positions can result in losses.
The material provided here has not been prepared in accordance with legal requirements designed to promote the independence of investment research and as such is considered to be a marketing communication. Whilst it is not subject to any prohibition on dealing ahead of the dissemination of investment research we will not seek to take any advantage before providing it to our clients.
Pepperstone doesn’t represent that the material provided here is accurate, current or complete, and therefore shouldn’t be relied upon as such. The information, whether from a third party or not, isn’t to be considered as a recommendation; or an offer to buy or sell; or the solicitation of an offer to buy or sell any security, financial product or instrument; or to participate in any particular trading strategy. It does not take into account readers’ financial situation or investment objectives. We advise any readers of this content to seek their own advice. Without the approval of Pepperstone, reproduction or redistribution of this information isn’t permitted.