- English
- 中文版
Some basic information about Naspers
Naspers is a global internet group and one the largest technology investors in the world. Naspers share price is quoted and traded on the Johannesburg Stock Exchange. Stock market ticker NPN.
Naspers is a popular traded stock in the South African region.
The rise and fall of Naspers share price
Like a lot of technology stocks, Naspers share price outperformed during the COVID-19 lockdown period with the stock reaching a high of 388800 in January 2021. This was driven by consumers being locked down and craving digital first technology for entertainment.
So why the decline? Is this selloff a broad-based decline in technology stock or is Naspers share price taking the brunt of the fall?
A look from a technical perspective
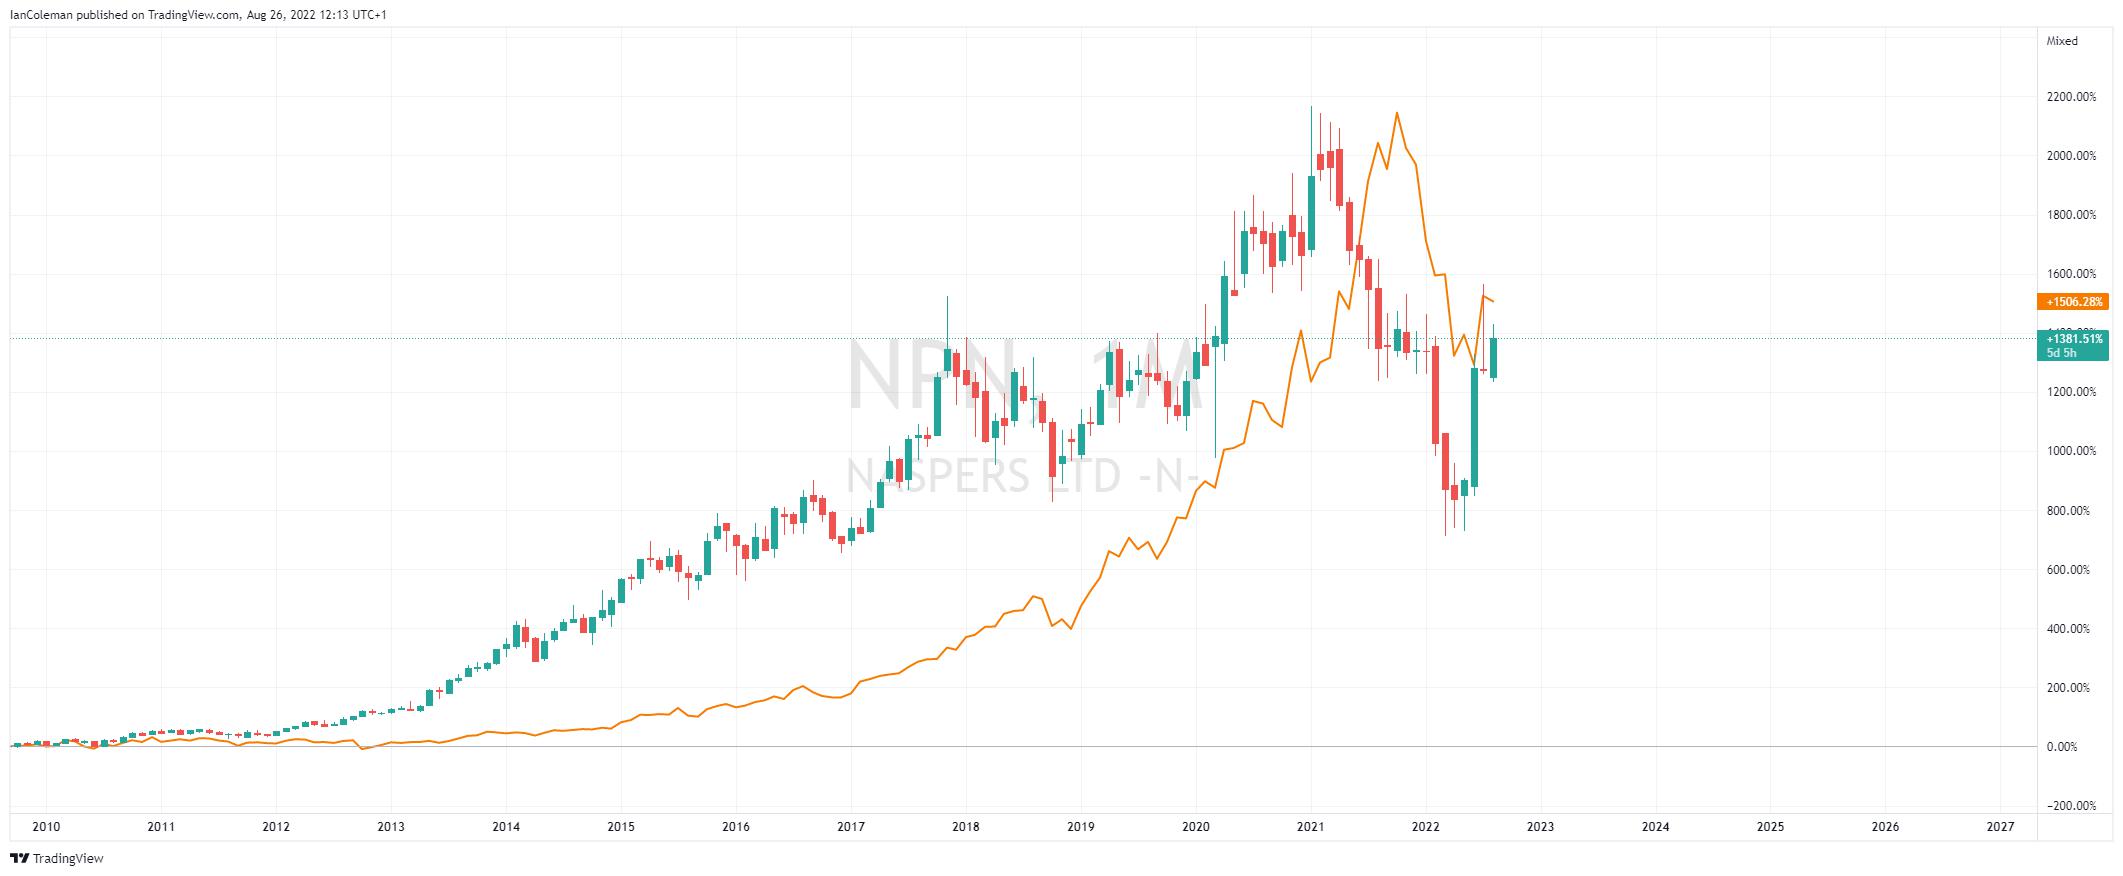
The MSCI World Information Technology Index tracks large and mid-cap technology companies’ performance from 23 developed markets (orange line). Although this broader technology index started its decline later, in October 2021, there is clear a correlation with Naspers share price. Technology stocks have seen a small period of increased value over the last few months.

Figure 1 Trading View NPN versus MSCI
NPN weekly price chart
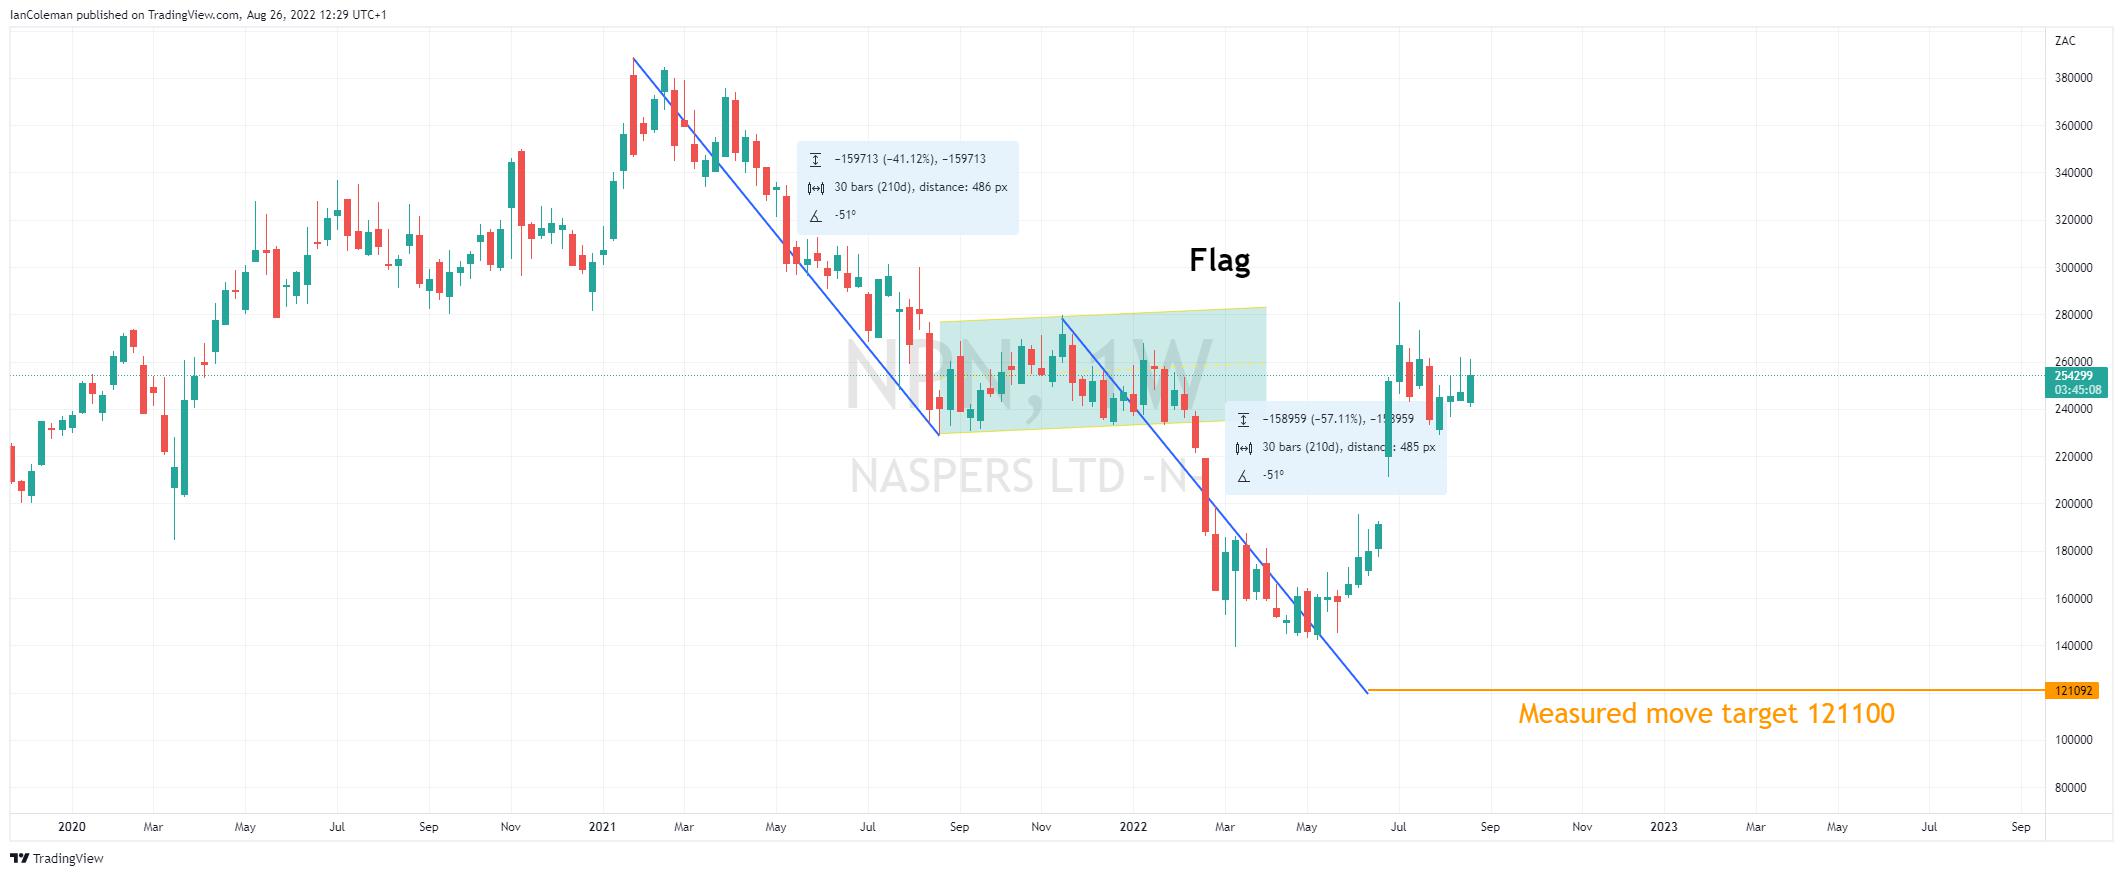
After the initial selloff from January to August 2021, NPN share price saw a period of consolidation. From a technical analysis approach, this could be seen as a bearish flag formation. A break of the trend channel low, on the week 14th February, fell short of achieving its measure move target of 121100.

Figure 2 Trading View NPN Flag formation
NPN daily price chart
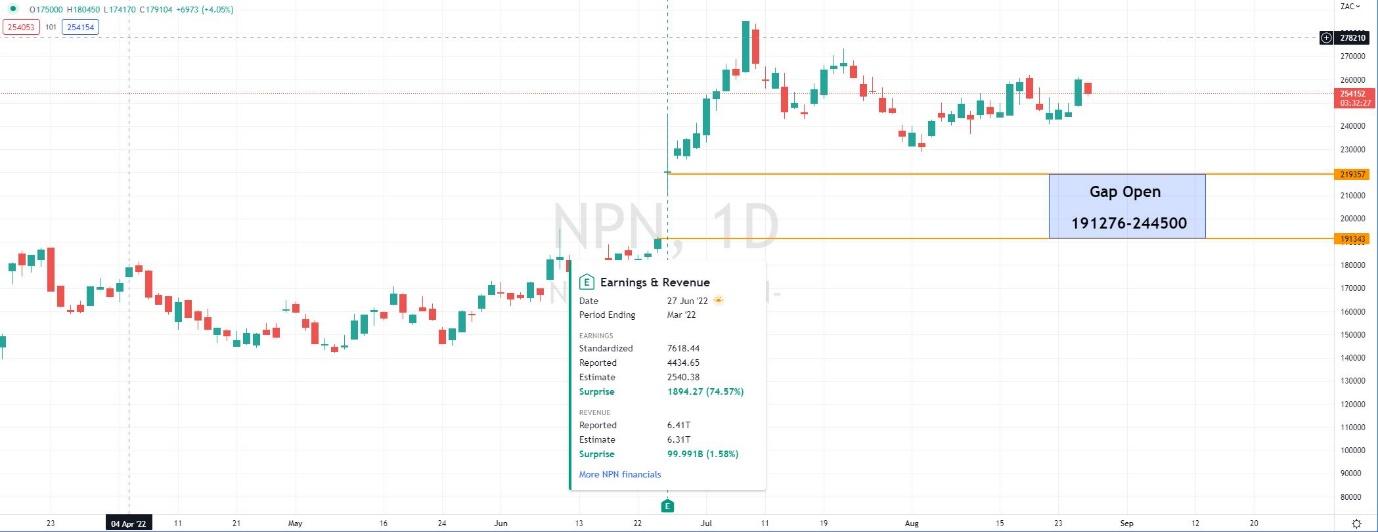
A surprise Earnings Report on the 27th of June resulted in a jump in the NPN share price from 191276 to 244500, leaving a gap or window open. Gaps and windows tend to be closed.

Figure 2 Trading View NPN Earnings report gap open
NPN monthly price chart
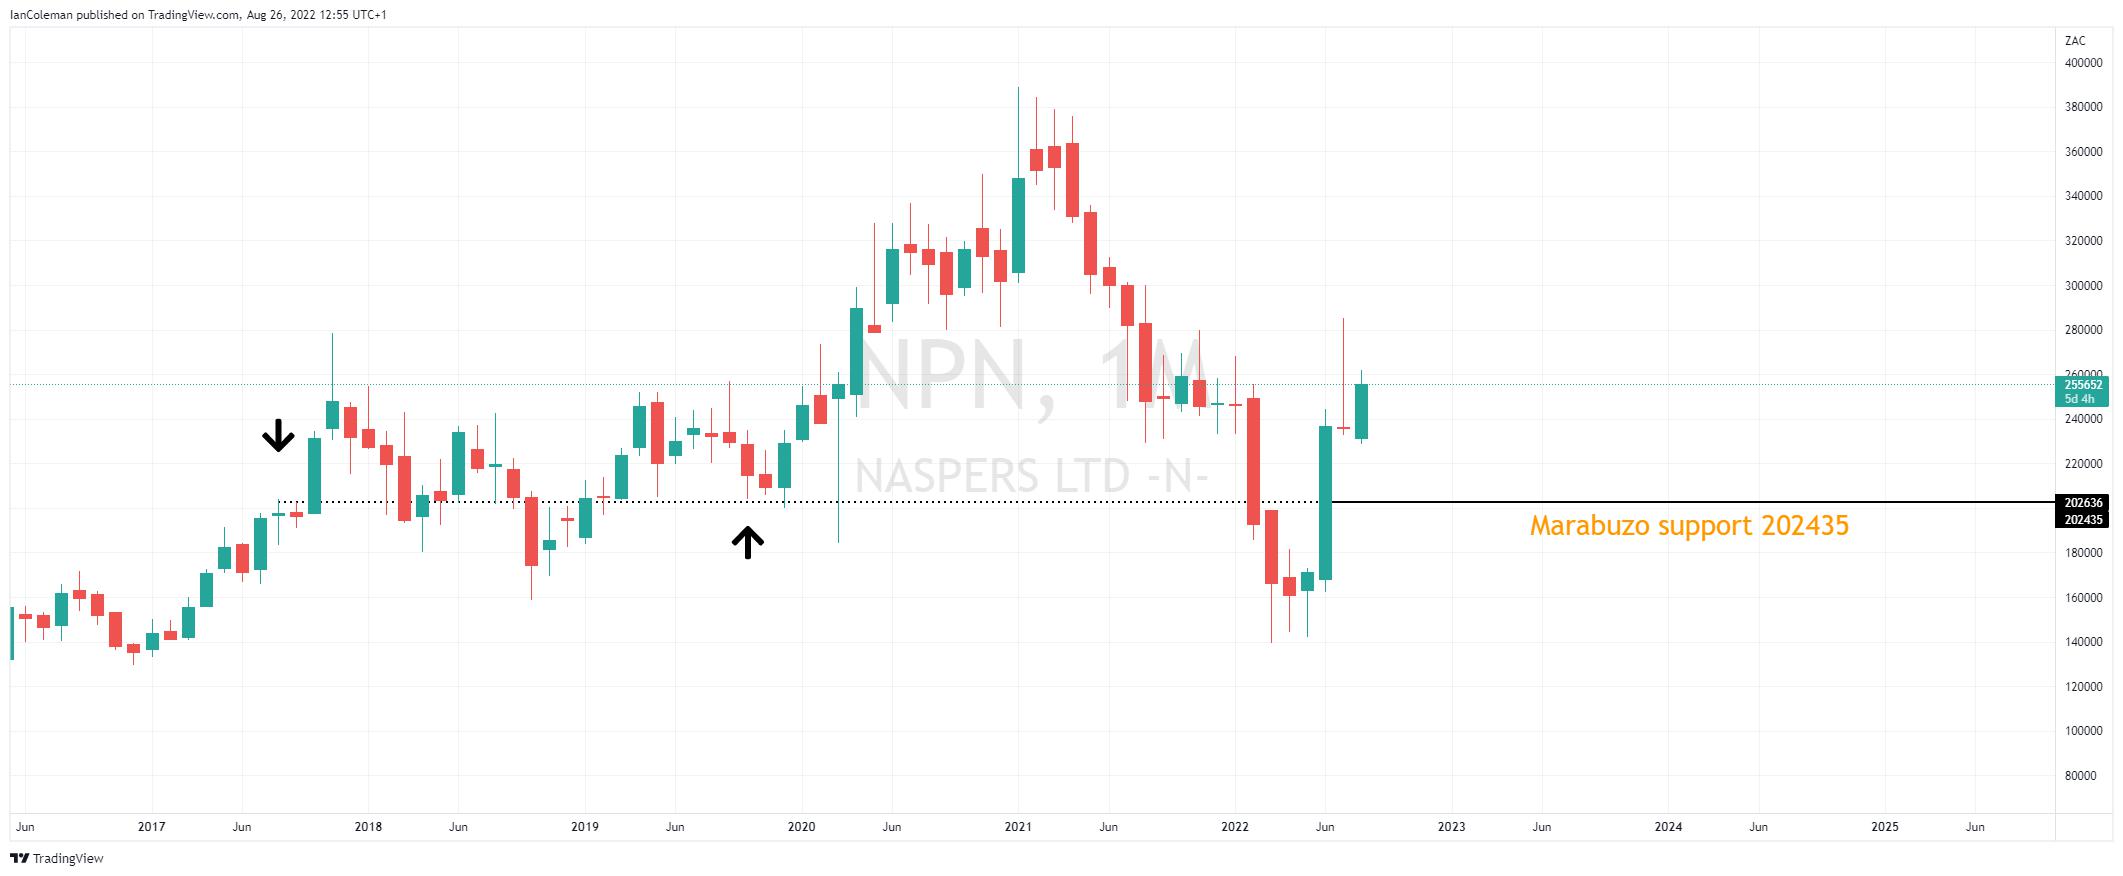
The strong upward move on the week 1st of June has resulted in Marabuzo support at 202435. This is a technical support level taken from the middle of a strong bullish or bearish candle. This area has been pivotal in 2017 and 2019. It should also be noted that the area is central with regards to the gap/window left open.

Figure 2 Trading View NPN Marabuzo support
For more information on technical analysis, click on the following link.
Related articles
The material provided here has not been prepared in accordance with legal requirements designed to promote the independence of investment research and as such is considered to be a marketing communication. Whilst it is not subject to any prohibition on dealing ahead of the dissemination of investment research we will not seek to take any advantage before providing it to our clients.
Pepperstone doesn’t represent that the material provided here is accurate, current or complete, and therefore shouldn’t be relied upon as such. The information, whether from a third party or not, isn’t to be considered as a recommendation; or an offer to buy or sell; or the solicitation of an offer to buy or sell any security, financial product or instrument; or to participate in any particular trading strategy. It does not take into account readers’ financial situation or investment objectives. We advise any readers of this content to seek their own advice. Without the approval of Pepperstone, reproduction or redistribution of this information isn’t permitted.

