View all Indices guides

A beginner’s guide on how to trade the DAX
The DAX is a measure of the 40 major blue-chip companies trading on the Frankfurt Stock Exchange
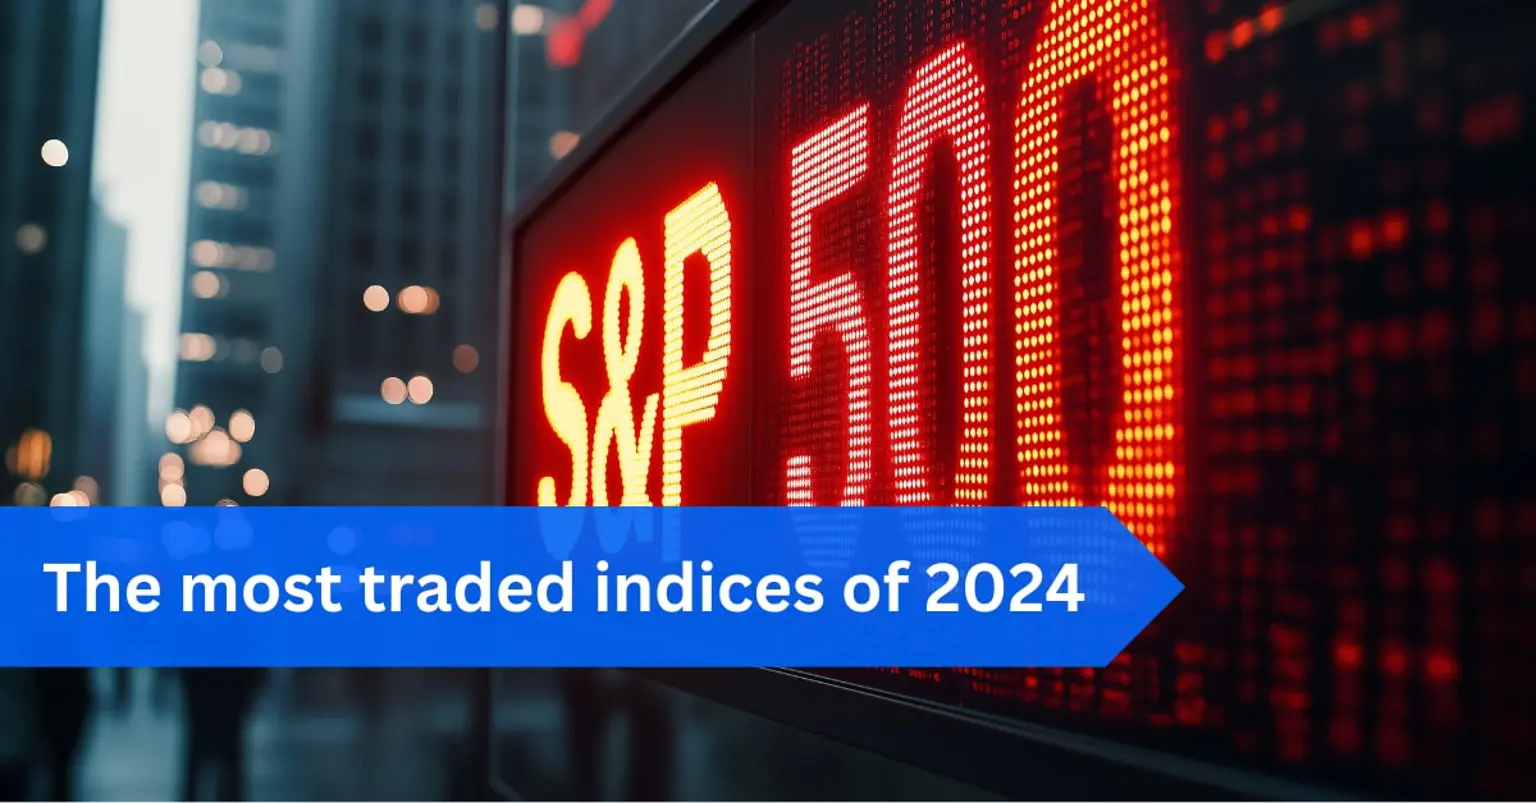
What are the most traded indices of 2024?
Share CFDs indices track the performance of a selected group of share CFDs
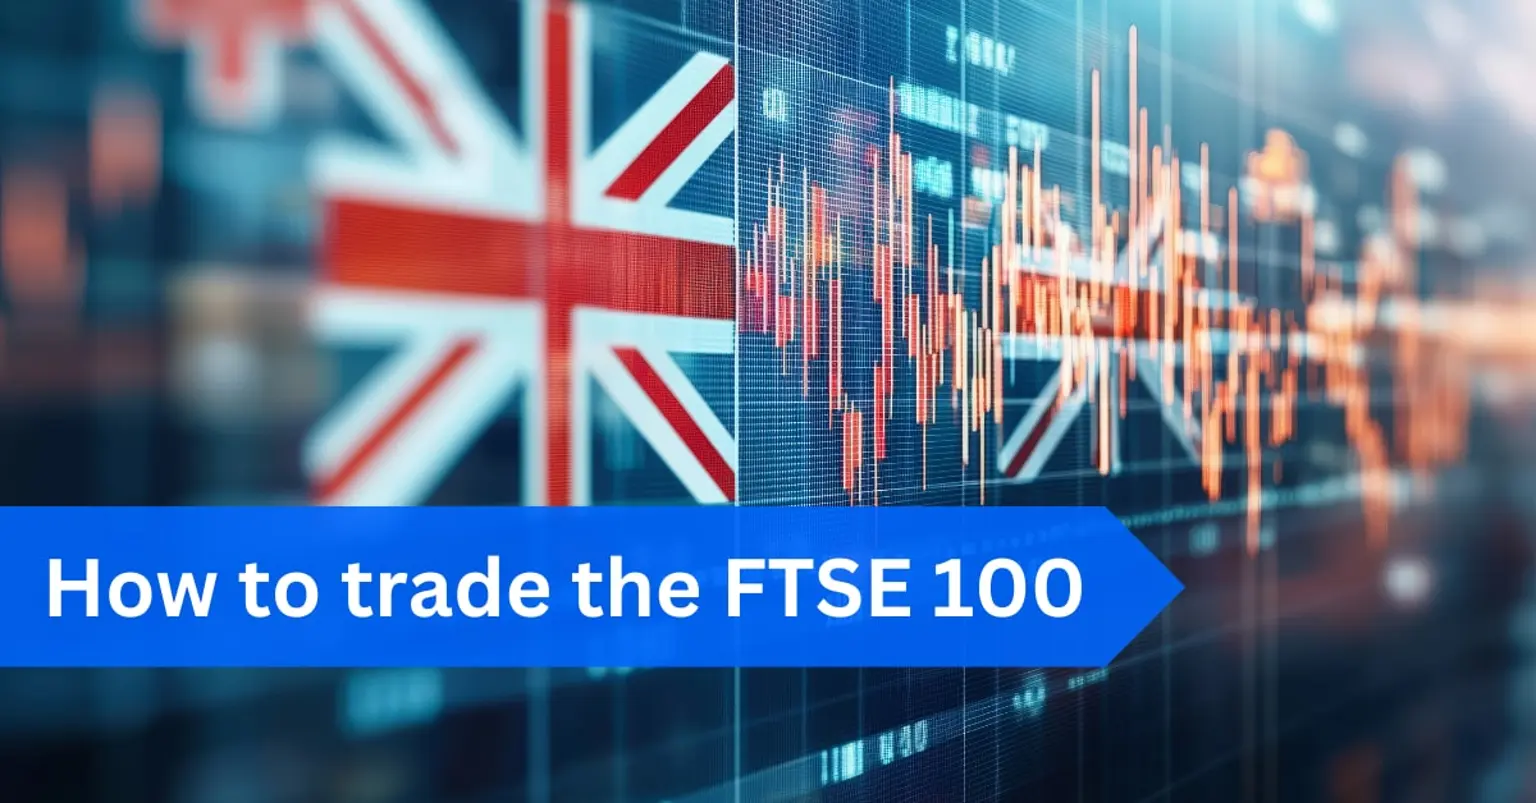
How to trade the FTSE 100
Trading the FTSE 100 offers opportunities for short-term traders and long-term investors.
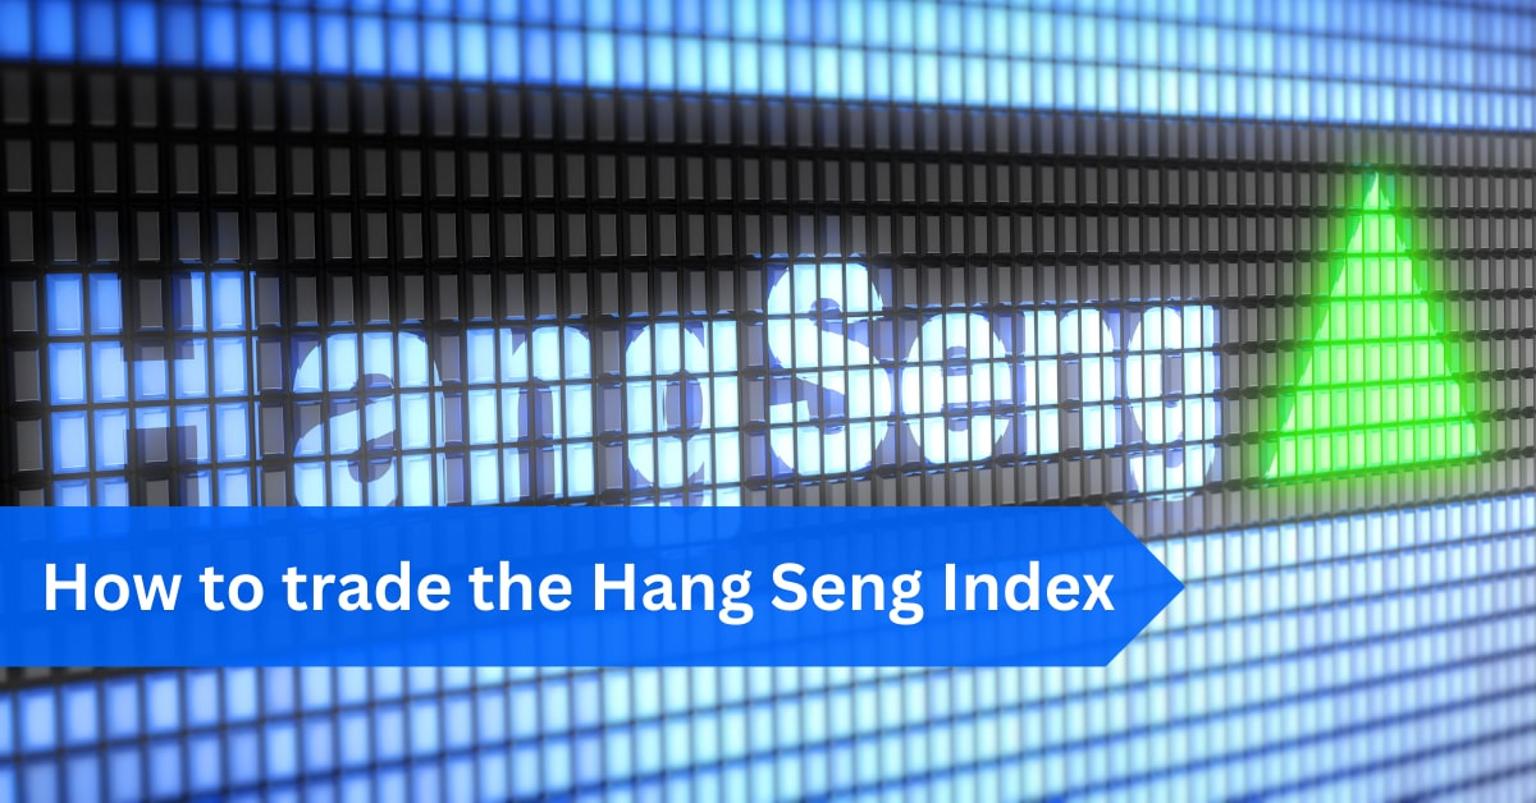
How to trade the Hang Seng Index
The Hang Seng Index (HSI) is a key share CFD market benchmark in Asia, reflecting Hong Kong’s financial market
The team behind the insights
From market strategies to financial writing, our team creates the content that helps you grow.

Caroline Tidman
Head of Content

Dilin Wu
Research Strategist

Evan Rouse
Financial Writer