- English
- 中文版
Differences between Fundamental and Technical Analysis?
What Is Fundamental Analysis?
Fundamentals are the building blocks of the markets:
They are individual data points that, when combined, mean that traders and analysts can compare current and historic valuations, and make forecasts about future price movements and market trends.
Fundamental analysis makes it possible to directly compare share CFDs, or other instruments, which in turn allows traders to take a view on which one has the better prospects. And whether or not, those prospects are fully reflected in the current price of these assets. If the asset is determined to be undervalued, the trader will buy it. If it's overvalued, they may sell it or wait for an opportunity when the asset's real value drops.
Analysing a share CFD's earnings, its dividend history, and other metrics, can provide traders with valuable insights into the nature of the market, and what it currently does, and doesn't value.
This an exercise that can highlight share CFDs that may be over, or undervalued, relative to their industry sector or index.
What Is Technical Analysis?
Technical Analysis is the study of price and market sentiment.
Technical analysts focus on what's known as the “price action”, a combination of the price history and the volume traded in a security, alongside key information contained within that data.
An example of this is the high, low, open, and closing prices for a security, posted within a specific time frame.
Whether that’s over 15 minutes in short-term trading, or several months' worth of data, for much longer-term investments.
Technical Analysis is often the first form of market analysis that traders are introduced to.
That’s because it has several basic techniques that are easy to understand and straightforward to implement.
Technical analysts study various forms of price charts which record how a security has performed over time, and which visualise that performance using a variety of different plots, and representations, of the data.
Technical analysts and traders may draw on, or annotate their charts, and they often use indicators and other specialist tools to enhance their analysis.
These price charts used to be drawn by hand, but today technical analysts and traders use specialist charting software to conduct their research.
The Main Tools of Fundamental Analysis
The main tools of fundamental analysis are data, ratios and comparisons.
When trying to value a share CFD it's customary to look at the company's revenues and earnings, the firm's fixed and variable costs, levels of debt and cash flow generation, dividend history and many other metrics.
Armed with this data it's possible to calculate key ratios, for example, knowing what the company's earnings and current price are, means it's possible to calculate a PE, or price-earnings ratio, for the share CFD.
Whilst knowing the company's revenues and its current price, allows for the calculation of its Price-to-Sales ratio.
Once armed with this kind of data traders can compare the share CFDs under observation to their peer groups, as well as benchmarks, such as the sector and index averages.
Being able to compare a group share CFDs using a common framework means it's possible to identify outliers, be they over or undervalued, versus their peers, As well as those share CFDs that are more closely aligned within sector and index norms.
Comparing share CFDs using a series of standardised metrics makes it possible to identify outliers. For example, share CFDs which have over or underperformed, relative to their peers. Or those share CFDs which are trading on a higher or lower PE multiple than the sector average.
Data tables and spreadsheets make it possible to compare the fundamentals of large groups of share CFDs simultaneously, it's possible to apply filters, and screen for key characteristics, for example, all the share CFDs in an index trading on a PE ratio of less than twenty.
The Pros and Cons of Fundamental and Technical Analyses
Each of these disciplines can be very useful and informative for traders. Technical analysis can be more immediate and can help to analyse markets in the short-term, in a way that fundamental analysis really can't.
Pros of fundamental analysis
Fundamental analysis uses a set of common ratios, terms and valuation metrics which, at a top down level, are easy to understand and implement.
Fundamental analysis allows for a direct comparison between share CFDs, other financial instruments, or even the relative performance of whole economies.
Using fundamental analysis it is possible to build models that can calculate valuations, and predict future earnings, revenues and other items.
Cons of fundamental analysis
Many of the inputs into fundamental analysis are based on historical data, this data may only be updated a few times a year. For example quarterly at best, in the case of corporate earnings data.
The alternative to using historical data is to rely on future forecasts. However the further out into the future those forecast are for, then the less reliable they are likely to be.
The deeper you dig into fundamental analysis the more complicated it becomes, particularly when looking at items like balance sheets and cash flow statements.
Pros of technical analysis
Technical analysis can be conducted on the price of an instrument in real time, as its price changes.
Moving averages and other indicators can be applied to a price chart to provide a more holistic view of the price action and the thinking among traders, towards a particular share CFD or other instrument.
Basic technical analysis techniques can be quickly understood, and easily deployed, by those that are new to trading. Providing them with a way to get a feel for the markets and potential price changes.
Followers of technical analysis believe that the chart contains all the information that's needed to be able to value and trade a security.
That belief is based on the idea that the price chart is a summary of the actions, intentions and sentiments, of all the traders, in a particular market, at a given time.
The price chart summarises, trader sentiment, order flow, support and resistance levels in one plot. What's more it can also highlight items such as breakouts and failure points within the price action.
Cons of technical analysis
Technical analysis is more of an art than a science.
And though there are rules, and well documented chart patterns to look out for. Much technical analysis comes down to interpretation.
And that depends on the views of individual trader or analyst. Particularly when it comes to working out what might happen next.
Critics of technical analysis say that its great for visualising what happened in the past, but much less good at predicting the future.
How Can Quantitative Analysis Strategies Be Incorporated Into Fundamental and Technical Analysis?
Quantitative Analysis could be said to bridge the gap between fundamental and technical analysis.
It is a mathematical and statistical discipline, in which computers sift through large volumes of data looking for market trends, repetitive behaviours, patterns and price anomalies.
Quantitative analysts hope to create a trading edge by identifying mispricings, or through exploiting market phenomena such as mean reversion and seasonality.
Quants, as these analysts are known, tend to be highly intelligent, well-qualified individuals, with expertise in maths, data science, or other STEM subjects, they often work for banks, hedge funds and other institutions.
However, Individual traders can incorporate quantitative techniques into their fundamental and technical analysis.
This has been made much easier, thanks to the rise of generative AI and the large number of apps, and other software, that leverage this new computing power.
For example, a trader or analyst could ask a generative AI app to run statistical analyses on a spreadsheet of price and volume data, or, a spreadsheet of fundamental data, about the constituents of a share index CFDs.
The output from which, could be used as a starting point for further fundamental or technical analysis.
Or as a decision support tool when filtering through existing trade ideas.
Programming languages such as Python and Pine have also become synonymous with Quantitative Analysis, and many traders now utilise scripts, or short programs, that are specifically coded for their charting and trading platforms, to enhance their study of the markets and their trade execution.
Fundamental and technical analysis in risk management
Effective risk management can be key to a positive trading experience.
Managing risk efficiently allows traders to be in the market for the longest possible period, exposing them to a large number of trading opportunities and setups.
Traders can use technical analysis techniques within risk management, by, for example, closing trades if a price moves above or below a key moving average.
Or if the price of an instrument experiences a specific number of successive price moves, in a particular direction. What's known as a price cascade, for example, 5 successive new period highs or lows.
It is also possible to use fundamentals to help manage your risk.
Traders might choose to reduce trade sizing if, say, the average PE ratio for an index rises above a preset level.
Or use a tighter stop loss, when the market is experiencing heightened volatility. Volatility is a measure of the tendency for sharp price swings, in a given market or instrument.
Using technical indicators to confirm fundamental analysis
It’s possible to combine technical and fundamental analysis, and to use the technical analysis of price charts, to act as confirmation, for trading ideas or signals, generated through fundamental analysis.
For example, by studying and analysing financial statements, profit margins and other fundamental ratios, traders could create a list of share CFDs, which have “underperformed” the wider market.
Subjecting the charts of those share CFDs to technical analysis could highlight items, within the list, that are at key junctures on their price charts.
For example, those share CFDs trading just below key moving averages, or long-standing trend lines.
Traders might want to see the price move through these technical levels, perhaps in combination with a signal from an indicator, such as RSI 14, that can highlight a change in momentum, before initiating a trade.
Technical analysis can also be used to identify trend changes and to judge the strength of a trend, both of which can inform entry and exit points, in new and existing trades.
Integrating macroeconomic factors with technical analysis
Applying technical analysis techniques to economic factors and charts is frowned upon by purists.
However, technical analysis is very good at highlighting trends in a chart, and at identifying changes in momentum, within time series data. Be that daily price data or the weekly jobless claims, in the US.
Adding a trend line, and or a line that highlights horizontal support or resistance to the chart of an economic indicator, can provide traders with an immediate sense of the direction of travel in the indicator over time.
And perhaps more importantly which way the momentum within the data is heading.
If you can access and download the time series data for an economic factor, such as unemployment, wage growth, consumer spending etc. Then it would be possible to calculate moving averages for the data and to plot those averages on a chart, with the economic indicator itself.
Surprises move markets, and the bigger the degree of surprise, the larger the market reaction usually is.
Using technical analysis to gauge and highlight surprises, in macroeconomic data, could provide traders with a trading edge.
However, as we previously highlighted, technical analysis relies heavily on the interpretation of the data and signals it produces. Trades that are based on an incorrect interpretation of those signals could prove to be very costly.
Using Technical and Fundamental analysis to trade CFDs
The first thing you should do if you want to use fundamental and technical analysis to trade CFDs is to learn more about each of these disciplines.
There are plenty of resources on line including educational articles about technical and fundamental analysis from Pepperstone.
Once you have researched these subjects the next thing to do is open a trading account.
You don't have to jump straight into the live market, however.
Instead you can practise using a demo account which is a realistic simulation of the live trading environment. But one in which you don't have to risk real money.
The demo account allows users to test and refine trading strategies, to get to know the dealing platforms and get familiar with the way that markets move.
The next step is to choose an asset class to trade, that could be share indices CFDs, individual equities, commodity CFDs or margin FX.
Then it's time to think about position sizing and risk appetite. Considering items such as but not limited as to how much of the trading account balance to risk on an individual trade, how many trades to have open at the same time, the placement of stop losses and risk reward ratios.
Now it’s time to place your transaction and monitor your trade, which you can do in real time on your desktop pc , laptop or mobile device.
While it is possible to trade or invest by other means, trading CFDs is the only option on Pepperstone’s trading platforms.
Using CFDs it is possible to trade long or short a long trade being a buy a short trade a sale.
For example look at this two year candle chart of Meta Platforms.
Which shows that the Meta share CFD price is close to its all time highs, and to an area of horizontal resistance, having been in an uptrend since November 2022.
There are two potential possibilities here:
One is that the price of Meta breaks above its all time high of $542.81, and moves higher still.
Or that it fails to make a move higher and potentially retraces back to support found at, and around $450.00.
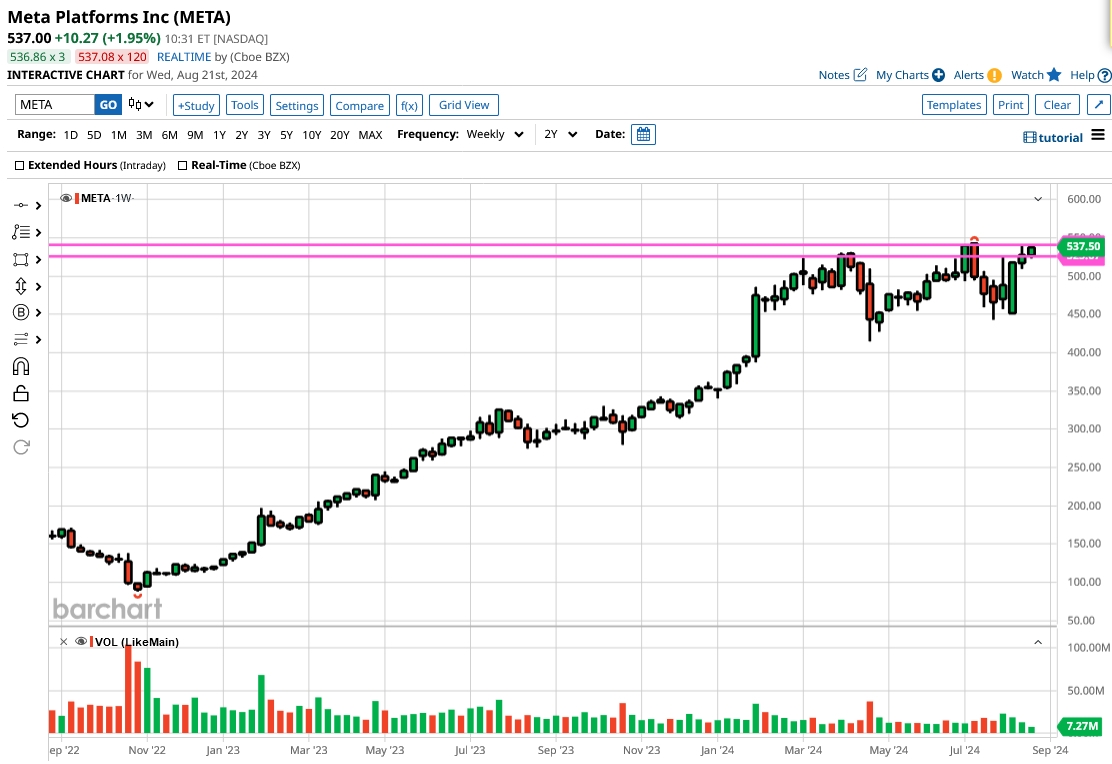
Source: Barchart.com link
CFD traders could set alerts in Meta for a break above the all time high, or look for a further rejection, at or around this price.
The thinking being that if the price breaks cleanly above the all time high, then momentum may carry the price higher still.
However if the price continues to fail at these levels, then sellers of the share CFD may have an opportunity to take control of the price action.
Using CFDs it is possible to trade either of these outcomes by going long on a break above the all time high, or by opening a short position on a further failure, and any subsequent breakdown in the price action.
The material provided here has not been prepared in accordance with legal requirements designed to promote the independence of investment research and as such is considered to be a marketing communication. Whilst it is not subject to any prohibition on dealing ahead of the dissemination of investment research we will not seek to take any advantage before providing it to our clients.
Pepperstone doesn’t represent that the material provided here is accurate, current or complete, and therefore shouldn’t be relied upon as such. The information, whether from a third party or not, isn’t to be considered as a recommendation; or an offer to buy or sell; or the solicitation of an offer to buy or sell any security, financial product or instrument; or to participate in any particular trading strategy. It does not take into account readers’ financial situation or investment objectives. We advise any readers of this content to seek their own advice. Without the approval of Pepperstone, reproduction or redistribution of this information isn’t permitted.