Summary
Over the past few years, crypto trading has surged in popularity as Bitcoin captured global headlines. The potential for high returns and the appeal of a decentralised financial system makes digital currencies highly attractive to many.

Reviewed and edited by: Maria Stylianou | Senior Copywriter
What is cryptocurrency CFD trading?
A cryptocurrency CFD---often called crypto---is a type of digital asset that uses cryptography for security and verification, operating on decentralised networks such as blockchains. Unlike traditional currencies controlled by governments or central banks, cryptocurrencies are maintained by a distributed network of computers (nodes).
While many cryptocurrencies CFDs were originally designed as a means of payment, today, they serve many other purposes, including powering blockchain-based applications, enabling smart contracts, supporting decentralised finance (DeFi), and facilitating tokenised assets.
Cryptocurrency trading is the act of buying and selling digital currencies such as Bitcoin, Ethereum, and other altcoins via an exchange, or speculating on cryptocurrency CFDs price movements through CFD trading. Let's dive deeper into it below:
Buying and selling cryptocurrencies on an exchange:
When you buy cryptocurrencies through an exchange, you're purchasing the coins themselves, paying the full value upfront and storing them in your own digital wallet. This gives you ownership of the actual digital assets, meaning you can transfer them to others, hold them for long-term investment, or use them in blockchain-based applications.
CFD trading on cryptocurrencies:
With CFD trading, you can speculate on cryptocurrency CFD price movements without owning the actual coins or needing a digital wallet. You can go long (buy) if prices are expected to rise or short (sell) if prices are expected to fall. CFDs are leveraged products, meaning a small deposit gives you exposure to larger market movements, magnifying both potential profits and losses.
How do cryptocurrency CFD markets work?
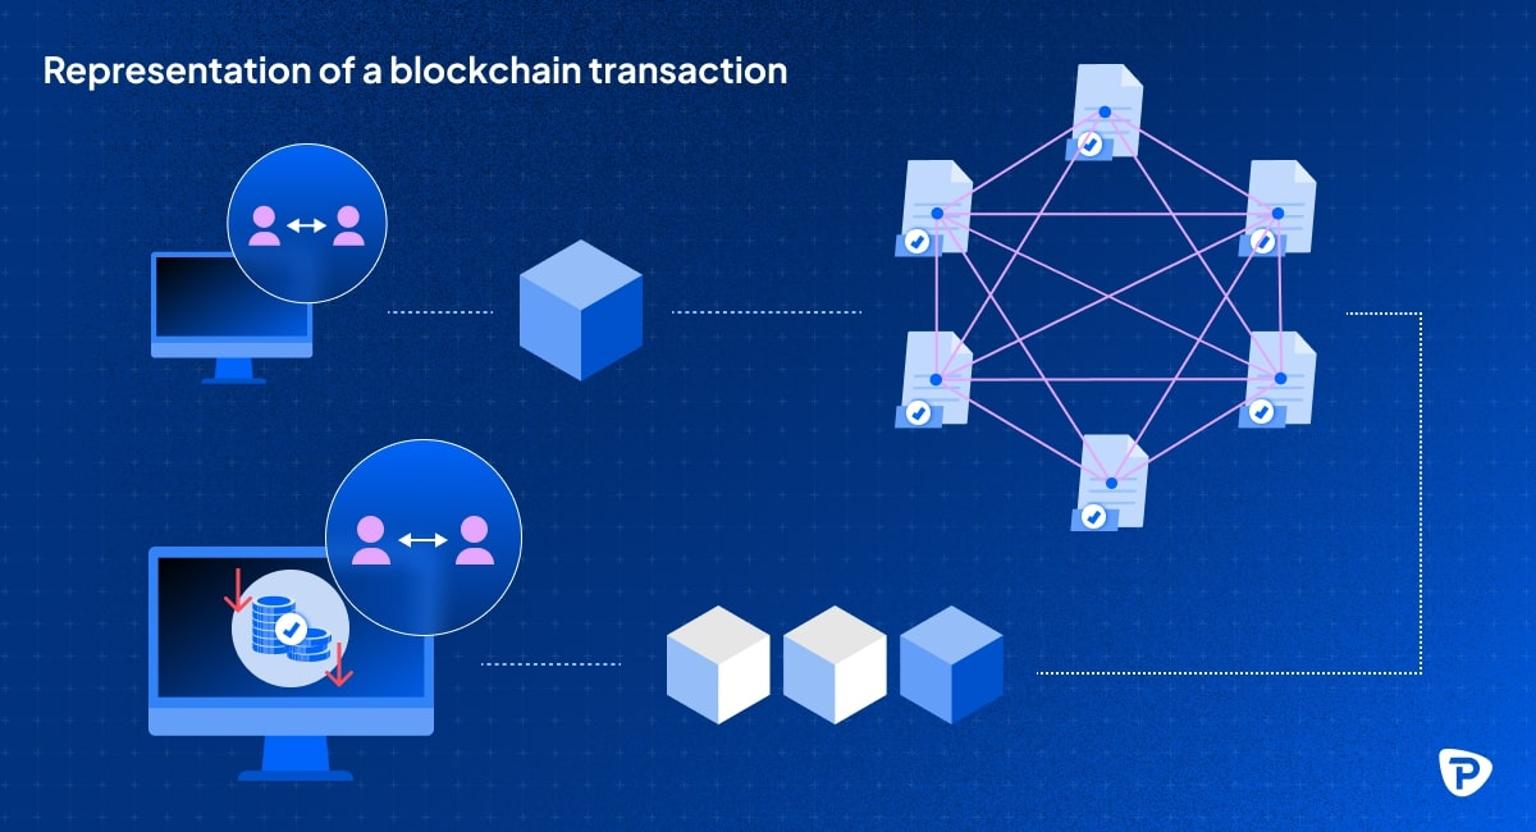
As mentioned earlier, cryptocurrency CFD markets operate on a decentralised computer network, where transactions are conducted peer-to-peer, without intermediaries. Since this system does not rely on a central authority or organisation, it is not affected by censorship and any incidents that could manipulate the transactions. When a transaction is made, it is verified by the network and recorded on a public, secure and transparent ledger (blockchain). Unlike traditional money, cryptocurrencies exist purely digitally and are stored in digital wallets.
A bit of a crypto CFD terminology:
- Blockchain: A digital ledger (record) that stores transactions across multiple computers. It's secure, decentralised, and cannot be altered without consensus.
- Blocks: Individual records on a blockchain that store transaction information. Each block is linked to the previous one, forming a chain.
- Decentralised finance (DeFi): A blockchain-based form of finance that eliminates intermediaries like banks, allowing peer-to-peer transactions.
- Crypto mining: The process of using specialised computer systems to verify cryptocurrency CDFs transactions and add new blocks on a blockchain.
- Units: The smallest amount of a cryptocurrency CFD, like a 'Satoshi' in Bitcoin, which is 0.00000001 BTC.
- Wallet: A digital tool that stores your cryptocurrencies CFDs and allows you to send and receive them safely.
- Altcoins: Any cryptocurrency CFDs except Bitcoin, including Ethereum, Litecoin, and Ripple.
What moves cryptocurrency CFD markets?
Cryptocurrency CFD markets are highly volatile, meaning that prices can fluctuate significantly within a short period. Movement is driven by various forces, such as:
- Technological advancements: Upgrades to blockchain or the addition of new features can boost traders' confidence and market sentiment.
- Regulatory news: Both positive and negative news about regulations can affect prices, with government actions influencing market direction.
- Market sentiment: Investor mood tends to get affected by social media, news, and overall market trends.
- Macroeconomic factors: Economic conditions like inflation and global financial stability have an impact on crypto CFD's appeal.
- Speculation and trading volume: Higher speculation and volume lead to increased volatility, creating potential trading opportunities.
- Expanded adoption: Widespread use of crypto CFD can impact the asset's value.
- Security issues: Breaches or hacks on exchanges can erode confidence, leading to loss in market value.
Cryptocurrency CFD trading
Trading CFDs on cryptocurrency CFDs involves speculating on their price movements relative to a currency. If your prediction is correct, you may make a profit; if the market moves against you, you'll incur a loss.
Pepperstone offers CFD trading on cryptocurrencies CFDs which is what we'll focus on for the rest of this guide. Let's dive straight into some key elements of cryptocurrency CFD trading.
Leverage
With leverage, you can control a bigger position on a digital asset with a smaller amount of capital. For instance, with 2:1 leverage, you can trade $2,000 worth of a cryptocurrency CFDs by only using $1,000 of your own capital.
While leverage can boost your profits, it also increases the risk of major losses. Therefore, it should be used cautiously, and you need to make sure you have adequate risk-management strategies in place to shield your capital.
As a regulated provider, Pepperstone offers up to 2:1 leverage on cryptocurrencies CFDs.
Margin
This is a specific amount of money needed to open and maintain a leveraged position. There are two types of margin:
- Deposit margin: The amount needed to open a position, which is usually represented as a percentage of the total trade.
- Maintenance margin: The amount required in your account to help you withstand reasonable losses on your position.
If you believe that the price of Bitcoin will go up, you can open a long CFD position (buy) with the expectation to profit from the increase.
Let's say the current price of BTC/USD is $95,000* and the standard lot size is 1 Bitcoin. You decide to open a position of 0.01 Bitcoin, which is one micro lot. The total value of the trade, and your full exposure, is therefore:
Position size x current BTC price = 0.01 × $95,000 =$950.
If your provider offers 2:1 leverage on Bitcoin, you'll need to put down $475 to open the trade ($950 / 2 = $475).
If the price of Bitcoin rises by $5,000 to $100,000, you can close your position and sell it at this higher price. Your profit is therefore 0.01 × 5,000 = $50.
If the BTC price instead fell by $5,000 to $90,000, your loss would be 0.01 × -5,000 = -$50.
*Bitcoin price as of April 2025.
Spread
Spread is the difference between the buy (ask) and sell (bid) prices of a cryptocurrency CFD. It essentially represents the cost of executing a trade and depends on current market conditions and the pricing that the broker provides. The smaller the spread, the better the market liquidity.
As a cryptocurrency CFD trader, you'll need to factor in the spread when planning out your trades, as it will affect the potential profitability of your positions.
For Pepperstone's full pricing details on spreads, visit this page.
Lot
Lot refers to the standardised unit size of a trading position. In other words, it determines the amount of the asset being traded. The size of a lot tends to depend on the broker and the specific cryptocurrency CFD. At Pepperstone, a standard lot equals one Bitcoin. Understanding how lot sizes work is key to managing your risk effectively, especially in a market as fast-moving as crypto. It helps you calculate position size, potential profit or loss, and margin requirements.
Pip
A pip -- or percentage in point -- is the smallest price increment that a cryptocurrency CFD can move. For most cryptocurrency CFDs, a pip is equal to one hundredth of a percent (0.01%). However, the value can vary, again, depending on the cryptocurrency and the broker's pricing model.

What are the most popular cryptocurrency CFD?
Undoubtedly the most popular cryptocurrency CFD is Bitcoin (BTC), although Ethereum (ETH), Tether (USDT) and Litecoin (LTC) are also heavily traded in today's CFD marketplace. In addition, penny cryptocurrencies - which are low-priced digital currencies - like Dogecoin have also gained a notable group of followers and supporters.
Bitcoin is often referred to as digital gold, as it's the first and most widely recognised cryptocurrency CFD. However, Ethereum stands out as well for its smart contract functionality which enables decentralised applications (dApps) to run on its blockchain.
Other crypto CFDs like Ripple facilitate fast and cost-effective cross-border payments, while Litecoin allows for faster transaction times and lower fees compared to Bitcoin. Altcoins like Bitcoin Cash, which is a fork of Bitcoin also claim to provide faster and cheaper transactions.
With Pepperstone, you can trade cryptocurrency CFDs including Bitcoin, Ethereum, Litecoin, and more against major currencies, without the need for a digital wallet or cryptocurrency CFD exchange.
How do I choose which cryptocurrency CFD to trade?
Choosing the right cryptocurrency to trade with CFDs involves a careful and thorough evaluation of various factors that can impact the price movements and long-term potential of the asset.
- Analyse current and historical market trends: Review past performance, price fluctuations, and market patterns to assess volatility and make informed trading decisions.
- Understand the technological foundation: Evaluate the scalability, efficiency, and innovation of a cryptocurrency CFD's technology to determine its long-term potential.
- Research the development team: A skilled and transparent team is essential in building trust and ensuring the cryptocurrency CFD's long-term viability.
- Identify the cryptocurrency CFD's potential: Focus on cryptocurrencies with practical use cases, as they tend to have higher demand and greater adoption potential.
- Stay informed about market developments: Monitor market events, updates, and trends to make well-timed decisions.
Benefits of cryptocurrency CFD trading
- High liquidity and market accessibility: With crypto CFDs, you can enter and exit your positions swiftly with the potential for substantial returns, driven by market volatility. There is also the potential for substantial loss, so remember to add your stop-losses.
- Round-the-clock opportunities: Unlike traditional stock markets, the crypto CFDs market is open 24/7, * enabling you to capture market movements even during pre and post regular market hours.
- Diversification: cryptocurrency CFDs offer interesting diversification opportunities, serving as a potential hedge against traditional assets, though they can still be impacted by overall economic momentum like any asset.
Risks of cryptocurrency CFD trading
- High market volatility: As cryptocurrency CFDs are highly volatile, this can lead to potential large losses. Trading CFDs on crypto with leverage amplifies both profits and risks.
- Regulatory uncertainties: Due to their decentralised environment, the lack or sudden regulatory changes can create uncertainty, affecting market behavior and prices.
- Market vulnerability: The cryptocurrency CFD market is still young and evolving, making it prone to speculative bubbles and market manipulation.
- Lack of liquidity: Lower liquidity in certain cryptocurrency CFD can make it harder to execute trades without impacting the market price, leading to higher slippage.
Managing risk in cryptocurrency CFD trading
- Use stop-loss orders: Protect your capital by setting stop-loss orders to automatically exit trades at predefined levels and minimise losses.
- Control your leverage: Limit the amount of leverage used in your CFD trades to reduce the potential impact of adverse price movements.
- Diversify your portfolio: Spread your trades across different assets to avoid putting all your capital into a single cryptocurrency CFD.
- Start carefully: If you are a beginner, start trading with smaller positions to reduce exposure until you're more experienced.
- Research and stay informed: Keep up with the latest market news and trends to build your strategies accordingly.
Cryptocurrency CFD trading platforms
At Pepperstone, you can trade cryptocurrency CFDs on a range of cutting-edge trading platforms and enjoy ultra-fast execution speed.
TradingView
The platform offers powerful charting tools, real-time market data and access to the largest social trading network in the world. You can link your Pepperstone trading account directly to TradingView.
MetaTrader 5
As the more advanced version of MT4, MetaTrader 5 boasts exceptional performance and precision, equipped with several tools, indicators and advanced pending order functions. It also provides quicker processing times and supports position hedging.
MetaTrader 4
The most popular platform worldwide, provides access to live quotes, real-time charts, extensive news updates, and detailed analytics. MetaTrader 4 offers various order management tools, technical indicators, and expert advisors, making it ideal for traders of all levels.
cTrader
cTrader features a user-friendly interface with customisable presets and detachable charts for a personalised experience. It supports advanced order execution capabilities and custom coding using the C# programming language for those looking to automate their crypto CFD strategies.
The Pepperstone platform
Our native platform delivers secure and streamlined trading with razor-sharp spreads, industry-leading liquidity and efficient execution. Trade seamlessly between desktop and our intuitive mobile app.
How to get started with cryptocurrency CFD trading
If you're ready to start trading CFDs on cryptocurrency CFDs, follow these steps:
1. Open a cryptocurrency CFD trading account
Pepperstone offers all the tools you need to start trading crypto CFDs, including a demo account to help you practise risk free. Opening a live account can take a matter of minutes; once you provide the necessary details and your account is fully verified, deposit through various secure payment methods and start trading straight away.
2. Choose your tradable digital currency
Pepperstone gives you 24/7* access to Bitcoin, Bitcoin Cash, Litecoin, Ethereum, Ripple and more. Explore a range of educational resources, research tools, and analytical updates to sharpen your skills and enhance your trades.
3. Open your position
With crypto CFD trading, you can speculate on price movements by choosing either a 'buy' or 'sell' position on a digital currency. Before opening your trade, choose your order type and set key orders such as stop-loss and take-profit to manage your risk.
4. Monitor your CFD trades
Track all your open positions in real time using our advanced trading platforms. You have the flexibility to close your trades whenever you like.
As always, you need to do market analysis and develop your strategy before trading cryptocurrency CFDs. Depending on your risk appetite, you might start with smaller trades to gain some experience and then gradually increase your trading volume to your risk tolerance.
Interested in trading crypto CFDs with Pepperstone? Open an account with us today.
[disclaimers]:
*All crypto CFDs, with the exception of Dash, can be traded 7 days a week; please check the product information. Cryptocurrency CFDs such as Bitcoin are much more volatile than traditional currencies and carry significant risks. On Sundays, the markets close from 11:00 am to 1:00 pm for maintenance.