- English
- 中文版
A traders' week ahead playbook - a new leg lower coming in risk?

Key event risks to rock the markets this week:
- US Jan CPI (Friday 00:30 AEDT) – the market expects 7.3% YoY headline (economists’ range 7.6% to 7%) and 5.9% core
- Fed speakers – Bowman (Thursday 02:30 AEDT), Mester (Thursday 04:00 AEDT) and Barkin (Friday 11:00 AEDT)
- BoE speakers – BoE chief economists Huw Pill (Thursday 00:10 AEDT), BoE Gov Bailey (Friday 07:15 AEDT)
- ECB speakers – watching for speeches from ECB President Lagarde (Tuesday 02:45 AEDT) and ECB members Guindos, Villeroy, Lane and Elderson
- Australia – Governor Lowe testimony (Friday 09:30 AEDT)
- Canada – BoC Governor Macklem speaks (Thursday 04:00 AEDT)
- Inflation prints are also due for NOK, CHF, MXN, RUB
- AUS200 traders - 19% of the ASX200 market cap report earnings this week
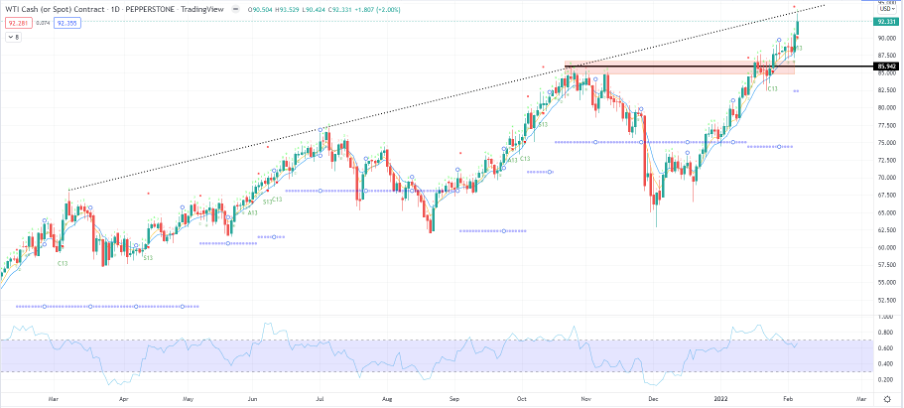
Play of the week – short SpotCrude for $86, stop at $95.00
A tactical play - A combination of trend resistance, the crude market closing higher for seven straight weeks and a Demark 13 count, showing exhaustion in the trend. I plan to keep position sizing light given the trend, although crude volatility is quite low (at 43%), which should allow for higher position sizing.

(Source: Tradingview - Past performance is not indicative of future performance.)
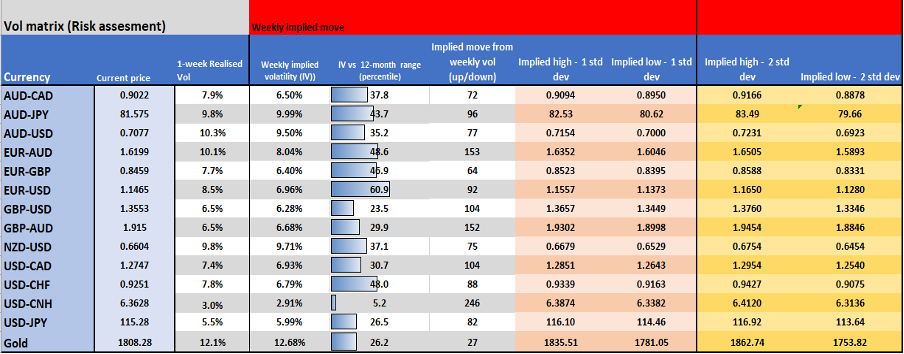
Margin FX and gold implied volatility matrix – using market levels of volatility and movement over the coming week and projecting to current spot prices to give a view on the expected range with a 68.2% and 95% level of confidence. Good for risk management or mean reversion trades.

(Source: Pepperstone - Past performance is not indicative of future performance.)
Sentiment and volatility
Equity market internals are not giving any glaring red flags, but they suggest equity is clearly vulnerable to another leg lower – 50% of S&P 500 companies are above their respective 200-day MA, 42% are above the 20-day MA, with 10% at 4-week lows.
Sector-wise, ultra-defensives such as utilities and staples continue to outperform. Flow-wise, banks are reporting extreme short covering of S&P 500 futures in the past week, which may have been the core driver of the 8.8% rally in the S&P500, while top of book liquidity in the futures market is very poor – a close back the 200-day MA (in the US500) would get me on notice for a renewed bear attack. The NAS100 trades below its 200-day MA.
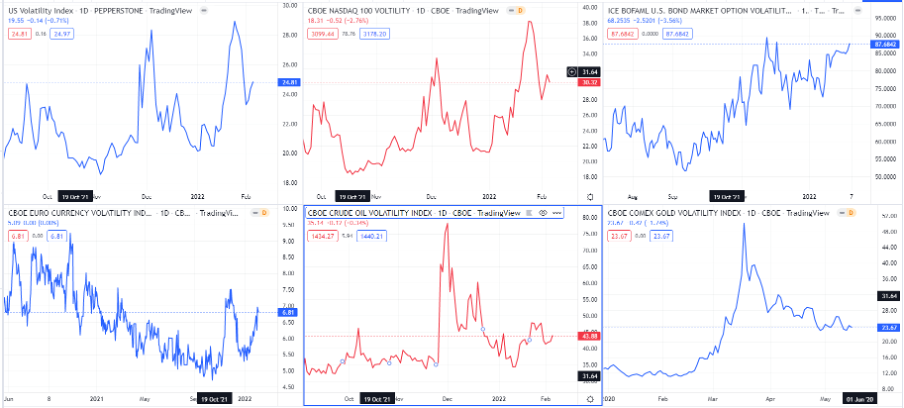
Implied volatility levels across asset class

(Source: Tradingview - Past performance is not indicative of future performance.)
The VIX index dropped to 23% on Friday, indicating 1.5% daily swings in the S&P 500 (on average over the coming 30 days). S&P500 volatility is realising at 19.6%, so if this pulls back towards 15% then new capital can come into share CFDs, but if this moves back above 20% and the VIX moves into the high 20’s then it will increase confidence to short equity markets.
What’s impacting my thoughts?
Firstly, if crude rolls over, which is where I see the balance of risk, I see this being a negative for broad market sentiment even if it may lower inflation fears.
I guess with US earnings fading as a catalyst (the big names have all reported), then that removes a potentially bullish catalyst. What could inspire? It must be lower inflation.
US CPI is therefore the marquee event risk and talk of inflation will be heard loud and clear this week. With the market now pricing a 36% chance of a 50bp (0.5%) hike from the Fed in March and 5.4 hikes by December, this inflation print could be key. The median estimate is for 7.3% YoY on headline, so if we see 7.4% and above then we could see US 2yr Treasuries really sell-off (yields higher) and head towards 1.35% – yield differentials are driving margin FX flows, so in this scenario, the USD will go strongly bid and I think equity will be hit hard.
A number at 7% or below should cause strong relief buying in risk assets and should see AUDUSD and NZDUSD work well to the upside – gold will also perform well.
In fact, given we saw US 10yr real (inflation-adjusted) trade 19bp higher last week – a massive move to close at the highest levels since June 2020 – and yet gold held $1800 tells a truly bullish story. If XAUUSD can hold a daily close above 1810 then I think we go on test the August 2020 downtrend again. I would have argued given the moves in bond markets that XAU should have fallen at least $50 last week, but it didn’t.
Once again, it’s going to be hard to look past the moves in both government and corporate bond markets this week. European bonds got smashed last week, with the ECB opening the door to hikes in 2022 – the market sees about 50bp or hikes this year (from the ECB) which seems far too rich, but it’s not often you see the German 2yr bond move from -60bp to -24bp in a week – that drove the EUR to outperform all currencies last week (ex-SEK), and why many think EURGBP and EURJPY can continue to rally.
With the US 10-yr Treasury now at 1.90% (the highest since January 2020), a break above 2% could lead to broad equity weakness. We’ll need a hot CPI print to get there, but the momentum trade has been to short bonds and many are now fearing higher bond yields will really start to bite in equity land.
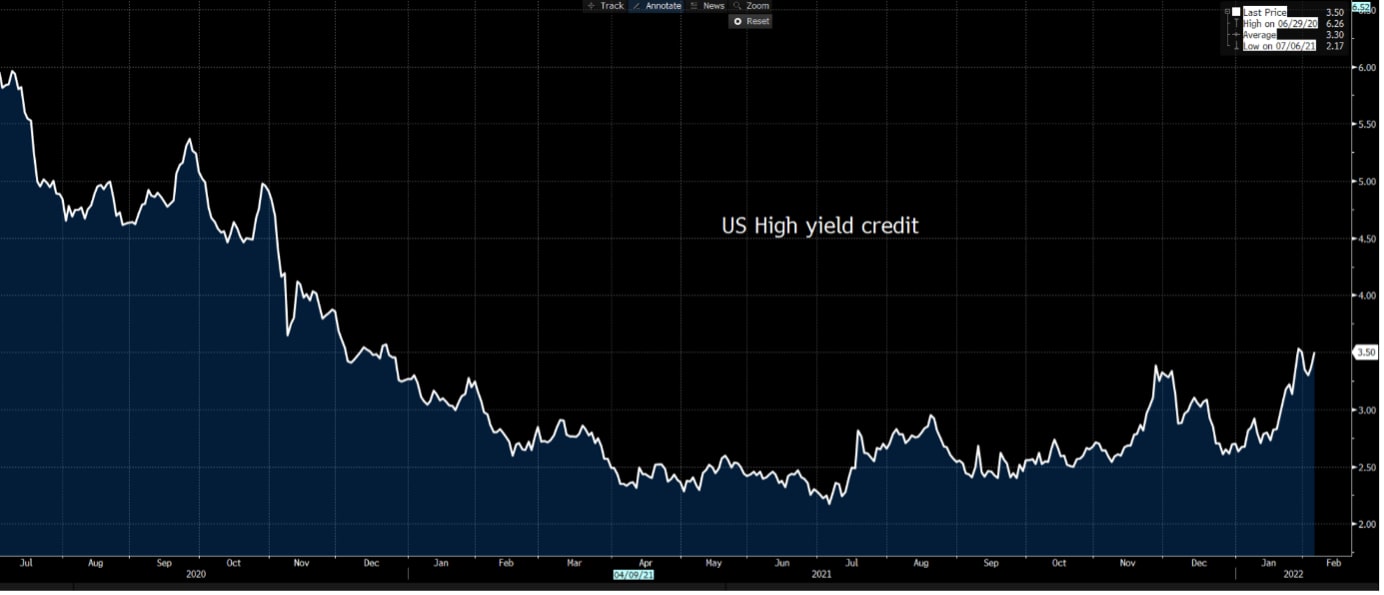
US high yield credit index

(Source: Bloomberg - Past performance is not indicative of future performance.)
High yield (HY) credit spreads are widening at an alarming pace too - notably on Friday where we saw a 14bp (or 0.14%) increase in HY credit but the S&P 500 rallied 0.5% – equity typically watches credit like a hawk and if credit metrics show it is becoming more expensive for corporates to access the debt markets, then the equity tends to be sold too. If the various high yield credit indices CFDs widen to new highs, again it will lead me to believe equities will fall this week and this should flow into out performance from the JPY.
We also see bond yield curves flattening out, showing short-dated bond yields moving higher more aggressively than longer-dated ones. While talk of inverted curves is still on the rise, this is not a great look for risk appetite.
Summary of plan
US CPI is the key focal point this week – however, with bond and credit markets on the move, it’s the reaction in bond markets that will dictate how equity and margin FX markets trade and if this move higher in both nominal and real rates continues then we could easily see another leg lower in equity markets, which could impact risk margin FX.
Related articles
Ready to trade?
It's quick and easy to get started. Apply in minutes with our simple application process.
The material provided here has not been prepared in accordance with legal requirements designed to promote the independence of investment research and as such is considered to be a marketing communication. Whilst it is not subject to any prohibition on dealing ahead of the dissemination of investment research we will not seek to take any advantage before providing it to our clients.
Pepperstone doesn’t represent that the material provided here is accurate, current or complete, and therefore shouldn’t be relied upon as such. The information, whether from a third party or not, isn’t to be considered as a recommendation; or an offer to buy or sell; or the solicitation of an offer to buy or sell any security, financial product or instrument; or to participate in any particular trading strategy. It does not take into account readers’ financial situation or investment objectives. We advise any readers of this content to seek their own advice. Without the approval of Pepperstone, reproduction or redistribution of this information isn’t permitted.
