- English
- 中文版
S&P 500 Sets New All-Time High
This performance is supported by U.S. economic data that exceeded expectations. In particular, durable goods orders remained unchanged, defying the expected correction, and jobless claims fell to their lowest level in several months. Additionally, second-quarter GDP growth was confirmed at a solid 3%, contributing to market optimism and supporting the record levels reached by the S&P 500.
Key Factors Behind the Record
The U.S. economic context has recently been favorable for the equity market. Weekly jobless claims unexpectedly fell to 218,000, marking a new four-month low. This figure, following the aggressive start of monetary policy normalization by the Fed, alongside second-quarter GDP confirmed at 3%, has strengthened the narrative of an economy that, while facing some challenges, continues to show resilience. These indicators have generated a positive market reaction, easing concerns about a more pronounced slowdown in economic growth.
Additionally, the Chinese Central Bank has also played a significant role by implementing a series of aggressive stimulus measures, the largest since the pandemic, in an effort to revitalize its economy amid deflationary pressures. The measures announced earlier this week included cuts in interest rates and reserve requirements, which injected confidence into global markets. Although these measures have been criticized by some analysts, the general sentiment has been positive, contributing to risk appetite for assets such as stocks.
Expectations and Risks Ahead
Despite the current optimism, there are risk factors that could affect the trajectory of markets in the coming weeks. One of the key events to watch will be the release of September’s U.S. labor data, with the nonfarm payroll (NFP) report scheduled for next week. The Federal Reserve (Fed) has focused its attention mainly on the labor market, and the evolution of these figures will be crucial in determining the next step in its monetary policy.
The Fed's focus on employment data could bring back volatility factors soon, as any significant deviation from expectations could influence monetary policy decisions. Additionally, the start of the fourth quarter will mark the beginning of a new earnings season, a key period to assess whether the current record-high stock valuations are justified by corporate results
Expectations for corporate earnings growth have diminished, with projections pointing to 5% earnings per share (EPS) growth for S&P 500 companies in the third quarter of 2024, down from 12% in the second quarter. This adjustment reflects a moderation in expectations as companies continue to navigate an environment of higher operating costs and still-elevated interest rates.
S&P 500 Technical Analysis
Monthly Chart S&P 500
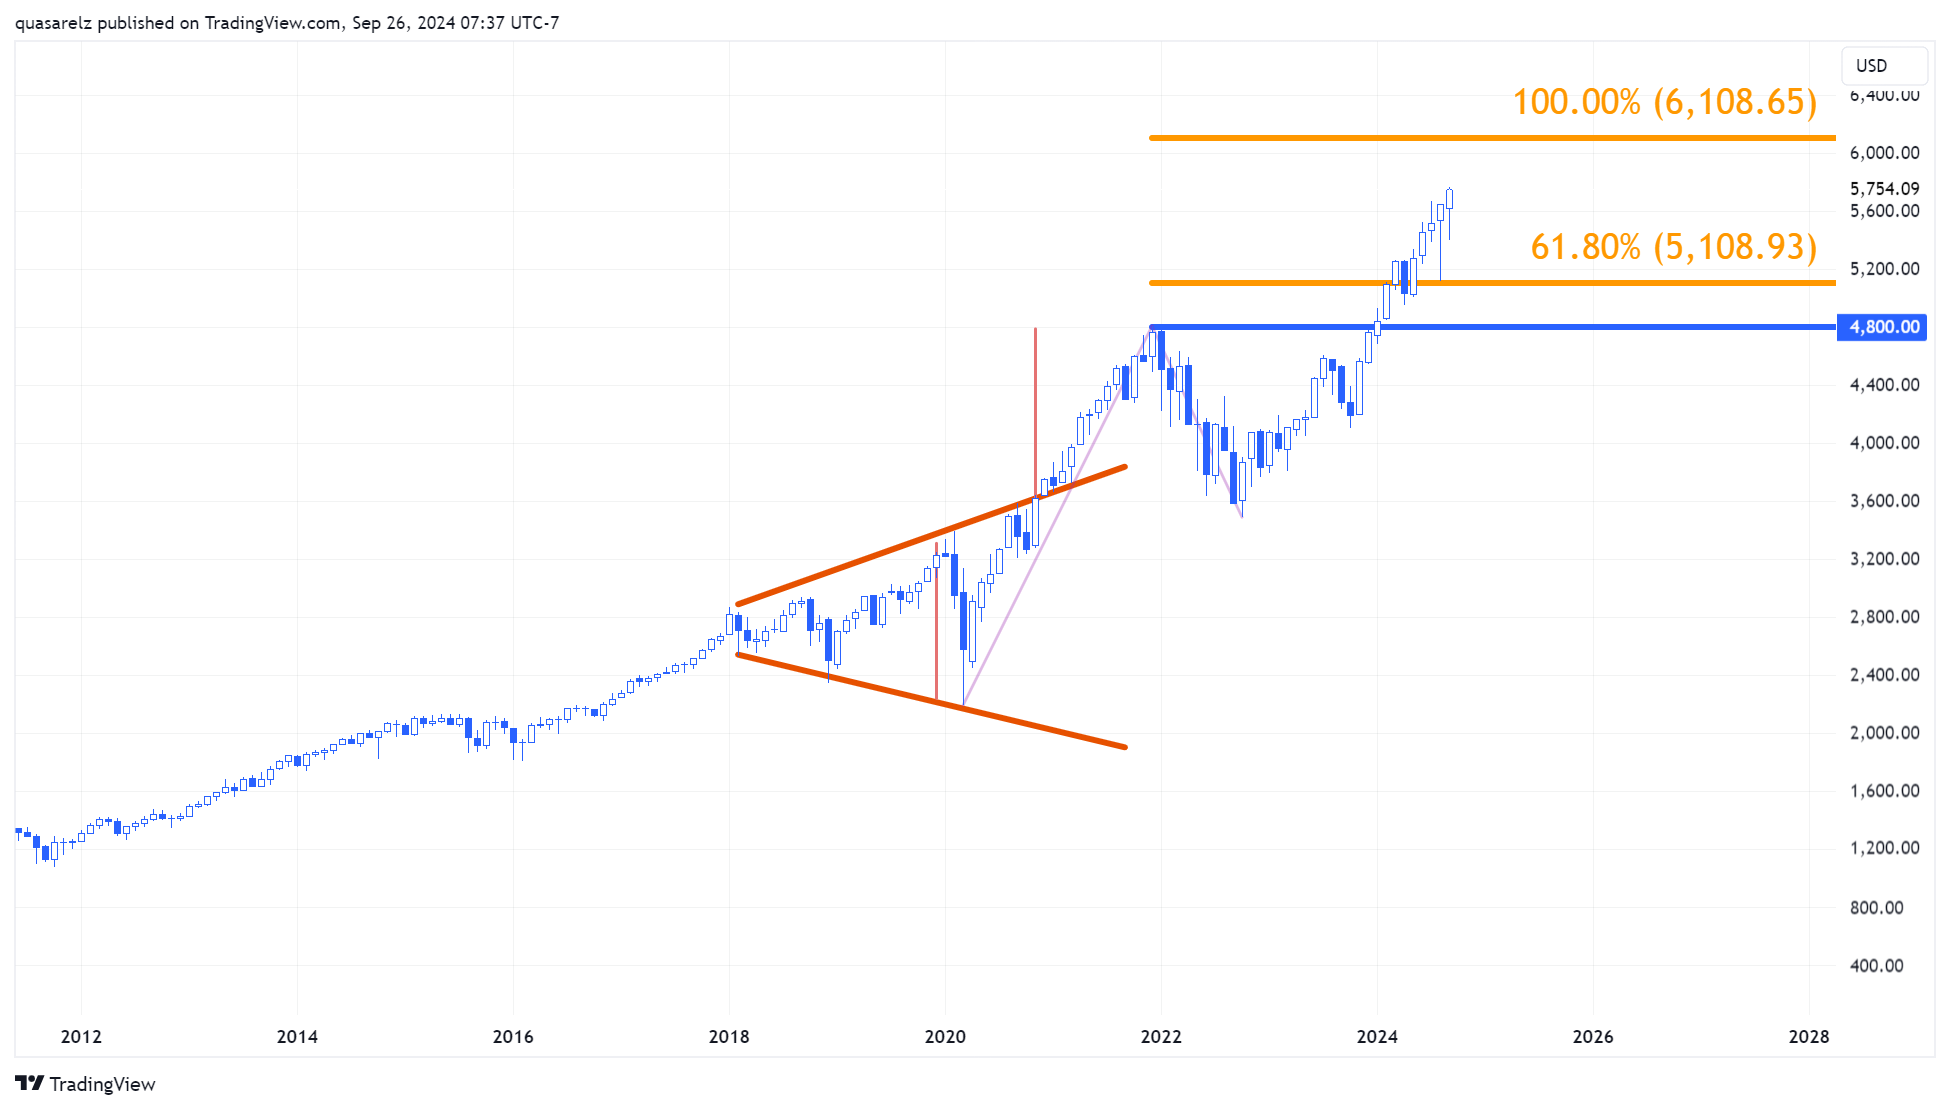
From a broader perspective, the outlook remains predominantly bullish, with the next long-term target located at the 100% expansion level of the previous upward structure, starting from the 2020 lows and the 2022 correction. It is worth noting that within this profile, the key psychological level of 6000 points should also be considered as an intermediate target.
Weekly Chart S&P 500
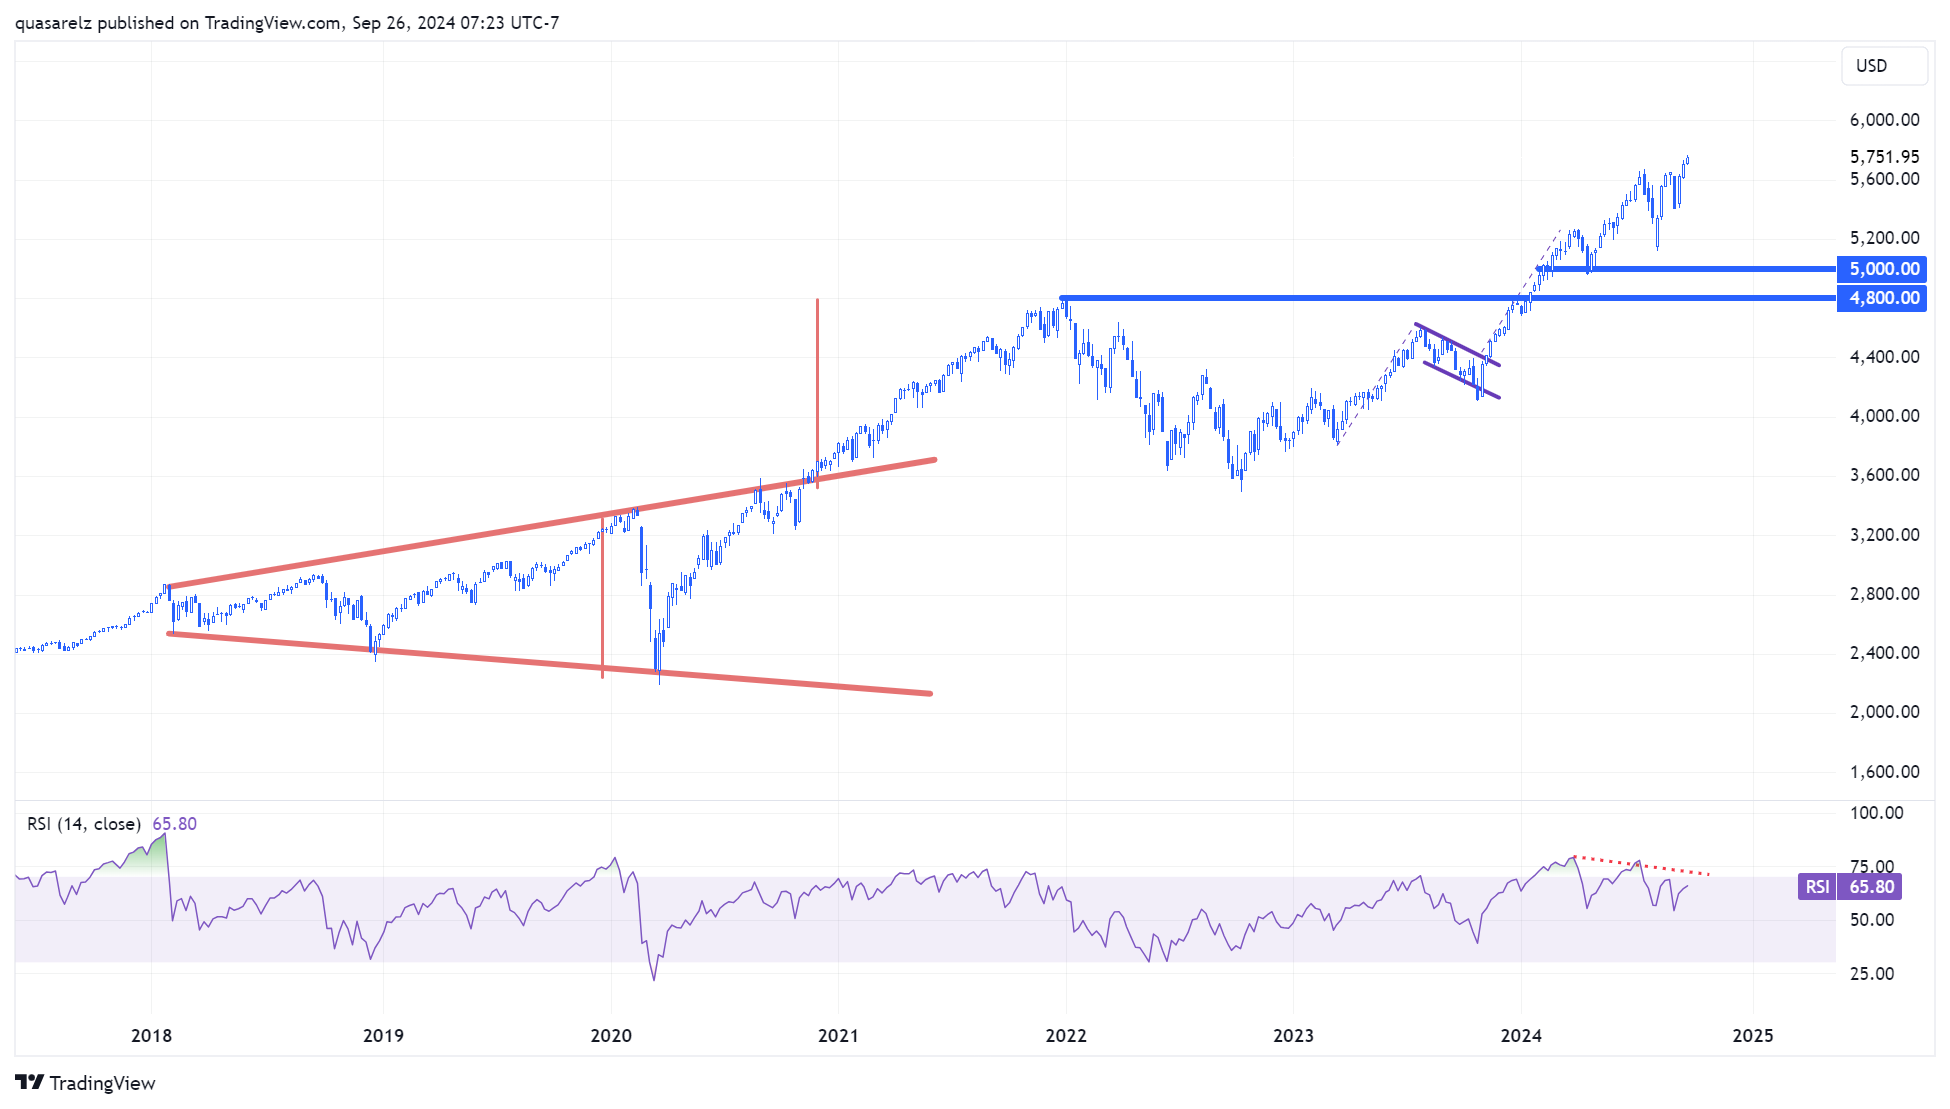
However, on the weekly chart, there are signs that the recent bullish moves may be somewhat extended and losing momentum; this is indicated by a possible negative divergence forming between the RSI and price action as new all-time highs are made. This could lead to some form of correction, which I personally believe could offer buying opportunities in line with the broader bullish outlook.
Conclusion
The new record for the S&P 500 reflects an economic and market environment that, while facing challenges, remains favorable for risk assets. Support from positive economic data and external stimuli, such as those from China, has been key to this rise. However, upcoming labor data and the earnings season will be crucial in determining the sustainability of this trend.
While expectations for earnings growth have moderated, markets seem confident that the resilience of the U.S. economy will allow stocks to continue advancing.
Ready to trade?
It's quick and easy to get started. Apply in minutes with our simple application process.
The material provided here has not been prepared in accordance with legal requirements designed to promote the independence of investment research and as such is considered to be a marketing communication. Whilst it is not subject to any prohibition on dealing ahead of the dissemination of investment research we will not seek to take any advantage before providing it to our clients.
Pepperstone doesn’t represent that the material provided here is accurate, current or complete, and therefore shouldn’t be relied upon as such. The information, whether from a third party or not, isn’t to be considered as a recommendation; or an offer to buy or sell; or the solicitation of an offer to buy or sell any security, financial product or instrument; or to participate in any particular trading strategy. It does not take into account readers’ financial situation or investment objectives. We advise any readers of this content to seek their own advice. Without the approval of Pepperstone, reproduction or redistribution of this information isn’t permitted.