- English
- 中文版
S&P500 melt up - has the seasonal rally just kicked into gear?

On the day we see the US500 cash closing +1.4% and above 4000, taking the bear market rally to 14.6% from the 13 Oct low.
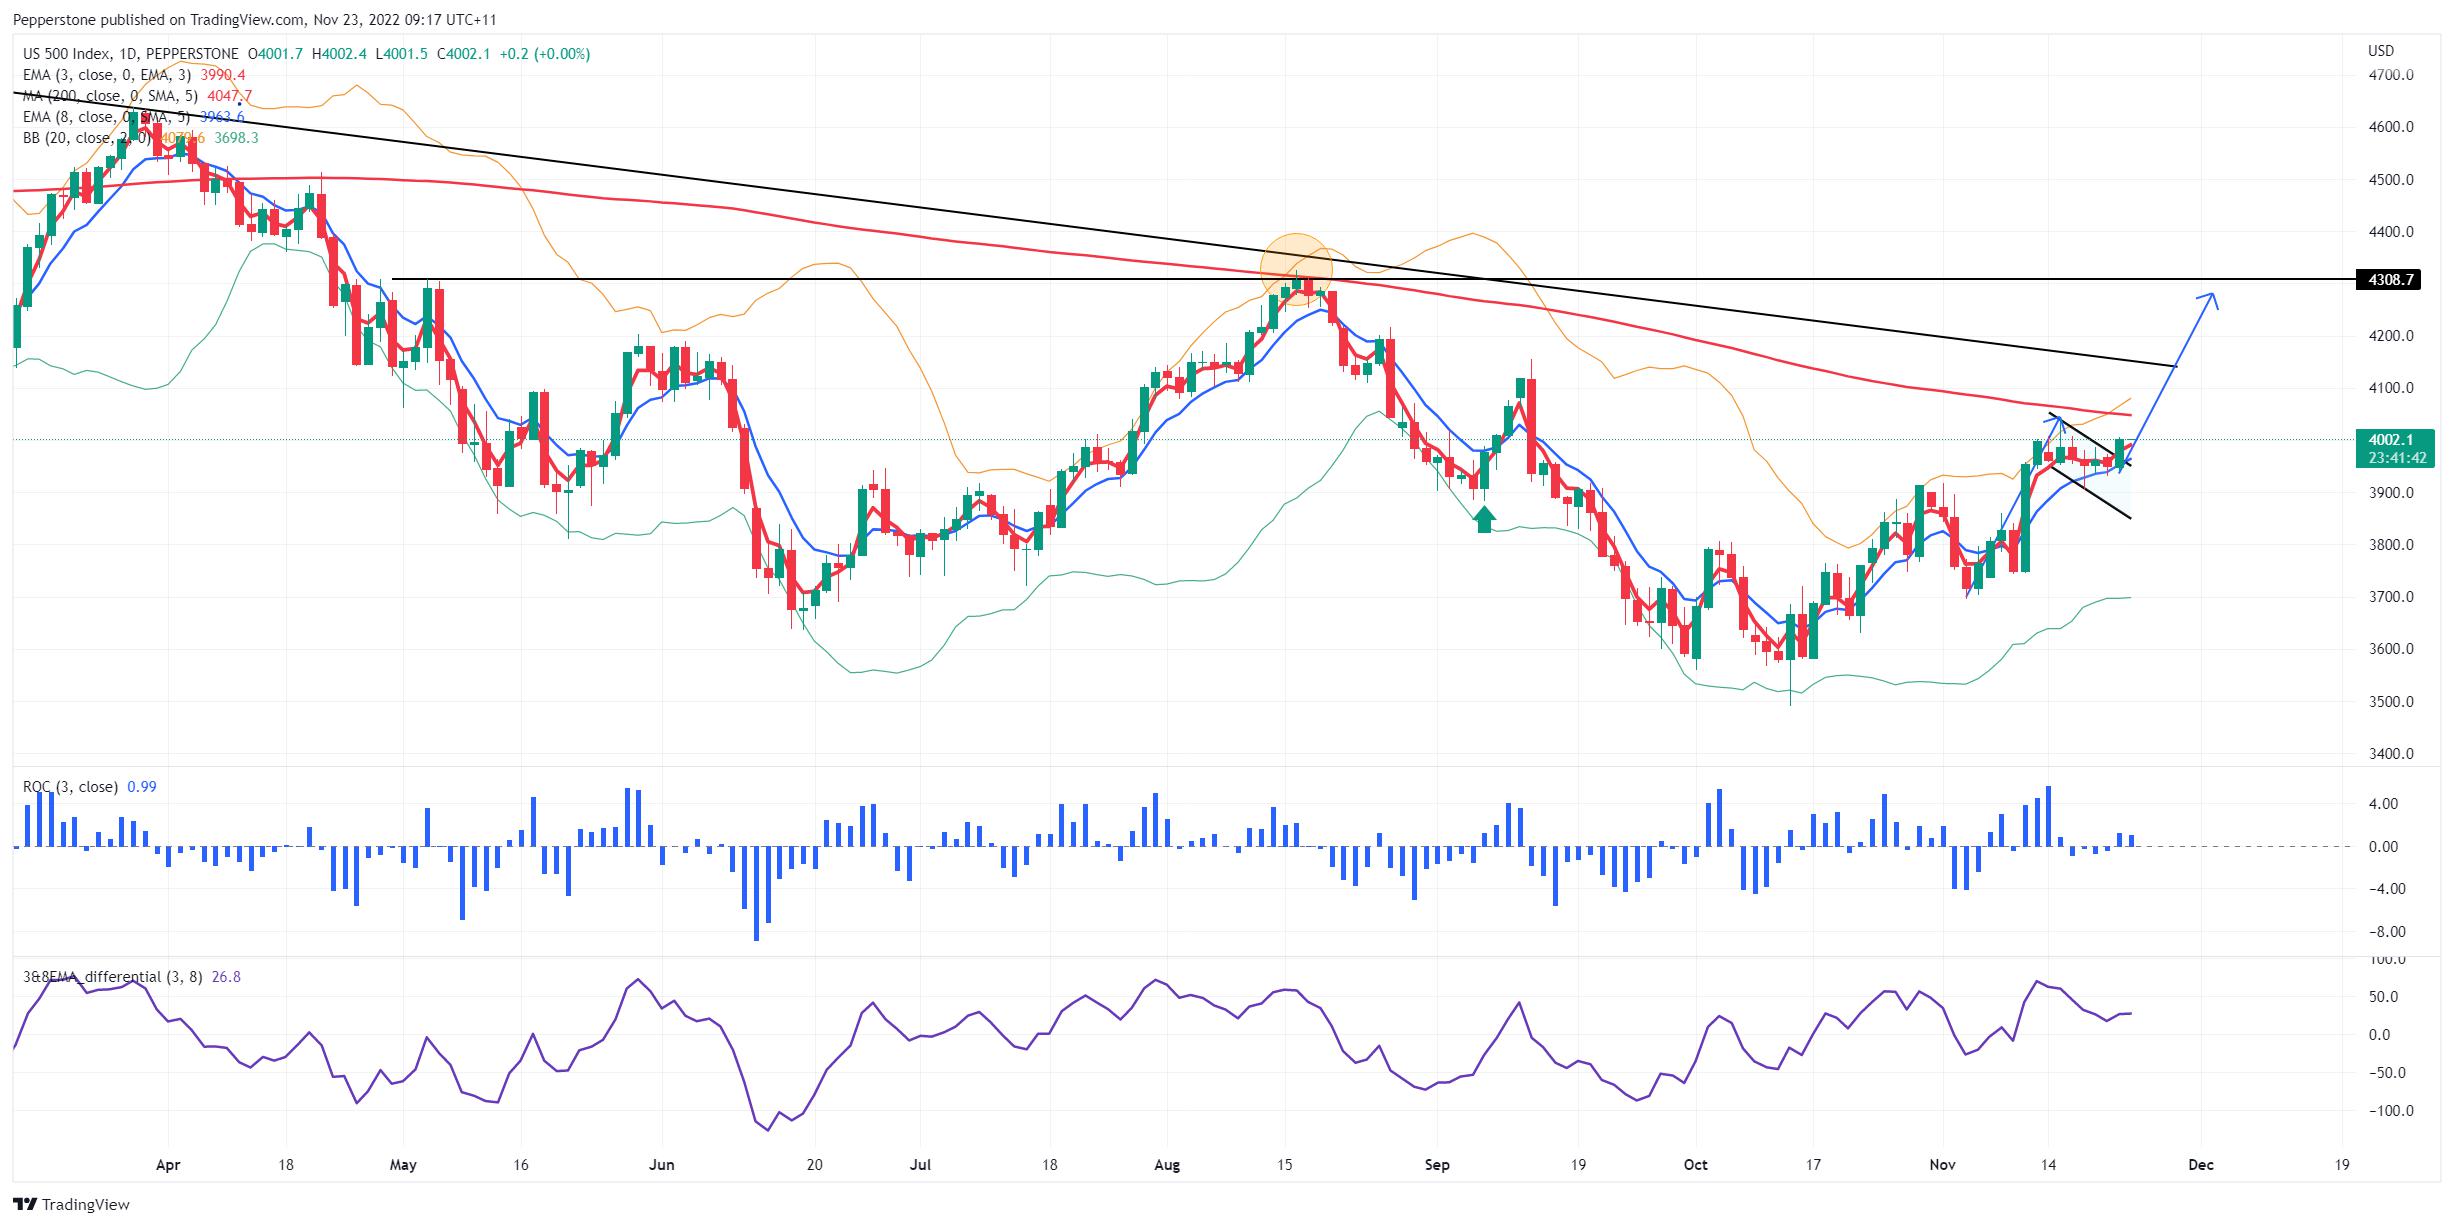
(US500 daily chart)
All sectors rallied with energy the best performer gaining 3.2% - breadth was broad at a stock level and we see 89% of stocks in the index closing higher – hard to paint a more bullish picture. Not sure we can fault the intra-day tape either - it was an out and out trend day and as soon as price smashed through VWAP in European trade, retested and found buyers, it was all uphill with a solid melt-up into the close.
Of course, we have a World Cup underway, and a bunch of traders took time out here, where we see S&P500 futures volume an anaemic 1.1m contracts, while cash volumes were 26% below the 30-day average. As anyone who was long and held through US trade would attest – you can still make money in a low-volume environment.
Has the rally got legs?
One prominent strategist who has called the US500 well throughout 2022 is Mike Wilson (of Morgan Stanley) who has pulled out his playbook, calling for the US500 to rally to 4100-4300 by year-end – however, once we get past the turn his call is that the index retreats to a range of 3300 to 3000 by end Q1, before staging a solid rally into the end-2023. It's not often we see such definition from a sell-side strategist and it's gutsy – his logic is sound but what the market does is another thing.
The technicals favour further upside
If we look at the setup of the US500 on the daily a long bias is certainly the favoured position. Naturally if the flow and structure change and become more bearish, we do something about it quickly – as traders we react to signal, or it costs.
Importantly, we’ve seen price break out of the bull flag, which if we take the move from the 3 Nov low targets 4280.
We have the 200-day MA lurking at 4050, and while we saw price reject this average in April and mid-August, a bullish break here could see further longs being added – certainly, the systematic trend traders would be adding to a modestly long position, and this could propel the index into trend resistance.
Consider the idea of FOMO and FOMU (fear of meaningfully underperforming) – the S&P500 is -16% and if youre an active money manager and benchmark to the index and the index is going up then you simply have to put cash to work and chase – or you risk underperforming and not getting paid.
We know there is a ton of cash on the sidelines. A VIX testing 20% is also a bullish sign for risk.
A stop that keeps you in the trade - If we use a simple 3 and 8-day EMA crossover stop, then longs are still in play, and this can keep you in the trade and remove the emotion of taking profits in a strong trending environment.
So, one to watch – while volumes are low and we eye huge data in December, the melt-up in equities is starting to take shape.
Related articles


The material provided here has not been prepared in accordance with legal requirements designed to promote the independence of investment research and as such is considered to be a marketing communication. Whilst it is not subject to any prohibition on dealing ahead of the dissemination of investment research we will not seek to take any advantage before providing it to our clients.
Pepperstone doesn’t represent that the material provided here is accurate, current or complete, and therefore shouldn’t be relied upon as such. The information, whether from a third party or not, isn’t to be considered as a recommendation; or an offer to buy or sell; or the solicitation of an offer to buy or sell any security, financial product or instrument; or to participate in any particular trading strategy. It does not take into account readers’ financial situation or investment objectives. We advise any readers of this content to seek their own advice. Without the approval of Pepperstone, reproduction or redistribution of this information isn’t permitted.