- English
- 中文版

It’s hard to say the data had any meaningful effect on cross-market movement, as the tape we saw across the market was whippy, to say the least – the change in flows meant traders had reacted dynamically and aggressively to intraday swings and reversals. Volatility (vol) can be a welcomed development for many trading strategies, but changes in vol and intraday movement mean evolving one’s time in the market, as it does with one’s approach to risk and position size.
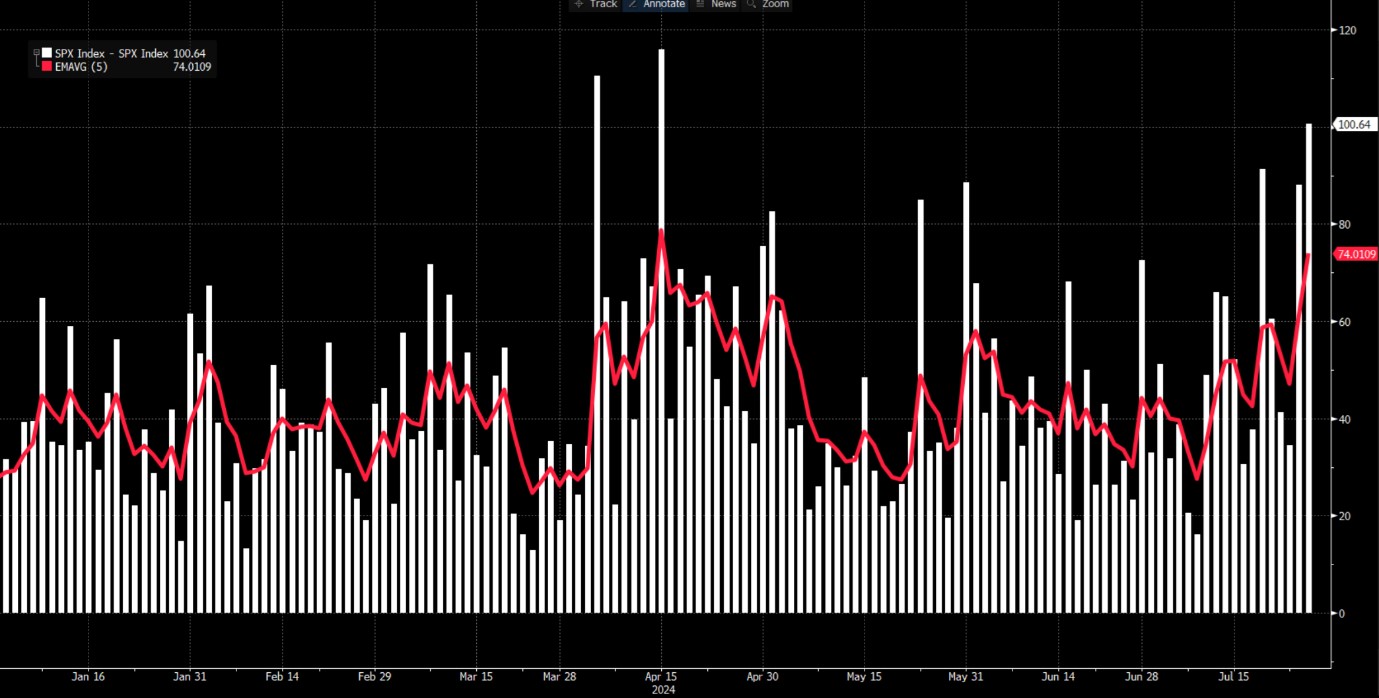
In US equity, the S&P500 initially traded lower in US cash trade, pulling to 5390, where it was looking like we could see another trend day lower and a full bearish tape. However, the buyers stepped in hard, and pushed equity higher, with the index peaking at 5491 – a full 100-point high-low range is the third largest of the year, so one would assume that liquidity conditions are changing, although, we’re not seeing that in S&P500 futures bid-offer spread, which remains tight.
S&P500 high-low daily trading range
The buy-the-dip crowd were momentarily back, and certainly, this is true in small caps, where the Russell 2k closed +1.3%. Any positivity at an index level in the S&P500 and NAS100 soon soured though, and the flows turned more towards the sell side, with equity and index implied volatility picking up, with traders using the move higher for exit liquidity and selling into the move for a reversal lower into the close.
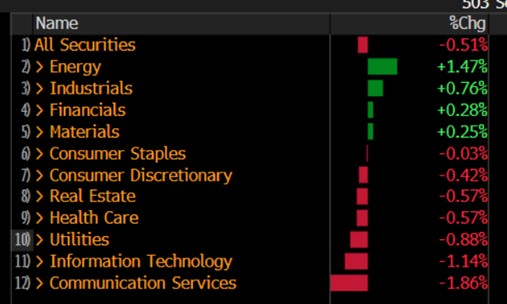
Again, consumer services and tech equity names received the lion’s share of attention, where notably we saw Microsoft, Alphabet and Nvidia taking out index points, with many pointing to news that OpenAI is testing its own search called SearchGPT. The NAS100 closed -1.1%, while the S&P500 closed -0.5%. Rotation was the theme yet again, with the S&P500 energy sector +1.5%, somewhat outpacing the +0.7% rise seen in crude. Industrials, financials, and materials also found love, showing funds switched from growth to value once more.
S&P500 sector performance
So, a small win for the bears it seems, and notably with S&P500 futures closing below the 50-day MA. We should also consider that next week we do get earnings from Microsoft, Meta, Apple, QCOM, Amazon, and Intel, so some heavyweights reporting earnings could calm sentiment and lift markets, or conversely, add to the progressively bearish trend.
Outside of equity, we saw some buying in the long-end of the US Treasury curve, with UST 10s -4bp to 4.24%. The real moves took place in gold and silver, with gold losing $33 (or 1.4%) with buyers stepping in at the 50-day MA. Crypto has also seen some good flow, with Ethereum getting close attention with price falling 6.6% and closing below the 200-day MA, with sellers eyeing a re-test of the 3000 level, which found good buying interest in early July.
In FX, the JPY continues to get real interest from traders, with AUDJPY and NZDJPY seeing some big moves, and a sizeable intraday reversal off grossly oversold levels. The PBoC cutting the 1-yr Medium-Term Lending (MLF) rate by 20bp to 2.3% may help sentiment towards China today, so any turn higher in China equity and copper, could see traders lighten up further on AUD and NZD shorts.
USDJPY tested horizontal support at 151.85 almost to the point but has since bounced hard into 154. The JPY may get further focus today with Japan (Tokyo) CPI due at 09:30 AEST, where the outcome may play into expectations for next week’s BoJ meeting – that meeting is an interesting set-up, with the bulk of economists seeing the BoJ leaving rates unchanged at 0.1%, however, the distribution in policy calls is quite dispersed with one house calling for a 20bp hike. We’ll see if today's JP CPI data alters expectations for policy action next week and if there is any effect on the JPY.
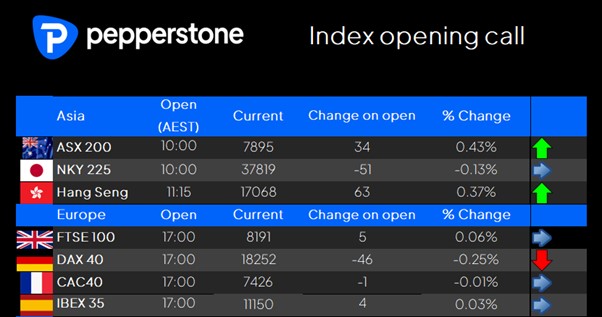
Tuning to Asia, our opening calls are looking mixed with the ASX200 eyed +0.4% at 7895, the HK50 should also unwind +0.4%, while the NKY225 remains skewed lower, with the index posed to take out the former range lows seen between April and June. Strange things can happen on Fridays, where increased selloffs or rallies can form out of nowhere – an open mind and a willingness to react to the tape will serve traders well.
Good luck to all,
The material provided here has not been prepared in accordance with legal requirements designed to promote the independence of investment research and as such is considered to be a marketing communication. Whilst it is not subject to any prohibition on dealing ahead of the dissemination of investment research we will not seek to take any advantage before providing it to our clients.
Pepperstone doesn’t represent that the material provided here is accurate, current or complete, and therefore shouldn’t be relied upon as such. The information, whether from a third party or not, isn’t to be considered as a recommendation; or an offer to buy or sell; or the solicitation of an offer to buy or sell any security, financial product or instrument; or to participate in any particular trading strategy. It does not take into account readers’ financial situation or investment objectives. We advise any readers of this content to seek their own advice. Without the approval of Pepperstone, reproduction or redistribution of this information isn’t permitted.