- English
- 中文版
US Interest Rate Pricing: Calculating & Quantifying Market Expectations for Fed Policy

Using CME’s FedWatch Tool for Short-Term Policy Expectations For a quick snapshot of market expectations around the next FOMC meeting, the CME FedWatch Tool (link here) is a useful starting point. It converts pricing in Fed funds futures into probabilities of different rate outcomes, showing the distribution of expectations for the upcoming Fed decision.
Interest Rate Futures: The Core of Market Pricing
A more detailed way to analyse “what is priced in” comes from interest rate futures pricing. These contracts—alongside interest rate swaps (IRS)—allow corporates to hedge interest rate risk and give speculators a liquid market to express views on the Fed’s future policy stance. While TradingView does not display swap rates, it does provide live pricing on both SOFR 3-month futures and Fed funds futures. Between the two, SOFR futures are the preferred instrument for most traders, as they are:
• More liquid (especially in further-dated maturities out to 2026–2027)
• More actively traded than Fed funds futures
• Considered the benchmark contract for dollar rate expectations
What Is SOFR and Why Does It Matter?
The Secured Overnight Financing Rate (SOFR) is the benchmark overnight risk-free rate in US dollars. It is based on the volume-weighted median of overnight Treasury repo transactions, representing the cost for financial institutions to borrow cash against US Treasuries. The Federal Reserve anchors SOFR through its monetary policy corridor:
• Upper bound = Interest on Reserve Balances (IORB), currently 4.25%
• Lower bound = Overnight Reverse Repo Facility (ON RRP), currently 4.00% SOFR is therefore one of the most critical rates in global finance, influencing the entire US Treasury curve, the US dollar, and cross-asset flows.
How SOFR Futures Work
SOFR 3-month futures reflect the market’s expectations for the average compounded SOFR rate over a future three-month accrual period.
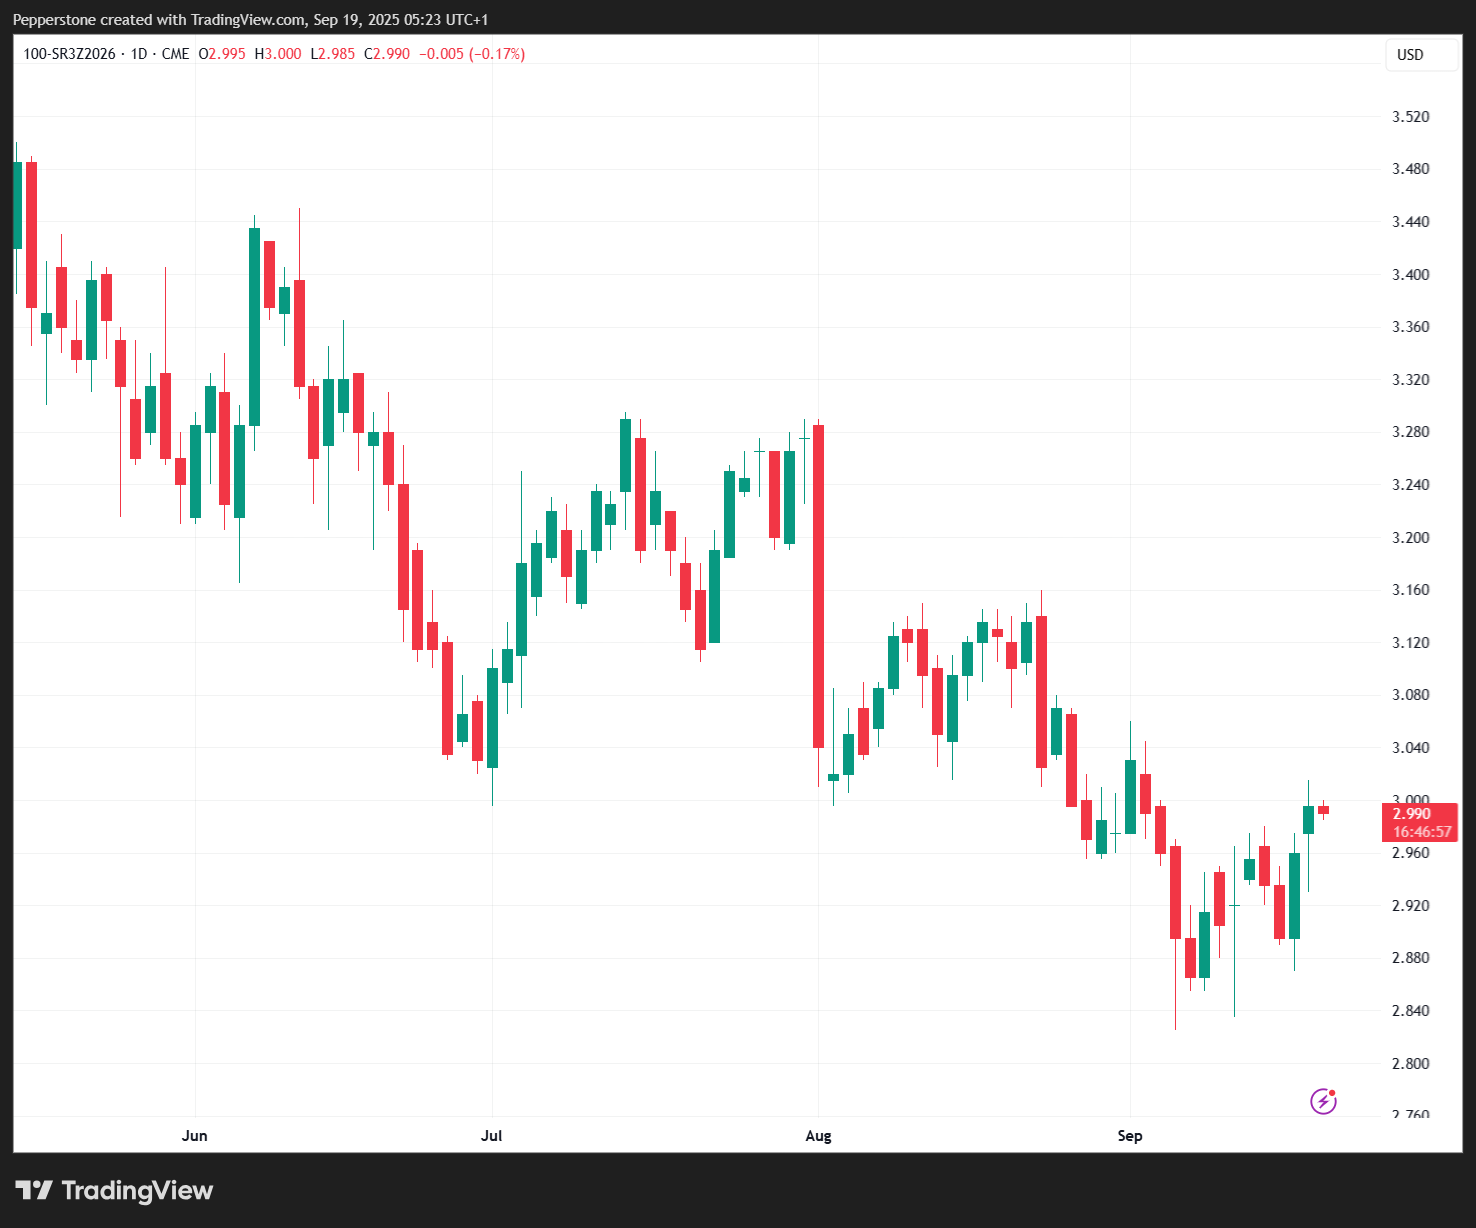
For example:
• The December 2026 contract (SR3Z2026) represents expected SOFR between the December 2026 IMM date (3rd Wednesday of December) and the March 2027 IMM date (3rd Wednesday of March).
• It settles in cash on 16 March 2027 at a price of 100 minus the compounded SOFR rate realised over that period. Example: If SR3Z2026 trades at 97.01, the implied rate is: 100 – 97.01 = 2.99% With the current spot SOFR rate at 4.38%, this means the market is pricing 139 basis points of Fed rate cuts between now and early 2027.
Building a SOFR Futures Curve on TradingView
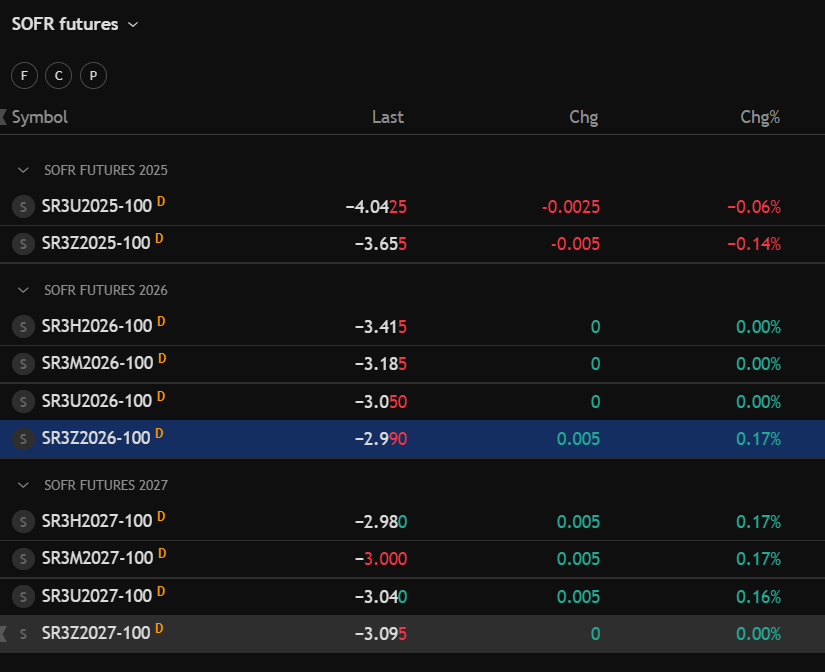
Traders can easily build a SOFR futures watchlist on TradingView, lining up contracts by expiry (e.g., SR3U2025 for September 2025, SR3Z2026 for December 2026). Looking at the curve allows you to identify the market’s perception of the terminal rate—the lowest point in the Fed’s cutting cycle. As of now, the December 2026 contract shows an implied rate of 2.99%, suggesting the market believes the Fed will not need to cut much below 3%.
Why This Matters for Traders Across All Asset Classes
1. Fed policy expectations drive global markets – The US dollar, Treasury yields, equities, and even gold often move in line with—or inversely to—shifts in rate futures pricing.
2. Event risk management – If a rate cut is fully priced in, the actual cut may spark little market reaction. Conversely, a surprise cut when the market has priced minimal easing can trigger outsized moves in USD and US 2-year yields.
3. Recession risk insight – If the market prices the terminal rate close to the Fed’s assumed neutral rate (say ~3%), it implies low recession risk. A deeper cut priced below 2.5% would signal the market expects a harder landing.
Key Takeaways:
How to Read What’s Priced In
• Use the FedWatch tool for near-term meeting probabilities.
• Watch SOFR 3-month futures for the market’s forward-looking view of Fed policy.
• Remember: Price = 100 – implied rate.
• Build a SOFR futures curve to see where markets expect the terminal rate.
• Apply this knowledge across FX, Treasuries, equities, and commodities to manage risk and capture opportunity.
Good luck to all.
The material provided here has not been prepared in accordance with legal requirements designed to promote the independence of investment research and as such is considered to be a marketing communication. Whilst it is not subject to any prohibition on dealing ahead of the dissemination of investment research we will not seek to take any advantage before providing it to our clients.
Pepperstone doesn’t represent that the material provided here is accurate, current or complete, and therefore shouldn’t be relied upon as such. The information, whether from a third party or not, isn’t to be considered as a recommendation; or an offer to buy or sell; or the solicitation of an offer to buy or sell any security, financial product or instrument; or to participate in any particular trading strategy. It does not take into account readers’ financial situation or investment objectives. We advise any readers of this content to seek their own advice. Without the approval of Pepperstone, reproduction or redistribution of this information isn’t permitted.