- English
- 中文版

The break to new highs saw the Aussie equity index gain 1.8% on the week, outperforming the lion’s share of major equity indices, and the fact it is a slower moving (beta) market makes that move even more impressive.
So where to from here?
The playbook:
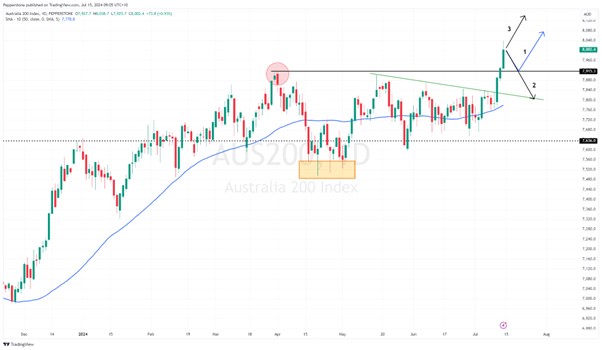
Scenario 1 – A retest to confirm support
Technically we’re now in blue sky/breakout territory - a retracement to the former breakout highs of 7916/7900, to confirm if the bulls support these levels and set a new platform for a renewed push higher would be a clear bullish development.
Scenario 2 – A failed break
Should we see a retest but a failure to hold these former breakout levels could be just as powerful a signal and suggest the bears have wrestled back control putting the probability of a move back to 7800 on the table.
Scenario 3 – Price kicks higher
Conversely, the index could kick higher– so a daily close above 8000 could be a signal for more momentum-focused traders to add to longs. It’s hard to short an index that is making higher highs, and the sellers would be happy to sell at higher levels. As to potential targets, one could look at Fibonacci extensions or even adopt a more systematic approach and hold long positions until say price closes below the 5-day EMA, or we see a 3- to 9-day MA crossover.
Valuation matters for an index which is defined as a ‘value’ index – that is, the ASX200 has a big weighting of stocks considered to be ‘value’ plays – sectors such as financials, materials and energy.
These sectors perhaps lack the earnings growth of the tech plays, but have more predictable cash flows, trade on a lower PE multiple and often pay out higher levels of income (i.e. a higher dividend yield).
The ASX200 is one of the most prominent ‘value’ in developed equity markets, so when investors rebalance their portfolios towards value over growth, then the ASX200 typically outperforms – which is what we have been seeing of late. When growth is the dominant theme, then the ASX200 takes a backseat to say the high-flying NAS100.
The current analyst’s consensus has the ASX200 expected forward price to earnings (PE) multiple at 17.4x, which is starting to look rich and at the highest since Jan 2022, but perhaps not at such extreme levels which suggest an imminent collapse.
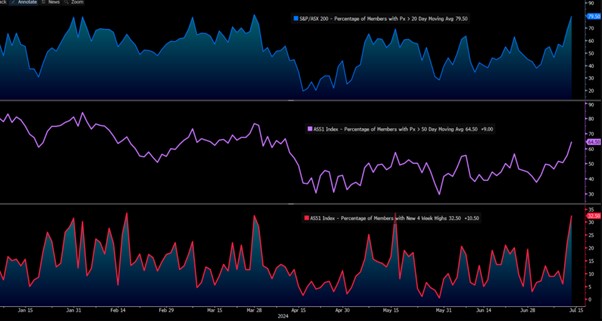
We can also see good participation in the rally, with 32% of ASX200 companies at a 4-week high, and 80% of stocks above the 20-day moving average. Good participation suggests that the rally has been of a higher quality.
Sector moves since 27 June
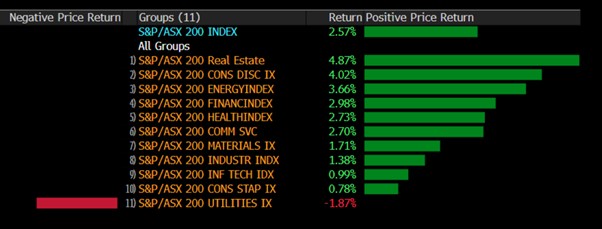
Sector-wise, and since the rally began on 26 June, we see all sectors except utilities moving higher, with REITS, consumer discretionary, energy and financials putting in the points. ASX200 banks look exceeding strong, and given their significant weighting on the index, until the big four banks roll over and head lower, one suspects the AUS200 will find pullbacks to be shallow.
So the question for today is whether we can hold and even build on 8000 – investors need to commit to value areas of the equity market to see outperformance vs other global indices, but the momentum is there, and the playbook is set.
The material provided here has not been prepared in accordance with legal requirements designed to promote the independence of investment research and as such is considered to be a marketing communication. Whilst it is not subject to any prohibition on dealing ahead of the dissemination of investment research we will not seek to take any advantage before providing it to our clients.
Pepperstone doesn’t represent that the material provided here is accurate, current or complete, and therefore shouldn’t be relied upon as such. The information, whether from a third party or not, isn’t to be considered as a recommendation; or an offer to buy or sell; or the solicitation of an offer to buy or sell any security, financial product or instrument; or to participate in any particular trading strategy. It does not take into account readers’ financial situation or investment objectives. We advise any readers of this content to seek their own advice. Without the approval of Pepperstone, reproduction or redistribution of this information isn’t permitted.