- English
- 中文版

In US equity market volatility, the VIX index has averaged 15.4% throughout 2024, well below the 5-year average of 21.3%. In 2024 the S&P500 saw a max drawdown of 9.7%, lasting just 14 days (in early August), with a max drawdown of just 3% in Q4.
Remarkably, we’ve seen just three occurrences in 2024 where the S&P500 fell by 2% on the day.
Reviewing cross-asset volatility through 2024 we can see that the 40-day realised volatility across key markets has been universally lower than the 5-year average.
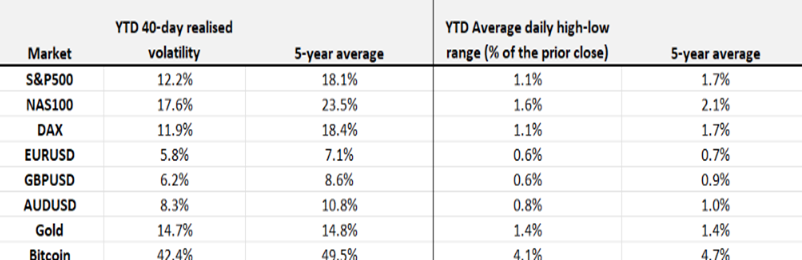
Another way to conceptualize movement in a market is by measuring a market’s average daily high-low trading range. In the table, we highlight the YTD average high-low trading ranges (in these same key markets) and work that figure as a percentage of the prior day’s closing level. Again, we see that the daily percentage high-low ranges are well below the 5-year average.
We can review the macro environment through 2024 and consider the possible reasons for the lower cross-market volatility. Here are some that immediately come to mind:
• A strong commitment from the Fed to cut rates on any signs of fragility in the labour market – the ‘Fed Put’ has been alive and well.
• With an absence of any major shocks to the system, traders have been happy to sell volatility and reduce portfolio hedges with risky assets finding buyers on minimal drawdown, with the S&P500 printing new all-time highs time and time again.
• It's not just the Fed who have cut rates, but the majority of G10 central banks have universally taken their policy setting out of a highly restrictive stance.
• US economic data has not only been resilient but for most of 2024, it has been impressive, with periodic calls for an impending recession quickly silenced.
• The right-tail (inflation) risk has largely moved as central banks would have hoped. Granted, service-side inflation has been frustratingly sticky in many developed economies, but the reduced pace of price pressures throughout 2024 has been a factor in reducing market volatility.
• Geopolitical concerns have been short lived with the market rarely seeing any risk of an energy supply shock.
Looking ahead: The potential volatility catalysts for higher volatility in Q125 and beyond
No one knows how our trading environment will evolve in Q125, and the level of volatility, range expansion or trending conditions that will be placed in front of us. However, the backdrop is certainly in place to believe that there is a high probability of increased volatility ahead in markets. With the potential catalysts laid out below, traders should prepare to react should we move into a sustainable higher vol regime, and to effectively manage the risk that comes with higher vol and look to capitalize on the opportunities should it play out.
Catalysts for higher volatility in Q125:
• Seasonals, Positioning and Valuation
• The Implementation of Trade Tariffs
• US Economic Data Trends
• Fed Rate Cuts: Moving closer to the End
• China may not be ‘investible’ but it’s certainly tradeable
Seasonals, Positioning and Valuation
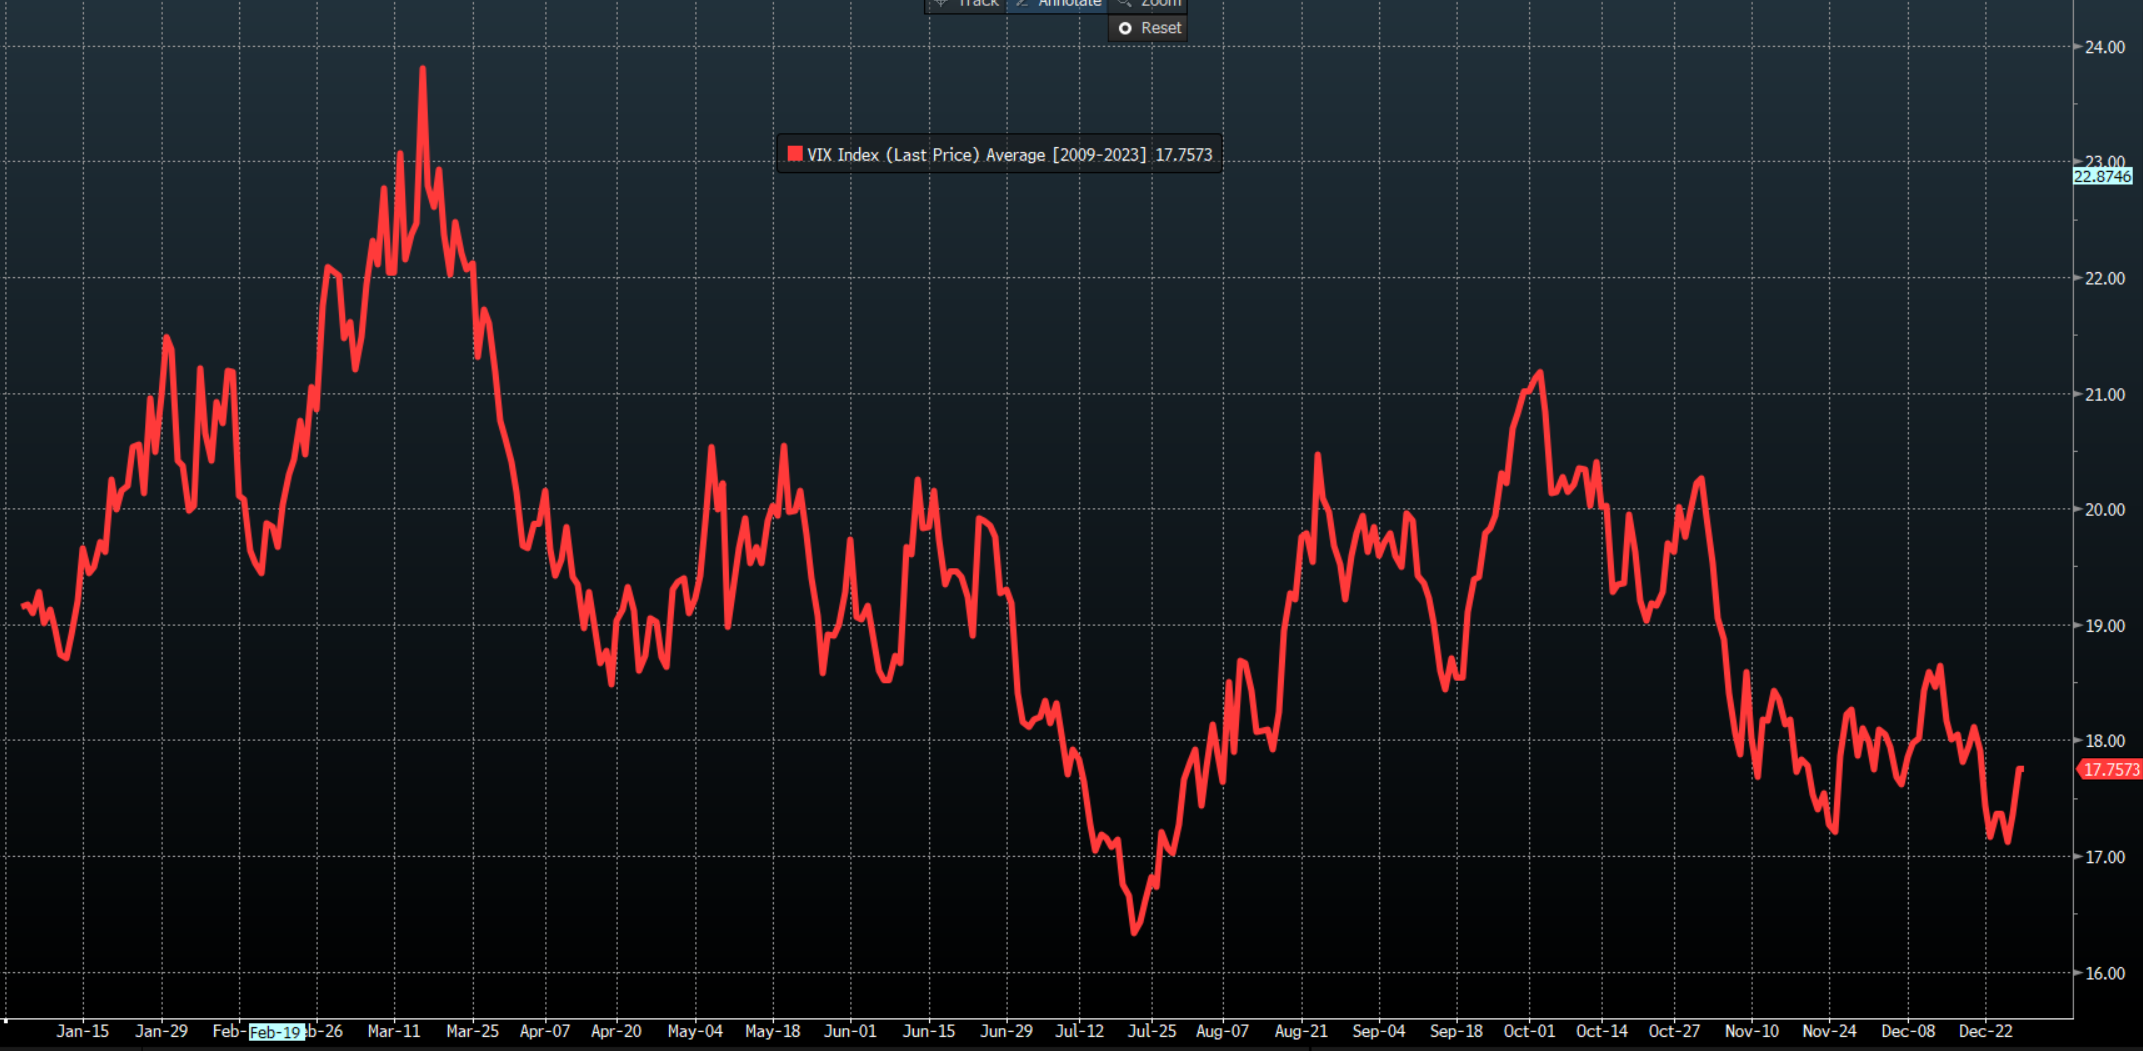
Over the past 15 years, the VIX index has historically seen a strong rise in Q1, with the period between 12 January and 15 March the most prosperous period to be long the VIX index and equity vol.
15 years of blended VIX returns
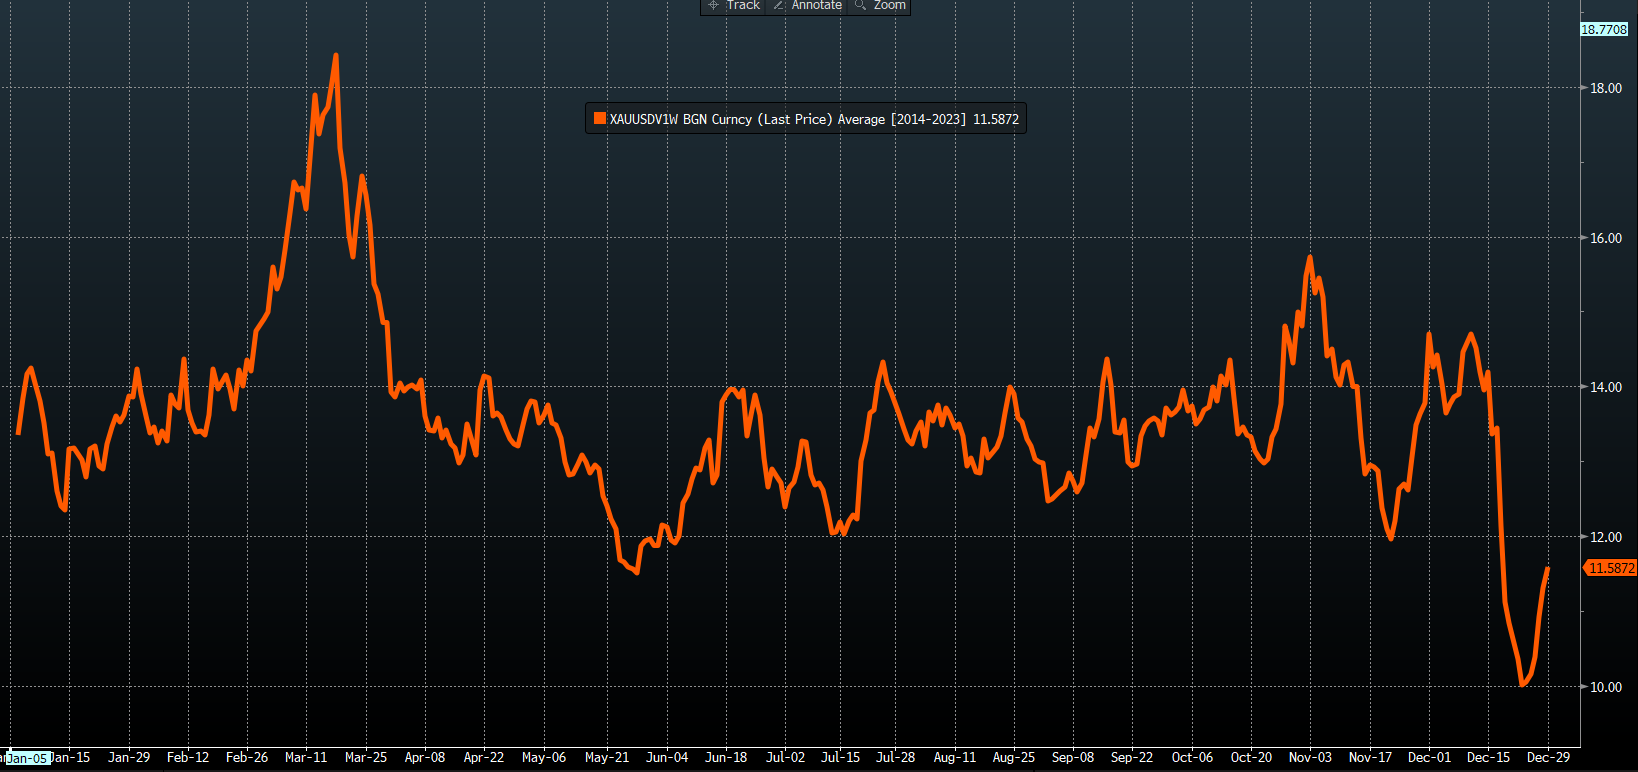
This seasonal form is also true of gold, with Gold 1-week (options) implied vol rising on average (over the past 10 years) by 6.1 volatilities between 13 January to 18 March. In FX markets, 1-week and 1-month G10 FX implied vol has also typically risen through Q1.
10 years of blended moves in Gold 1-week implied volatility
While history doesn’t repeat, from a historical and seasonal perspective, we’re moving into a sweet spot for higher volatility.
We should also consider the incredible performance of the US and many other DM equity markets in 2024. The extent of the YTD gains has lifted valuations to multi-year highs and reduced the equity risk premium to the lowest levels since 2002, while net long positioning in S&P500 and NAS100 futures is also incredibly rich.
There isn’t much of a cushion to absorb bad news, and with active managers turning the page on the new calendar year, there may well be some unwanted positions that could be quickly cut.
The Implementation of Trade Tariffs
Tariff risk is arguably one of the big impending market themes for all market players to navigate from Q125, and the media headlines may soon appear to get quite ugly.
Traders will need to decipher the headlines and consider what is signal and what is noise and that will be a challenge. Trump will want to send a message to US voters of strong leadership and that his team is fighting for the best outcome for the US. Of course, so will the Chinese, Mexican, Canadian and European negotiating teams – what is portrayed in the headlines and what plays out behind closed doors may be two very different affairs.
We also need to consider that the level of tariffs that have been proposed may not eventuate and the final tariff rate could ultimately be lower than what has been threatened.
Still, the prospect of spicy negotiations – at least superficially – could well lead to higher volatility in markets through Q1, with increased tariff noise resulting in a more challenging environment for traders to price risk.
US Economic Data Trends
We roll into 2025 with US GDP tracking at a healthy 3.3% run rate, the labour market in fairly good shape, with a widely held view that core inflation should reach the Fed’s target in 2025. The Fed remain open-minded to further cuts, but this is conditional on the incoming data flow.
The probability that the US growth and labour data continues to offer a low degree of recession risk seems high – for now - but we should consider the possibility of a further cooling in employment, where a higher unemployment rate would impact market sentiment and lead to de-risking.
Conversely, should we see higher inflation expectations that lifts US 10-year Treasury yields above 4.5% and towards 5%, then higher yields could also lead to traders taking down risk and buying equity and USD volatility. Subsequently, the US Treasury market could be highly influential on cross-market vol in Q1 and beyond.
Fed Rate Cuts: Moving closer to the end
Perhaps a theme for Q2, but there is a camp that strongly believes we may not see any further rate cuts from the Fed in 2025. One could argue that risky assets would still perform favourably even without the Fed cutting rates, as long its driven by strong consumption and labour market data.
However, if the growth data eases off, while higher inflation is the reason for reduced rate cut expectations, then any ‘stagflation’ dynamic would result in high volatility, USD strength and risky assets facing the prospect of drawdown.
China may not be ‘investible’ but it’s certainly tradeable
Traders have seen several false starts and failed attempts from the buyers to push Chinese/HK equity markets sustainably higher. In recent policy meetings, we’ve heard a strong commitment from policymakers to put in measures in 2025 to reflate the economy and to drive increased demand and animal spirits, but we’re yet to hear a defined plan of implementation.
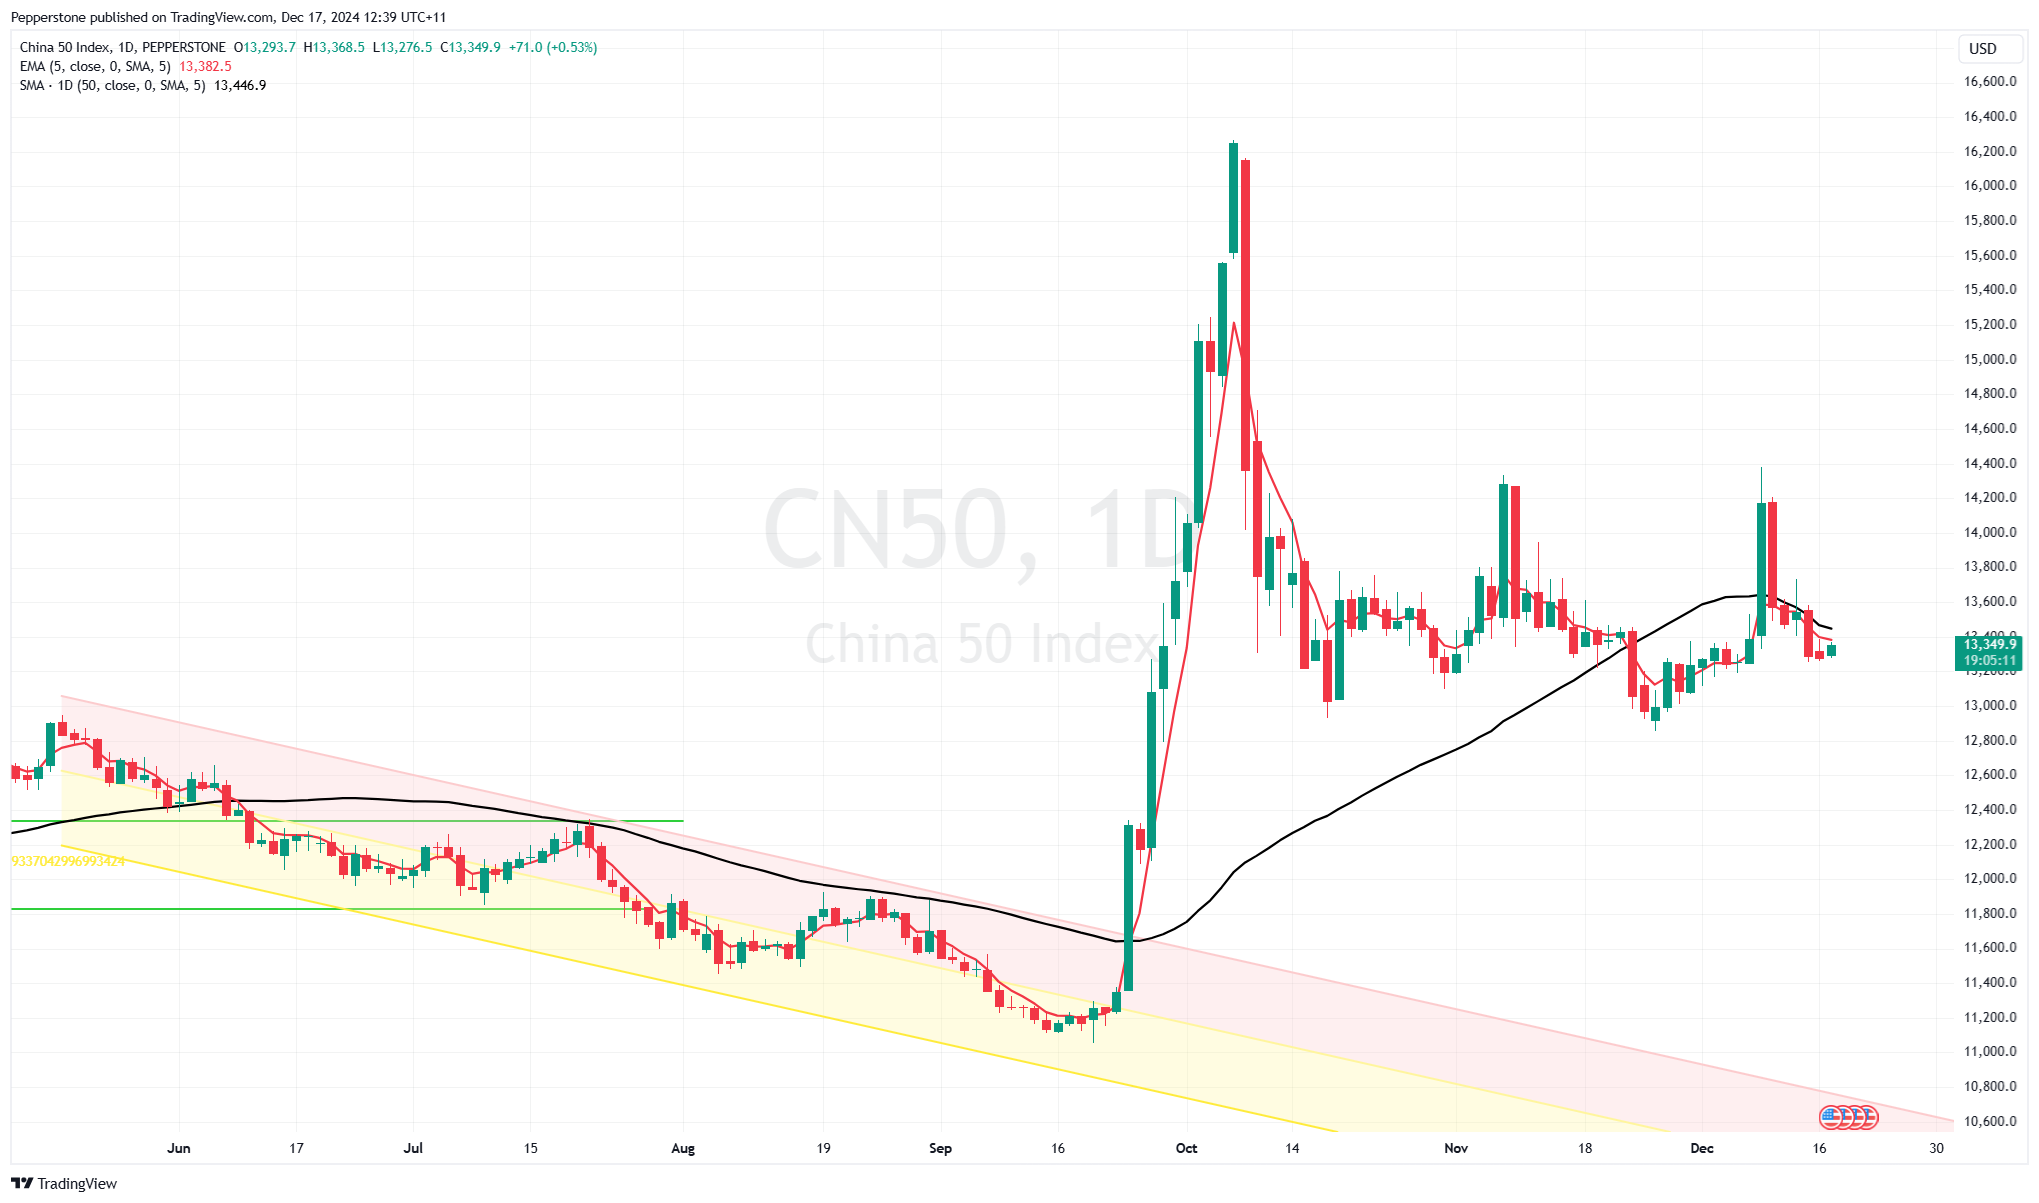
With the threat of trade tariffs still a big unknown, many feel China is currently ‘uninvestible’. However, as we look to China’s NPC meeting (due in early March), the market will likely ratchet up expectations for a plan that offers the definition and the substance to kick-start its economy.
As we head through February cast your eyes towards China’s equity markets and the CNH (yuan) as the prospect of increased vol is elevated. I sense that returns in 2025 for China/HK50 equity markets could either be greater than 40%, or down by 20%+ - but either way, volatility in returns seems high and I sit in the camp that China could really surprise the bears in 2025.
Bring on the volatility
There are obviously many other factors that could lead to higher volatility or even reduce vol further. But after a year of low cross-asset volatility, the risk in my mind is for higher volatility to play out.
As always, should we move into a higher vol environment traders need to adapt and manage the risk that comes with higher volatility and assess their position sizing.
Good luck to all.
The material provided here has not been prepared in accordance with legal requirements designed to promote the independence of investment research and as such is considered to be a marketing communication. Whilst it is not subject to any prohibition on dealing ahead of the dissemination of investment research we will not seek to take any advantage before providing it to our clients.
Pepperstone doesn’t represent that the material provided here is accurate, current or complete, and therefore shouldn’t be relied upon as such. The information, whether from a third party or not, isn’t to be considered as a recommendation; or an offer to buy or sell; or the solicitation of an offer to buy or sell any security, financial product or instrument; or to participate in any particular trading strategy. It does not take into account readers’ financial situation or investment objectives. We advise any readers of this content to seek their own advice. Without the approval of Pepperstone, reproduction or redistribution of this information isn’t permitted.