- English
- 中文版
Gold Outlook: Bearish pressure persists despite short-term support
.jpg?height=93&quality=100)
Following a sharp bout of short-selling, gold found a bottom near $3,167 last week. A breakthrough in trade negotiations and easing concerns over a U.S. recession have emerged as major headwinds for the metal. Nevertheless, lingering uncertainty around future tariff discussions and the Fed’s rate-cut trajectory has helped establish a floor for prices.
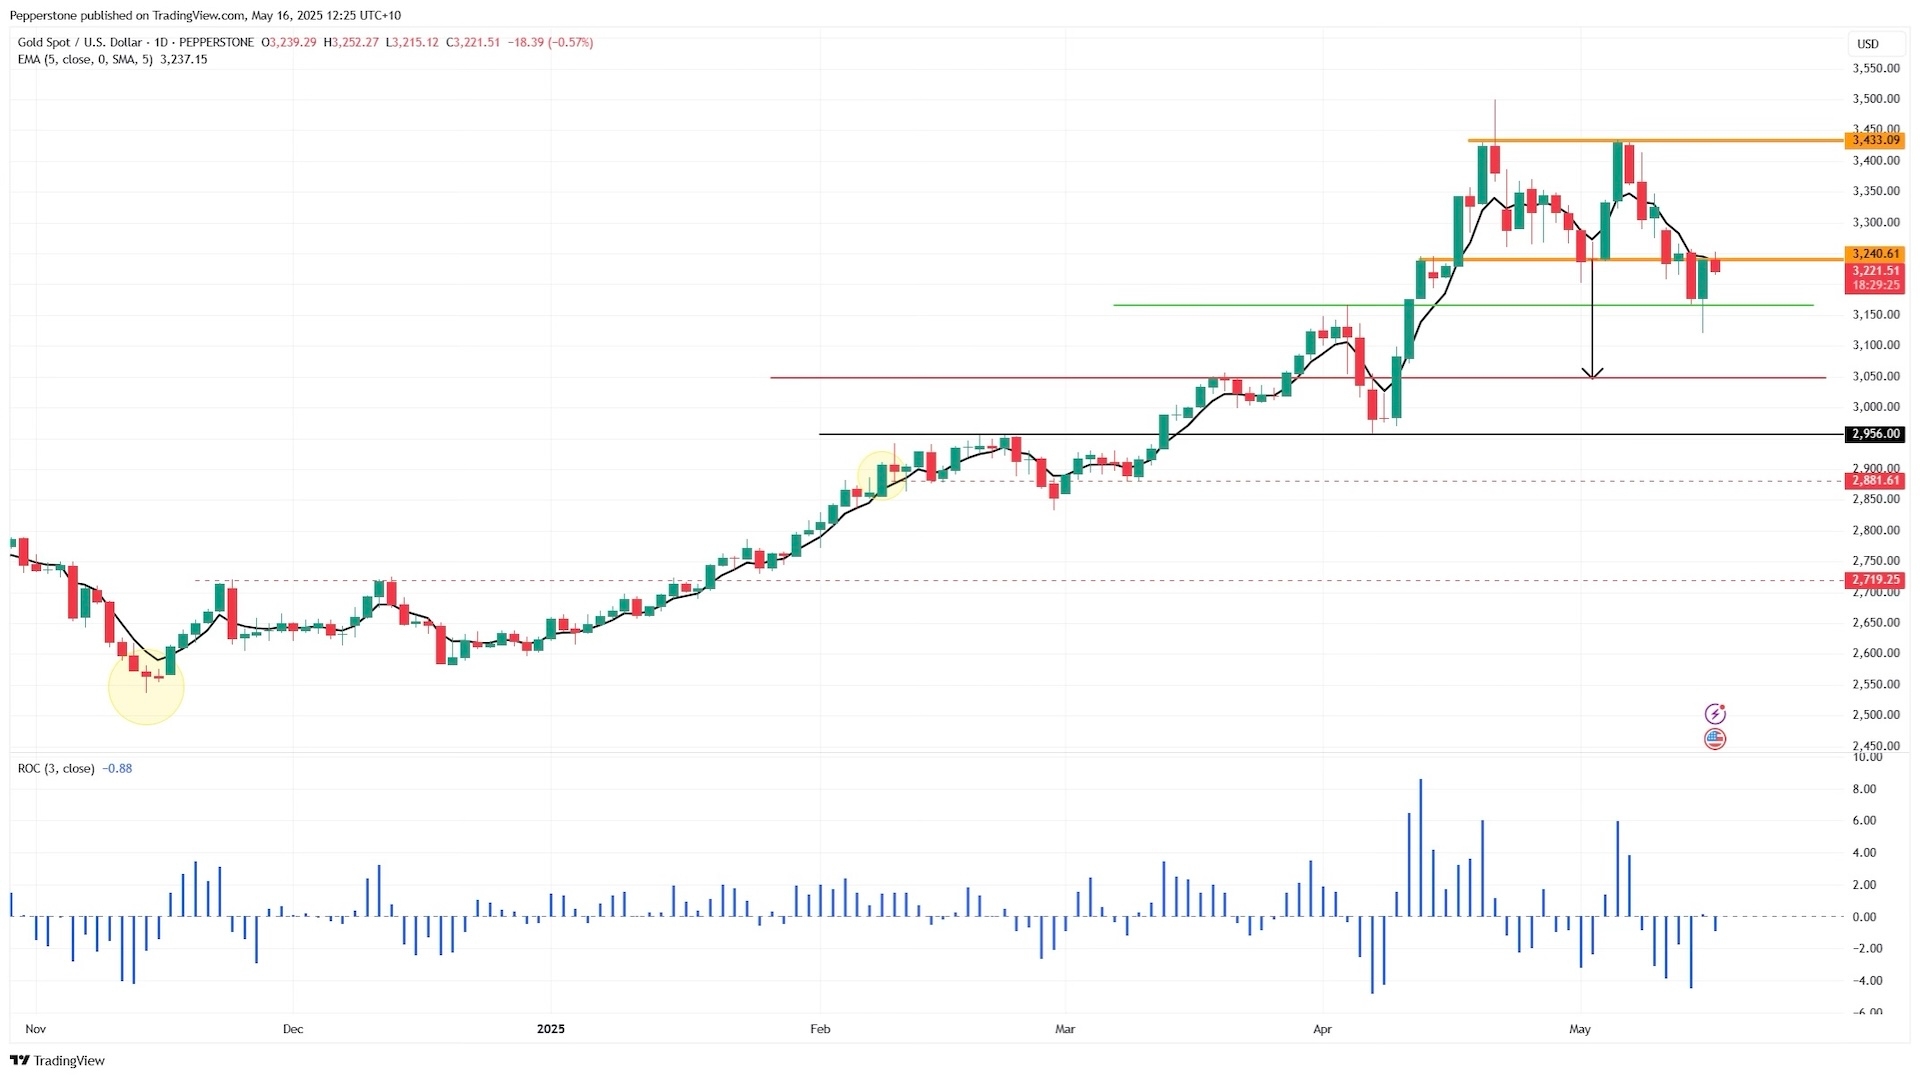
On the XAUUSD daily chart, bears remained in control through last Thursday, as reflected by the negative 3-day Rate of Change (RoC). Selling pressure drove prices below the lower bound of the consolidation range around $3,240 that had been in place since late April. This also means that all the dip-buyers who got long near $3,177 are likely underwater now and may need to reassess their positions, which often results in more selling.
Meanwhile,the decline from the early May peak exceeded 9%, completing a textbook double-top pattern that had developed since early April. Subsequently, buyers stepped in, and price action once again converged near the $3,240 level, where bulls and bears continue to contest direction.
Should bearish pressure resume this week, the April 3 high of $3,167 and the 50-day moving average could serve as near-term support. Below that, the $3,050 level may attract renewed demand — a level consistent with the projected downside target derived from the double-top pattern. On the upside, the 5-day EMA and the upper boundary of the previous range near $3,380 may act as resistance.
Notably, gold’s sharp retreat has mirrored the de-escalation in trade tensions, contrasting starkly with the “sell America” narrative that prevailed just a month ago amid heightened fears of a trade war.
The shift in sentiment began with a US-UK agreement to maintain the baseline 10% tariff while reducing auto tariffs from 25% to 10%. This was followed by a breakthrough in U.S.-China negotiations: both sides agreed to a substantial reduction in tariffs and the adoption of a uniform 10% rate, with the remaining 24% in duties suspended for 90 days.
As tensions eased, U.S. recession probabilities - as priced by betting markets - fell by 11 percentage points to 39%. Combined with a decline in geopolitical risks, the result was a sharp fall in safe-haven demand, triggering a broad pullback in gold buying.
That said, U.S. inflation data in April showed tentative signs of cooling. Core CPI rose just 0.2% MoM, below the 0.3% consensus, while PPI also moderated. In addition, the retail sales control group declined by 0.2% MoM, falling short of expectations. Although the Fed remains in wait-and-see mode, these developments prompted a modest dovish pricing in rate-cut expectations.
Moreover, despite the current easing in trade tensions, markets remain cautious in light of persistent concerns over U.S. debt, twin deficits, and longer-term fiscal imbalances — all of which continue to provide underlying support for gold.
Overall, gold came under heavy pressure last week but managed to defend key support at $3,240. Although softer inflation and retail data offered some relief, the ongoing decline in tariff-related risk premiums suggests a sustainable upward trend may take time to develop.

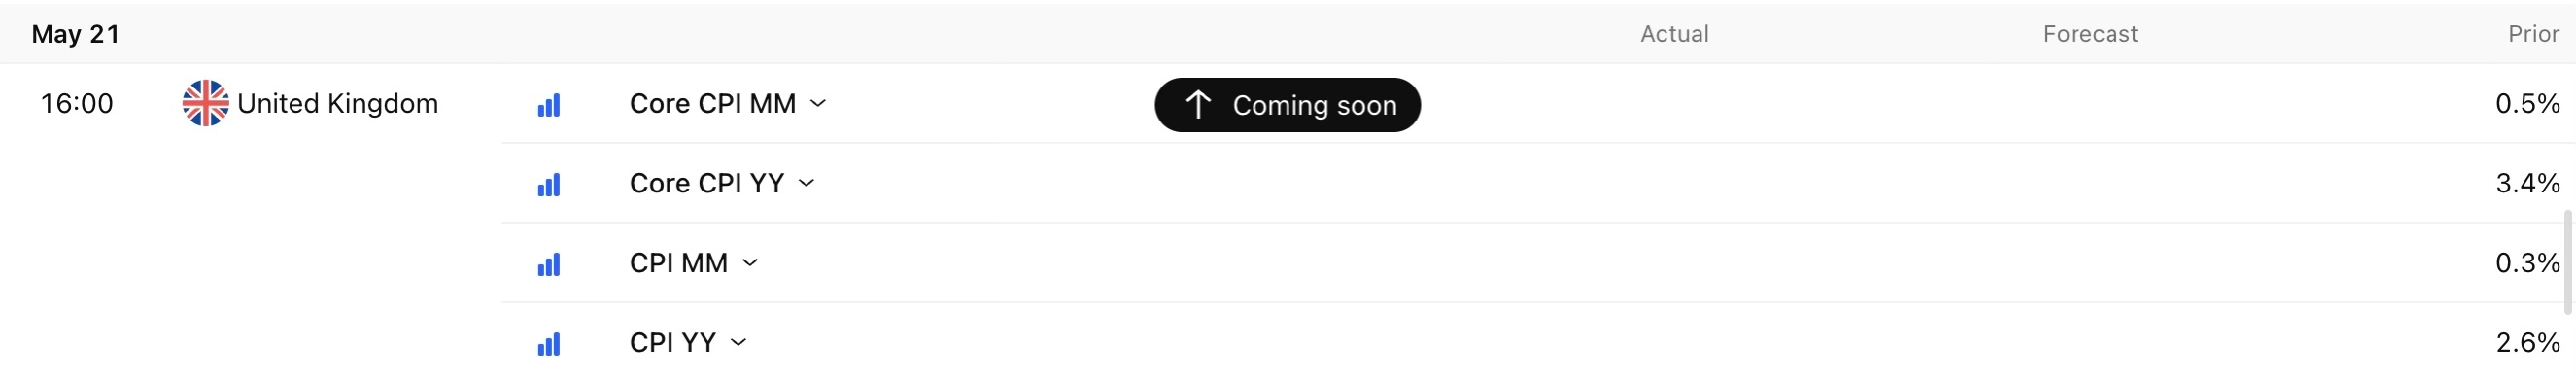
Looking ahead, traders will be monitoring not only progress in trade talks but also key economic releases, including China’s retail sales and industrial production figures due Monday - both of which are expected to show slower year-on-year growth in April. The UK CPI release on Wednesday will also be in focus. Should Chinese data point to a fragile recovery and UK inflation surprise to the downside, gold may see modest support from both a safe-haven and opportunity cost perspective.

Lastly, gold ETF flows remain a crucial indicator. Global physical gold demand rose just 1% year-on-year in Q1 - the strongest first quarter since 2016 - almost entirely driven by investment inflows, as central bank purchases moderated and jewelry demand in China and India remained subdued.
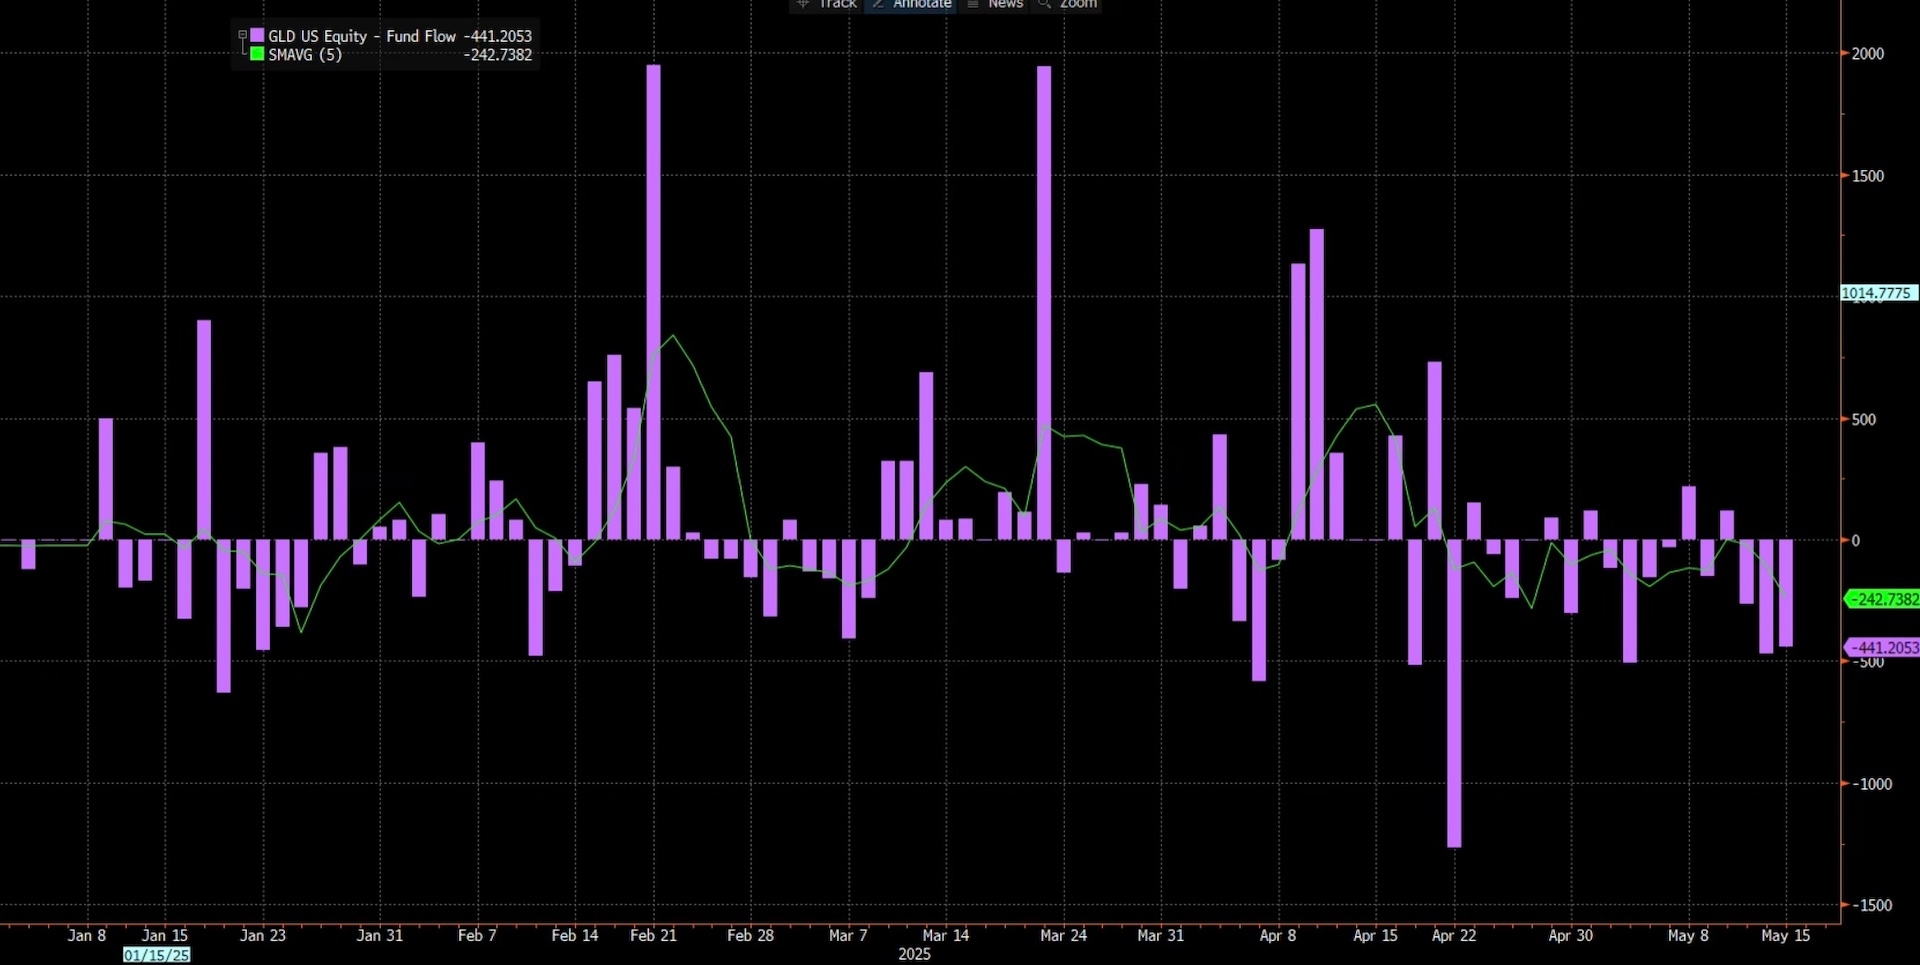
However, gold ETFs have seen consistent outflows recently. If this trend persists, it could add further pressure on gold prices.
All told, despite some signs of stabilisation, I think it’s too early to call a bottom with conviction. The recent retreat has been driven by both fundamental and technical factors, and unless there's a more decisive shift in the macro backdrop, gold is more likely to remain range-bound - or even extend its downtrend.
The material provided here has not been prepared in accordance with legal requirements designed to promote the independence of investment research and as such is considered to be a marketing communication. Whilst it is not subject to any prohibition on dealing ahead of the dissemination of investment research we will not seek to take any advantage before providing it to our clients.
Pepperstone doesn’t represent that the material provided here is accurate, current or complete, and therefore shouldn’t be relied upon as such. The information, whether from a third party or not, isn’t to be considered as a recommendation; or an offer to buy or sell; or the solicitation of an offer to buy or sell any security, financial product or instrument; or to participate in any particular trading strategy. It does not take into account readers’ financial situation or investment objectives. We advise any readers of this content to seek their own advice. Without the approval of Pepperstone, reproduction or redistribution of this information isn’t permitted.